Abstract
AbstractMeasles virus (MeV) remains a major human pathogen, but there are presently no licensed antivirals to treat MeV or other paramyxoviruses. Here, we use cryo-electron tomography (cryo-ET) to elucidate the principles governing paramyxovirus assembly in MeV-infected human cells. The three-dimensional (3D) arrangement of the MeV structural proteins including the surface glycoproteins (F and H), matrix protein (M), and the ribonucleoprotein complex (RNP) are characterized at stages of virus assembly and budding, and in released virus particles. The M protein is observed as an organized two-dimensional (2D) paracrystalline array associated with the membrane. A two-layered F–M lattice is revealed suggesting that interactions between F and M may coordinate processes essential for MeV assembly. The RNP complex remains associated with and in close proximity to the M lattice. In this model, the M lattice facilitates the well-ordered incorporation and concentration of the surface glycoproteins and the RNP at sites of virus assembly.
🔬 Techniques
✨ Fluorophores
🔬 Cell Lines
🏭 Microscope Brands
🧪 Reagent Suppliers
💻 Software Details
💾 Data Repositories
🏛️ Research Organizations (ROR)
Affiliated research institutions:
📋 Methods
Cryo-grid preparation
Details of sample preparation were described previously 50 . HeLa (ATCC CCL-2), MRC-5 (CCL-171), and Vero (CCL-81) cells were maintained in DMEM medium supplemented with 10% fetal bovine serum (FBS), 1 µg ml −1 penicillin, streptomycin, and amphotericin B (PSA) antibiotics. Cells were maintained at 37 °C with 5% CO 2 . 50,000–100,000 cells were seeded on gold R 2/1 Quantifoil TEM grids (Quantifoil) in MatTek dishes (MatTek Corp) 16–24 h prior to infection. Cells were inoculated with MeV strains (Edm or recMeV-(H-118∇41×), provided by Professor Richard Plemper, Georgia State University) at a multiplicity of infection (MOI) of 1, 2, 6, or 10. After 24–48 h incubation, the MeV-infected cells on the grids were plunge frozen in liquid ethane using the Gatan Cryoplunge 3 (Gatan, Pleasanton, CA) after applying 4 µl of BSA-treated 10 nm gold fiducials (EMS) 50 directly onto the grid. Cryo-grids were stored in liquid nitrogen until imaged.
MeV thermal stability assay
For the heat treatment experiment, HeLa cells were seeded onto gold R 2/1 Quantifoil grids in MatTek dishes and infected at a MOI of 2 with MeV Edm strain. Twenty-four hours post infection, the MatTek dishes containing the infected cells were incubated at 60 °C for the indicated time points 6 . Immediately after heat treatment, the grids were plunge frozen as described above. Meanwhile, the remaining infected cells from the same MatTek dish (where the grids were cultured) were scraped, harvested, and subjected to TCID 50 titration. Virus titration was performed using the endpoint method and the virus titer was expressed as TCID 50 per ml (TCID 50 /ml) calculated with the Spearman-Karber method 51 , 52 . Briefly, the virus sample was serially diluted from 10 −1 to 10 −6 . Fifty microliter of the diluted virus was added to the confluent Vero cells in 96-well plates. Eight replicates were performed at each dilution for each sample. The infected cells were incubated for 4 days before determining the titration based on the cytopathogenic effect. Three independent experiments were performed to show the effect of heat treatment on virus titer and structural organization.
Show full methods section
Cryo-grid preparation
Details of sample preparation were described previously 50 . HeLa (ATCC CCL-2), MRC-5 (CCL-171), and Vero (CCL-81) cells were maintained in DMEM medium supplemented with 10% fetal bovine serum (FBS), 1 µg ml −1 penicillin, streptomycin, and amphotericin B (PSA) antibiotics. Cells were maintained at 37 °C with 5% CO 2 . 50,000–100,000 cells were seeded on gold R 2/1 Quantifoil TEM grids (Quantifoil) in MatTek dishes (MatTek Corp) 16–24 h prior to infection. Cells were inoculated with MeV strains (Edm or recMeV-(H-118∇41×), provided by Professor Richard Plemper, Georgia State University) at a multiplicity of infection (MOI) of 1, 2, 6, or 10. After 24–48 h incubation, the MeV-infected cells on the grids were plunge frozen in liquid ethane using the Gatan Cryoplunge 3 (Gatan, Pleasanton, CA) after applying 4 µl of BSA-treated 10 nm gold fiducials (EMS) 50 directly onto the grid. Cryo-grids were stored in liquid nitrogen until imaged.
MeV thermal stability assay
For the heat treatment experiment, HeLa cells were seeded onto gold R 2/1 Quantifoil grids in MatTek dishes and infected at a MOI of 2 with MeV Edm strain. Twenty-four hours post infection, the MatTek dishes containing the infected cells were incubated at 60 °C for the indicated time points 6 . Immediately after heat treatment, the grids were plunge frozen as described above. Meanwhile, the remaining infected cells from the same MatTek dish (where the grids were cultured) were scraped, harvested, and subjected to TCID 50 titration. Virus titration was performed using the endpoint method and the virus titer was expressed as TCID 50 per ml (TCID 50 /ml) calculated with the Spearman-Karber method 51 , 52 . Briefly, the virus sample was serially diluted from 10 −1 to 10 −6 . Fifty microliter of the diluted virus was added to the confluent Vero cells in 96-well plates. Eight replicates were performed at each dilution for each sample. The infected cells were incubated for 4 days before determining the titration based on the cytopathogenic effect. Three independent experiments were performed to show the effect of heat treatment on virus titer and structural organization.
Data collection and 3D reconstruction and image processing
Data collection and image processing procedures were previously outlined 50 and parameters used for data collection are presented in the supplementary materials (Supplementary Table 2 ). Cryo-ET data collection was carried out using a JEOL JEM-2200FS 200 kV FEG-TEM (JEOL Ltd., Tokyo, Japan) with an in-column Omega energy filter (slit width 20 eV). Polygon montages were collected at 10,000× nominal magnification using a US4000 4k x 4k camera (Gatan, Pleasanton, CA). Tilt series images were collected on a DE-20 ~5k x 4k direct electron detector (Direct Electron LP, San Diego, CA) in movie mode. Images were acquired at magnifications resulting in effective pixel sizes of 2.94 Å (20,000× nominal magnification) or 6.14 Å (10,000× nominal magnification) on the level of the specimen. Bidirectional tilt series were semi-automatically collected with 2° angular increments using the SerialEM package 53 . A cumulative electron dose between 120 and 140 e − Å −2 was used. All frames were motion corrected and damage compensated using python scripts (DE_process_frames-2.8.1.py and DE_damage_compensate-1.0.0.py) provided by Direct Electron. Tomograms were reconstructed from the aligned images and CTF corrected by phase flipping using the IMOD software package 54 , 55 . 3D volumes were segmented manually using the Amira software program (FEI Visualization Sciences Group, Hillsboro, OR). Linear density profiles were measured from the tomographic slices in Fiji software 28 , 56 . The number of glycoproteins and viral membrane lengths were measured from the tomographic data; model points (scattered points) were placed on the glycoproteins and the viral membrane (open contours) and the IMOD command imodinfo was used to extract the quantitative data. Power spectra were generated in IMOD using the FFT tool. Graphs and statistical analyses were done with GraphPad Prism version 6.0. RNP length quantification was carried out using the reconstructed tomographic data in IMOD package, similarly to what has been published 27 , 28 . Briefly, model points were placed as open contours along the RNP in the tomogram (Supplementary Figure 10 , Supplementary Movies 9 – 10 ). M-coated and uncoated RNP length measurements were done separately. RNP segment lengths were extracted using the imodinfo command and were added together to represent the total RNP length in the released MeV particle. The H glycoprotein organization was analyzed using either the tomographic slices or the projections onto the XY plane along the Z -axis. For the analysis, the recMeV-(H-118∇41×) strain was used since the H and F glycoproteins can be distinguished based on their height differences (Supplementary Figure 2 ). Power spectra of the single tomographic slices at the assembly sites were generated using the EMAN2 command 57 e2proc2d.py input.mrc output_powerspectrum.mrc --process = math.realtofft. Volumes of the F and H layer (~8 nm thickness) were projected onto the XY plane along the Z -axis using the IMOD command xyzproj, separately. The power spectra of the 2D projections were generated using EMAN2 command as described above (Supplementary Figure 7 ). The threshold was adjusted manually to a level that the ordering of the glycoproteins could be identified by the reflections.
Sub-volume averaging
Sub-volume averaging was performed using the PEET software package 40 , 58 . In some cases when the center of the mask was different from the center of the sub-volume, binary masks were generated with SPIDER 59 . All tomograms used for sub-volume averaging were collected at a pixel size of 2.94 Å, then binned by a factor of 2. Tomographic volumes were normalized using e2proc3d.py command (EMAN2) 60 prior to iterative alignment and refinement in PEET (version 1.11.0 alpha). The parameters used for each structure are summarized in Supplementary Table 3 . Sub-volume averaging of the M lattice For both Edm and recMeV-(H-118∇41×) strains, the sub-volumes were manually picked from IMOD Slicer Window and centered on the M layer from low-pass filtered tomograms (binned by 4). The distance between the nearest sub-volumes was around 12 pixels (~ 7 nm). The initial orientations of the sub-volumes were determined by rotating the tomogram so that the M lattice was parallel to the XY plane and the RNP was vertical in the XY view in the IMOD Slicer Window. An initial reference model was generated from the sub-volumes with the pre-determined rotations and averaged in PEET. Sub-volume averages were iteratively generated and refined using the tomographic data binned by 4 (pixel size 11.76 Å), and then the coordinates scaled by 2 were applied to the tomographic data binned by 2 (pixel size 5.88 Å). Sub-volume dimensions ( X , Y , Z ) in pixels (binned by a factor of 2) were 80, 80, and 64. A soft-edge cylindrical mask (radius of 32 pixels and height of 16 pixels at binning by 2) was applied to the M layer. The height of the mask was set to exclude the densities corresponding to the glycoproteins and the RNP complex. The PEET command modifyMotiveList and the initial XYZ angles from the Slicer Window were used to create the initial motive lists. To compensate for the effect of the missing wedge on the tomographic data, 8 weighted groups were used during the alignment and averaging process in PEET. To avoid density bias between sub-volumes, individual sub-volumes were normalized. The initial reference model was generated from the unaligned sub-volumes with the pre-determined rotations from IMOD Slicer window and averaged in PEET. Iterations of alignment in 6 dimensions (translations and rotations) were performed with decreasing search distances and angles; the reference was refined at each iteration step. Duplicate and low cross-correlation coefficient (CCC) valued sub-volumes were removed after iterative alignment and refinement. Sub-volumes within a distance of 10 pixels (binned by 2) were treated as duplicates and all sub-volumes but those with the highest CCC were removed (~50% were removed (1437 out of 2540 were removed for recMeV-(H-118∇41×); 1241 out of 2200 were removed for Edm MeV). The CCC value was set to the average CCC of all the remaining sub-volumes and another ~50% were removed (478 out of 1103 were removed for recMeV-(H-118∇41×); 473 out of 959 were removed for Edm MeV). After removing the duplicates and low-CCC valued sub-volumes, ~25% (625 out of 2540 for recMeV-(H-118∇41×); 486 out of 2200 for Edm MeV) of the total sub-volumes were averaged into the final reconstruction 61 . No symmetry was applied during the alignment and averaging process. The averaged structure was low-pass filtered to 35 Å according to the frequency at FSC 0.5 cutoff (Supplementary Table 3 , Supplementary Figure 12 ). Sub-volume averaging of the F lattice Sub-volume averaging of the F lattice was done in a similar way as the M lattice, except that the sub-volumes (96 × 96 × 96 pixels) were picked and centered on the F layer from the recMeV-(H-118∇41×) tomographic data and a soft-edge cylindrical mask (radius of 32 pixels and height of 72 pixels) was used to include only the F layer. Iterative alignment was done similarly to the M lattice. Briefly, the initial reference model was generated from the sub-volumes with the pre-determined rotations from IMOD Slicer Window and averaged in PEET. Iterations of alignment in 6 dimensions (translations and rotations) were performed with decreasing search distances and angles, and the maximum search distance in X and Y directions was 16 pixels. Missing wedge compensation was enabled with 8 weighted groups and the reference was refined at each iteration step. No symmetry was applied during the alignment and averaging process. The averaged structure was low-pass filtered to 45 Å according to the frequency at FSC 0.5 cutoff (Supplementary Table 3 , Supplementary Figure 12 ). Sub-volume averaging of the F glycoprotein trimer The sub-volume alignment process was similar to the protocol we used for the RSV F glycoprotein averaging 34 . Sub-volumes (64 × 64 × 64, 37.6 nm) were extracted from the reconstructed tomograms. The distance between the nearest sub-volumes was 16 pixels (9.4 nm). SpikeInit (PEET command) was used to determine the initial Euler angles and these initial Euler angles were used to generate an initial model of F. A cylindrical mask (radius of 12 pixels and height of 28 pixels) was used to eliminate the neighboring densities. We generated an averaged structure of MeV F from a relatively homogeneous F only region on a recMeV-(H-118∇41×) virus particle using top and side views, taking advantage of the height differences between glycoproteins H and F (Supplementary Figure 2 ). Since the MeV F glycoprotein is known to be a trimer and can be seen in the tomogram as such, we applied three-fold (C3) symmetry by rotating the sub-volumes 120 degrees and 240 degrees around the Y axis in the motive list file. Iterative alignment and averaging steps were performed in 6 dimensions (translation and rotation), with decreasing search distances and angles at each iteration step; the reference was refined after each iteration step. In order to generate the averaged F structure from the mixed population of F and H in recMeV-(H-118∇41×) sample, we extracted sub-volumes of F from the top and side views based on the glycoprotein height differences in H and F (Supplementary Figures 2 , 4 ). The averaged F structure from above was used as the initial reference, and the process was done similarly to the methods described above. Sub-volume averaging of the F–M lattice Sub-volume averaging of the F-M lattice in both Edm and recMeV-(H-118∇41×) data sets was done similarly to the methods described above for the M lattice. Briefly, sub-volumes (80, 80, 128 pixels, binned by 2) were picked and centered on the M layer and a soft-edge cylindrical mask (radius of 32 pixels and height of 72 pixels) was used to exclude regions outside of the F and M layers. After iterative alignment and averaging at the binning by 4 level, duplicate sub-volumes and low-CCC valued sub-volumes were removed prior to final alignment and averaging at the binning by 2 level. The procedures and criteria for removing the duplicate and low-CCC valued sub-volumes for F-M lattice is the same as the M lattice. Briefly, about ~50% (1357 out of 2540 were removed for recMeV-(H-118∇41×); 1138 out of 2200 were removed for Edm MeV) of duplicate sub-volumes were removed, and another ~50% (574 out of 1183 were removed for recMeV-(H-118∇41×); 598 out of 1062 were removed for Edm MeV) of the low-CCC valued sub-volumes were removed from the remaining sub-volumes 61 . About 25% (609 out of 2540 for recMeV-(H-118∇41×); 464 out of 2200 for Edm MeV) of the particles were used for final reconstruction (Supplementary Table 3 ). References were refined after each iteration and missing wedge compensation was enabled during the alignment and averaging process. Sub-volume averaging of the RNP helix Sub-volume averaging of the RNP helical structure was done in PEET. The sub-volumes were picked in the IMOD Slicer Window by rotating the RNP to be vertical (going down the Y axis). The XYZ angles from the Slicer Window were used to generate the initial motive lists using the command modifyMotiveList. The initial model of the RNP helix was created using a small set of sub-volumes, and the initial helix pitch (85.6 Å) was determined by measuring the distance to make a full helix turn from the initial model. We applied helical symmetry based on the known parameters of the MeV RNP structure 10 , 11 , 22 , 48 , 49 , a one-start left-handed helix with ~13 subunits per turn, by modifying the rotational and translational parameters of each sub-volume in the csv files (the aligned particle coordinates from PEET) using the modifyMotiveList command. For alignment, a cylindrical mask (64 pixels in height) was used with an inner radius of 4 pixels and an outer radius of 24 pixels (pixel size 5.88 Å), and missing wedge compensation was enabled. After iterative refinement and averaging, the global averaged structure showed a clear left-handed helix, with stronger density in the central segment of the helix while the two ends were weaker. We performed classification using principle component analysis (PCA) and K-means clustering with a cylindrical mask and generated class averages. When running K-means clustering after PCA with the command clusterPca, we used 2, 4, 6, or 8 as the nCluster parameter. The best results were obtained using 2 classes (1841 sub-volumes in class 1 and 1084 sub-volumes class 2). When using greater than 2 as the nCluster parameter, classes were generated based on the missing wedge artifact instead of the variance in the RNP structure. Two classes of the RNP were generated as shown in Fig. 5 . The PEET/IMOD commands createAlignedModel and clonemodel were used to place the sub-volume averaged structure back into the raw tomogram. The EM density of the RNP helix was visualized in Chimera software 62 . Variance map and the organization of H glycoprotein We did not detect ordering of the H glycoprotein as seen in the M and F 2D lattices (seen in tomographic data, power spectra, sub-volume averages in Supplementary Figure 7 ). Tomograms of recMeV-(H-118∇41×) virus did not contain ordered arrays of H, neither did the power spectra of tomographic slices or sub-volume averages (Supplementary Figure 7 ). In order to assess the lack of ordering of the H glycoprotein, we generated variance maps from sub-volumes used to generate the initial model and the aligned class average (Supplementary Figure 4 ). To calculate the variance, we applied a mask including only the F–H region, with the averaged structure being the trueFile (PEET input, MRC format file representing an estimation of the true particle). All particles, except for the duplicates and low-CCC valued sub-volumes, and the final iteration number were used in the varianceMap analysis. The highest variance was seen in the H layer and not the F layer or M layer (Supplementary Figure 5 ).
Model fitting
X-ray crystal structures of the MeV M and F homologs were used for model fitting in Chimera software 62 . The dimeric crystal structure of NDV M (PDB ID: 4GIL) was manually fitted into the low-pass filtered M lattice EM density map as rigid body 16 . The trimeric crystal structure of PIV5 prefusion F (PDB ID: 2B9B, with the trimeric coiled-coil GCNt domain removed) 37 was manually fitted as rigid body into the low-pass filtered F glycoprotein EM density. Visualization and image rendering were done using Chimera program 62 .
Data availability
All relevant data are available from the corresponding author upon reasonable request. All sub-volume averages have been deposited in the Electron Microscopy Data Bank ( www.emdatabank.org ) under the following accession numbers: EMD-7565 , EMD-7566 , EMD-7587 , EMD-7588 , EMD-7590 , EMD-7591 , EMD-7594 , EMD-7595 , EMD-7596 , and EMD-7597 . Refer to Supplementary Table 3 for details.
Electronic supplementary material Supplementary Information Description of Additional Supplementary Files Supplementary Movie 1 Supplementary Movie 2 Supplementary Movie 3 Supplementary Movie 4 Supplementary Movie 5 Supplementary Movie 6 Supplementary Movie 7 Supplementary Movie 8 Supplementary Movie 9 Supplementary Movie 10
📊 Figures
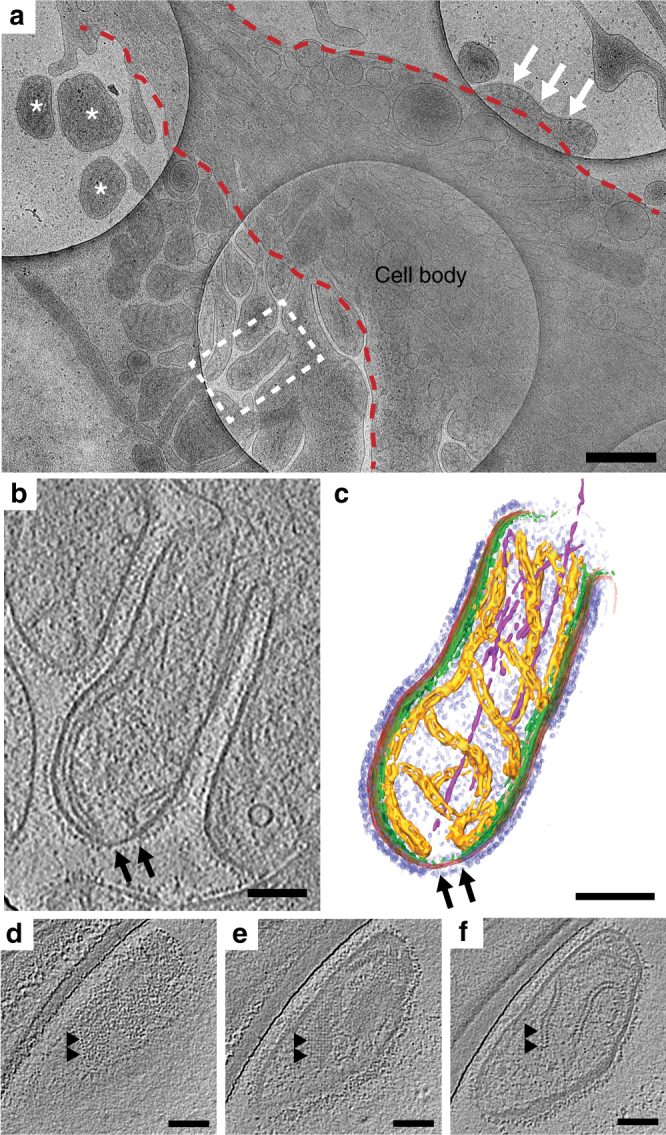
Fig. 1
Cryo-ET of MeV-infected HeLa cell. a An intermediate magnification image montage of an Edm MeV-infected HeLa cell. Site of MeV assembly is indicated by dashed white box and is the location where the t...
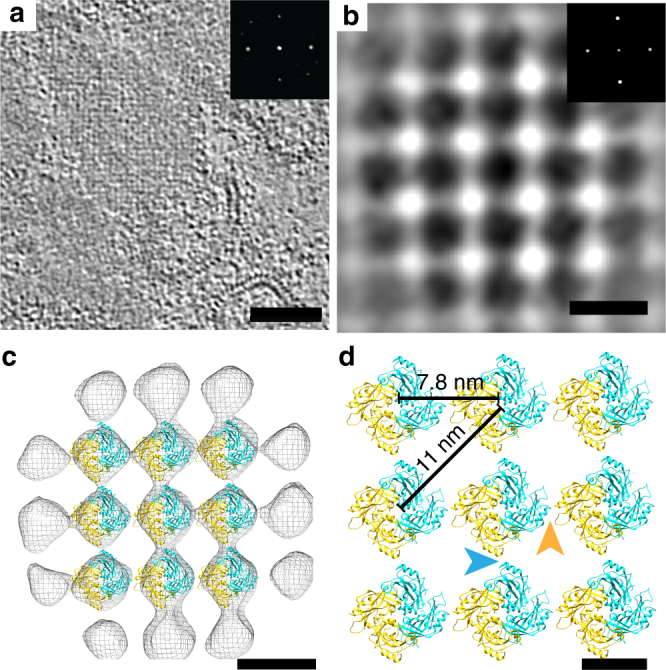
Fig. 2
MeV M protein forms a 2D paracrystalline array. a Tomographic slice showing a representative M array from Edm MeV-infected HeLa cells. Inset is the power spectrum indicating a four-fold symmetric stru...
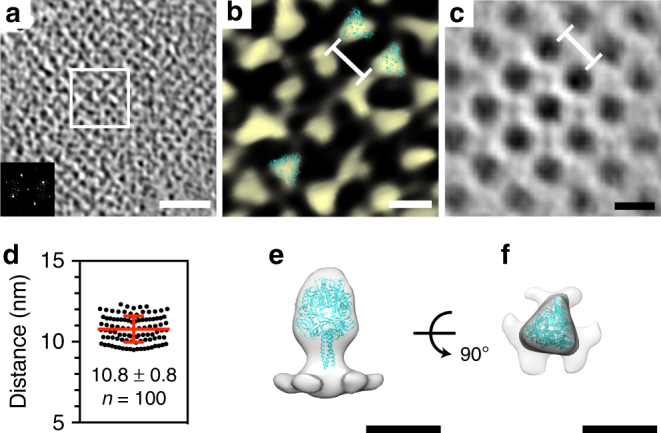
Fig. 3
MeV F glycoprotein forms a 2D paracrystalline lattice with four-fold symmetry. a Tomographic slice showing the F glycoprotein layer from recMeV-(H-118u220741u00d7)-infected HeLa cells at an assembly s...
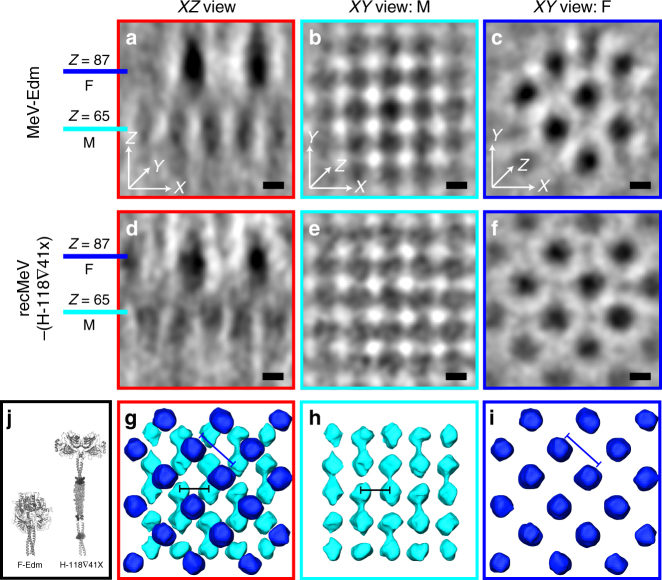
Fig. 4
Sub-volume average of the MeV Fu2013M lattice layers. a - f Tomographic slices of the ordered Fu2013M lattice. Pixel size is 5.88u2009u00c5 at binning 2. Central slices at Z =u200965 (black, M) and Z ...
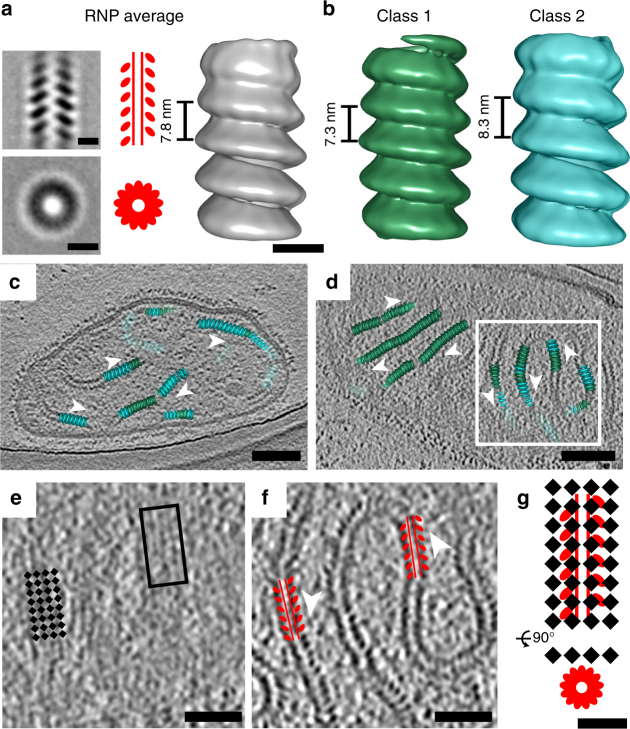
Fig. 5
MeV RNP average and its spatial organization with M lattice. a Global average of MeV RNP with central slice side and top views (left), cartoon representation (middle), and isosurface rendering (right)...
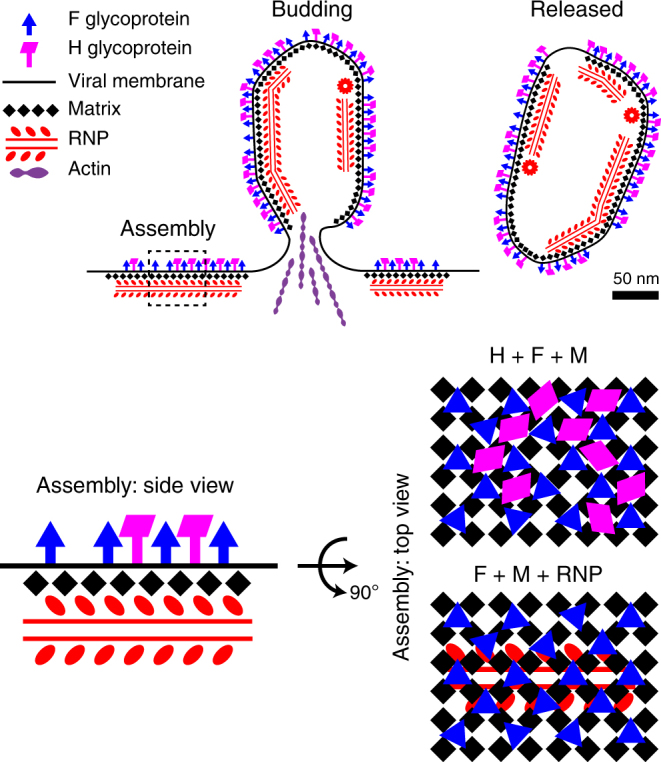
Fig. 6
MeV assembly model. At the assembly site, viral components, including glycoproteins F and H, matrix protein (M), and RNP complexes, accumulate at the plasma membrane to initiate the assembly process. ...
Figure images are served from the NIH/NLM PubMed Central Open Access Subset or Europe PMC; copyright remains with the publishers and authors.
💬 Discussion
0 commentsNo comments yet. Be the first to start a discussion!
Leave a Comment