Abstract
Load-bearing soft tissues predominantly consist of collagen and exhibit anisotropic, non-linear visco-elastic behavior, coupled to the organization of the collagen fibers. Mimicking native mechanical behavior forms a major goal in cardiovascular tissue engineering. Engineered tissues often lack properly organized collagen and consequently do not meet in vivo mechanical demands. To improve collagen architecture and mechanical properties, mechanical stimulation of the tissue during in vitro tissue growth is crucial. This study describes the evolution of collagen fiber orientation with culture time in engineered tissue constructs in response to mechanical loading. To achieve this, a novel technique for the quantification of collagen fiber orientation is used, based on 3D vital imaging using multiphoton microscopy combined with image analysis. The engineered tissue constructs consisted of cell-seeded biodegradable rectangular scaffolds, which were either constrained or intermittently strained in longitudinal direction. Collagen fiber orientation analyses revealed that mechanical loading induced collagen alignment. The alignment shifted from oblique at the surface of the construct towards parallel to the straining direction in deeper tissue layers. Most importantly, intermittent straining improved and accelerated the alignment of the collagen fibers, as compared to constraining the constructs. Both the method and the results are relevant to create and monitor load-bearing tissues with an organized anisotropic collagen network.
🔬 Techniques
🔭 Microscopes
🧪 Sample Preparation
🏭 Microscope Brands
🧪 Reagent Suppliers
🔴 Lasers
📷 Detectors
🏛️ Research Organizations (ROR)
Affiliated research institutions:
📋 Methods
Tissue Culture and Mechanical Conditioning
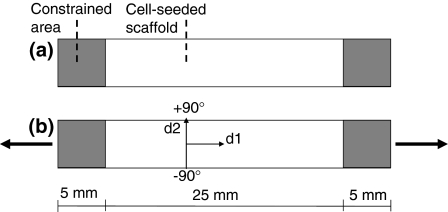
The methods of scaffold preparation, cell culture, seeding, and mechanical conditioning have been described previously. 35 In brief, human saphenous vein myofibroblasts (p7) were seeded using fibrin as a cell carrier onto rectangular strips (35 × 5 × 1 mm) of non-woven polyglycolic acid scaffolds, coated with a thin layer of poly-4-hydroxybutyrate. 20 In the longitudinal direction, the scaffolds were attached to the flexible membranes of 6-well plates (Flexcell Int., Hillsborough, NC) at the outer 5 mm. After 1 week of culture under these constrained conditions, the engineered tissues were split into two groups (Fig. 1 ). One group ( n = 6) served as constrained control, whereas the other group ( n = 6) was subjected to intermittent uniaxial dynamic straining (4%, 3 h on/off, 1 Hz) using a modified version of a Flexercell FX-4000T straining device 5 (Flexcell Int., Hillsborough, NC). After 2, 3, and 4 weeks of culture the collagen fiber orientation was visualized. Figure 1 Top view of rectangular engineered constructs. The strips were longitudinally constrained at the outer 5 mm at both ends using silicone glue. Samples were either constrained (a) or intermittently loaded (b) in longitudinal direction (d1). Direction d2 represents the direction perpendicular to the long axis. Positive (+90°) and negative (−90°) directions of d2 are indicated Visualization of Collagen Orientation To visualize the collagen fiber orientation, samples were labeled by 15 μ M Cell Tracker Blue CMAC (CTB; Invitrogen, The Netherlands) and 3 μ M CNA35-OG488 as specific vital fluorescent markers for cell cytoplasm and collagen, 26 respectively. CTB and CNA35-OG488 are excitable with multiphoton microscopy and exhibit broad spectra at 466 nm and 520 nm, respectively. An inverted Zeiss Axiovert 200 microscope (Carl Zeiss, Germany) coupled to an LSM 510 Meta (Carl Zeiss, Germany) laser scanning microscope was used to visualize cell and collagen organization. A chameleon ultra 140 fs pulsed Ti-Sapphire laser (Coherent, Santa Clara, CA) was tuned to 760 nm and two photomultiplier tube (PMT) detectors were defined as 435–485 nm for CTB and 500–530 nm for CNA-OG488. Two samples per group were scanned at three different locations: (1) the center point of the tissue, (2) 5 mm left to the center point, and (3) 5 mm right to the center point. At each location a stack of image slices was obtained. The thickness of one image slice was 1 μ m and the maximum thickness of the stack was 100 μ m. Separate images were obtained from each PMT and combined into single images.
Show full methods section
Tissue Culture and Mechanical Conditioning
The methods of scaffold preparation, cell culture, seeding, and mechanical conditioning have been described previously. 35 In brief, human saphenous vein myofibroblasts (p7) were seeded using fibrin as a cell carrier onto rectangular strips (35 × 5 × 1 mm) of non-woven polyglycolic acid scaffolds, coated with a thin layer of poly-4-hydroxybutyrate. 20 In the longitudinal direction, the scaffolds were attached to the flexible membranes of 6-well plates (Flexcell Int., Hillsborough, NC) at the outer 5 mm. After 1 week of culture under these constrained conditions, the engineered tissues were split into two groups (Fig. 1 ). One group ( n = 6) served as constrained control, whereas the other group ( n = 6) was subjected to intermittent uniaxial dynamic straining (4%, 3 h on/off, 1 Hz) using a modified version of a Flexercell FX-4000T straining device 5 (Flexcell Int., Hillsborough, NC). After 2, 3, and 4 weeks of culture the collagen fiber orientation was visualized. Figure 1 Top view of rectangular engineered constructs. The strips were longitudinally constrained at the outer 5 mm at both ends using silicone glue. Samples were either constrained (a) or intermittently loaded (b) in longitudinal direction (d1). Direction d2 represents the direction perpendicular to the long axis. Positive (+90°) and negative (−90°) directions of d2 are indicated Visualization of Collagen Orientation To visualize the collagen fiber orientation, samples were labeled by 15 μ M Cell Tracker Blue CMAC (CTB; Invitrogen, The Netherlands) and 3 μ M CNA35-OG488 as specific vital fluorescent markers for cell cytoplasm and collagen, 26 respectively. CTB and CNA35-OG488 are excitable with multiphoton microscopy and exhibit broad spectra at 466 nm and 520 nm, respectively. An inverted Zeiss Axiovert 200 microscope (Carl Zeiss, Germany) coupled to an LSM 510 Meta (Carl Zeiss, Germany) laser scanning microscope was used to visualize cell and collagen organization. A chameleon ultra 140 fs pulsed Ti-Sapphire laser (Coherent, Santa Clara, CA) was tuned to 760 nm and two photomultiplier tube (PMT) detectors were defined as 435–485 nm for CTB and 500–530 nm for CNA-OG488. Two samples per group were scanned at three different locations: (1) the center point of the tissue, (2) 5 mm left to the center point, and (3) 5 mm right to the center point. At each location a stack of image slices was obtained. The thickness of one image slice was 1 μ m and the maximum thickness of the stack was 100 μ m. Separate images were obtained from each PMT and combined into single images.
Quantification of Collagen Orientation
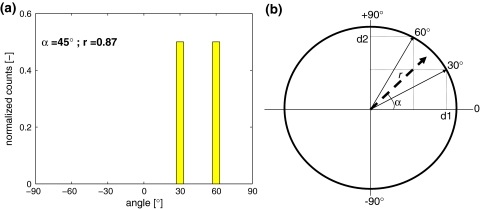
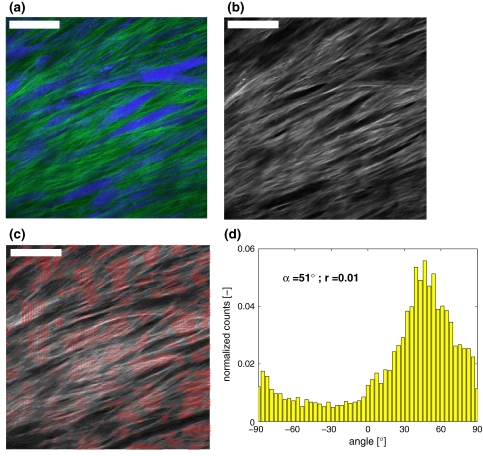
The collagen fiber orientations were determined by analyzing the individual images of each image stack as described by Daniels et al . 11 In brief, coherence-enhancing diffusion (CED) was applied for denoising to improve the quality of structures in the image without destroying the boundaries of the fibers. 44 Using CED, smoothing occurs along, but not perpendicular, to the preferred orientation of the structures in the image. Subsequently, the local orientations of all collagen fibers were determined by calculating the principal curvature directions from the eigenvalues and the eigenvectors of the Hessian matrix (second order structure). 40 As fibers appear at different widths, the second order derivatives were determined at a scale adaptive to the local width of the fiber. The optimal scale was determined with a contextual confidence measure. 31 At each location a stack of (in-plane) orientation histograms was obtained, representing the statistical distribution of local orientations in each image. To calculate the mean fiber angle and the dispersity of the distributions, circular statistics were required due to the periodicity of the fiber distributions. 23 , 41 , 48 Circular statistics handle periodic data by representing each angle as a unit vector oriented at that angle. To calculate the mean angle, the individual unit vectors are decomposed into vector components on which statistical operations, such as averaging, are permitted (Fig. 2 ). Histograms of collagen orientations were obtained from each multiphoton image, and of each the mean vector was calculated, representing a mean angle α and a mean vector length r. The mean vector length represents a measure for the dispersity of the fiber orientations. A vector length of 1 indicates no variation in fiber orientations (i.e., all fibers perfectly aligned) while a vector length of 0 indicates a random distribution of fiber orientations. Courses of mean angles and vector lengths as a function of tissue depth were obtained per image location. To generalize the results, the vector components at each depth were averaged over all samples per loading condition per time point. Subsequently, averaged courses of mean angles and vector lengths were obtained. It should be noted that when the dispersity of the collagen orientation distribution is large, the distribution becomes essentially random. This diminishes the meaning of the value of the mean angle. Hence, for clarity, orientation angels were not shown when mean vector lengths were consistently lower than 0.2. Figure 2 Example of circular statistics. A circular distribution is represented in a histogram (a) and depicted as unit vectors with corresponding angles of 30 and 60 degrees in a unit circle (b). The mean vector (dashed line) is calculated by averaging the decomposed sine and cosine vector components of the individual vectors. α represents the mean angle and r the length of the mean vector. A vector length of 1 indicates no variation in fiber orientations, while a vector length of 0 indicates a random orientation of fiber orientations Statistics Statistics were performed to determine the effect of mechanical loading on the alignment of the collagen fibers, as described previously. 41 In short, alignment in the longitudinal (d1) direction was tested for significance at each imaging depth in each set of samples per time point and loading condition by performing one-sample t -tests against a reference value of 0 on the cosine components of the mean vectors. A p -value lower than 0.05 was considered statistically significant.
📊 Figures
Figureu00a01
Top view of rectangular engineered constructs. The strips were longitudinally constrained at the outer 5u00a0mm at both ends using silicone glue. Samples were either constrained (a) or intermittently ...
Figureu00a02
Example of circular statistics. A circular distribution is represented in a histogram (a) and depicted as unit vectors with corresponding angles of 30 and 60 degrees in a unit circle (b). The mean vec...
Figureu00a03
Different steps of the orientation analysis. On the multiphoton image (a) coherence enhanced diffusion is applied (b). Using the Hessian matrix the principal curvature directions are calculated (c) wh...
Figureu00a04
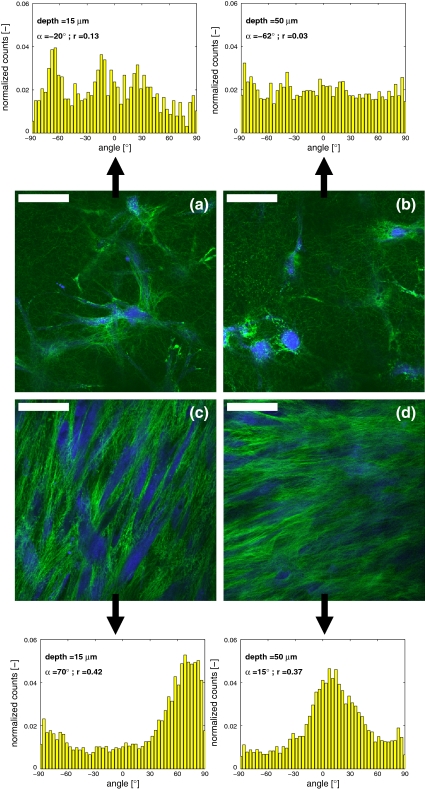
Representative multiphoton images of cells ( blue ) and collagen ( green ) organization in constrained (a, b) and intermittently strained (c, d) samples after 2u00a0weeks at 15 (a, c) and 50 u03bc m (...
Figureu00a05
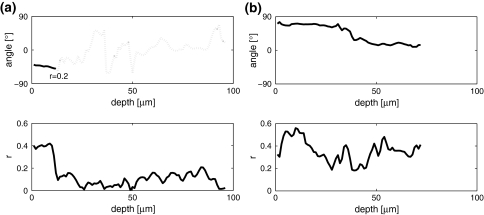
Courses of the orientation angle and vector length as a function of the imaging depth for constrained (a) and intermittently strained (b) samples after 2u00a0weeks of culture. These figures correspond...
Figureu00a06
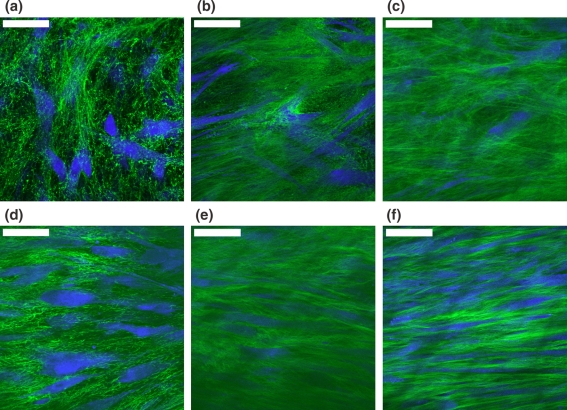
Representative multiphoton images of cells ( blue ) and collagen fibers ( green ) in constrained (au2013c) and intermittently strained (du2013f) samples at a imaging depth of 50 u03bc m after 2 (a, d)...
Figureu00a07
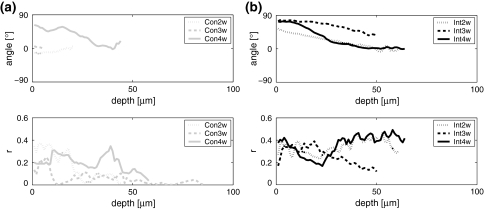
Orientation angle (u03b1) and vector lengths ( r ) as a function of the penetration depth into the tissue for constrained (a) and intermittently loaded (b) samples after 2, 3, and 4u00a0weeks (w) of c...
Figure images are served from the NIH/NLM PubMed Central Open Access Subset or Europe PMC; copyright remains with the publishers and authors.
💬 Discussion
0 commentsNo comments yet. Be the first to start a discussion!
Leave a Comment