Abstract
Genetic and biochemical defects of mitochondrial function are a major cause of human disease, but their link to mitochondrial morphology in situ has not been defined. Here, we develop a quantitative three-dimensional approach to map mitochondrial network organization in human muscle at electron microscopy resolution. We establish morphological differences between human and mouse and among patients with mitochondrial DNA (mtDNA) diseases compared to healthy controls. We also define the ultrastructure and prevalence of mitochondrial nanotunnels, which exist as either free-ended or connecting membrane protrusions across non-adjacent mitochondria. A multivariate model integrating mitochondrial volume, morphological complexity, and branching anisotropy computed across individual mitochondria and mitochondrial populations identifies increased proportion of simple mitochondria and nanotunnels as a discriminant signature of mitochondrial stress. Overall, these data define the nature of the mitochondrial network in human muscle, quantify human-mouse differences, and suggest potential morphological markers of mitochondrial dysfunction in human tissues.
🔬 Techniques
💻 Software
✨ Fluorophores
🧪 Sample Preparation
🏭 Microscope Brands
🧪 Reagent Suppliers
📷 Detectors
💻 Software Details
💻 Code & Software
💾 Data Repositories
🏛️ Research Organizations (ROR)
Affiliated research institutions:
📋 Methods
CONTACT FOR REAGENT AND RESOURCE SHARING
Further information and requests for resources and reagents should be directed to and will be fulfilled by the Lead Contact, Martin Picard ( martin.picard@columbia.edu ).
EXPERIMENTAL MODELS AND SUBJECT DETAILS Human subjects and patients
This study was approved by the Newcastle and North Tyneside Local Research Ethics Committees (reference 2002/205) and prior informed consent was obtained from each participant. All experiments were carried out in accordance with the approved guidelines. Biopsies were obtained from six patients with genetically-confirmed mtDNA disease; two patients with single, large mtDNA deletions, three patients with the m.8344A>G mutation and one with the m.3243A>G mutation ( Table S1 ). In all cases, muscle biopsies were obtained from the tibialis anterior muscle. A further eight control biopsies from the distal part of the hamstring were collected from adults undergoing anterior cruciate ligament surgery ( Table S2 ). For both patients and controls a section of the biopsy specimen was processed for EM, including gentle teasing of small muscle fiber bundles to insure rapid fixation.
Mouse muscle samples
All animal experiments were conducted in compliance with the UK Home Office (PPL 60/4455) and the Newcastle University Animal Welfare Ethical Review Board. Six male PV-Cre Knockin mice on c57bl/6N background (Jackson lab 008069) aged 5 (n = 2) and 7 (n = 4) months were used for experiments. Pairs of age-matched mice were processed in parallel, one underwent transcardial perfusion and one had a lethal injection of 200 μl of euthatal at 20 mg/mL containing sodium pentobarbital. The transcardially perfused mice were perfused with 50 mL of EM fixative (2% glutaraldehyde in 0.1M cacodylate buffer), during fixation the hind limb was attached to a spatula at a right angle preventing unwanted muscle contraction. All mice were dissected and the right tibialis anterior muscle carefully removed. The muscle was dissected further to remove a small region, the muscle fiber bundles teased apart and immersed into fixative.
Show full methods section
CONTACT FOR REAGENT AND RESOURCE SHARING
Further information and requests for resources and reagents should be directed to and will be fulfilled by the Lead Contact, Martin Picard ( martin.picard@columbia.edu ).
EXPERIMENTAL MODELS AND SUBJECT DETAILS Human subjects and patients
This study was approved by the Newcastle and North Tyneside Local Research Ethics Committees (reference 2002/205) and prior informed consent was obtained from each participant. All experiments were carried out in accordance with the approved guidelines. Biopsies were obtained from six patients with genetically-confirmed mtDNA disease; two patients with single, large mtDNA deletions, three patients with the m.8344A>G mutation and one with the m.3243A>G mutation ( Table S1 ). In all cases, muscle biopsies were obtained from the tibialis anterior muscle. A further eight control biopsies from the distal part of the hamstring were collected from adults undergoing anterior cruciate ligament surgery ( Table S2 ). For both patients and controls a section of the biopsy specimen was processed for EM, including gentle teasing of small muscle fiber bundles to insure rapid fixation.
Mouse muscle samples
All animal experiments were conducted in compliance with the UK Home Office (PPL 60/4455) and the Newcastle University Animal Welfare Ethical Review Board. Six male PV-Cre Knockin mice on c57bl/6N background (Jackson lab 008069) aged 5 (n = 2) and 7 (n = 4) months were used for experiments. Pairs of age-matched mice were processed in parallel, one underwent transcardial perfusion and one had a lethal injection of 200 μl of euthatal at 20 mg/mL containing sodium pentobarbital. The transcardially perfused mice were perfused with 50 mL of EM fixative (2% glutaraldehyde in 0.1M cacodylate buffer), during fixation the hind limb was attached to a spatula at a right angle preventing unwanted muscle contraction. All mice were dissected and the right tibialis anterior muscle carefully removed. The muscle was dissected further to remove a small region, the muscle fiber bundles teased apart and immersed into fixative.
METHOD DETAILS Transmission electron microscopy
For all samples, muscle fiber bundles fixed overnight in 2% glutaradehyde (in cacodylate buffer (0.1M, pH7.4)) at 4°C. Fibers were post fixed in 1% osmium tetroxide for 1 hour. Samples were dehydrated in a graded series of acetone (25%, 30 min; 50%, 30 min; 75%, 30 min; 2×100%, 1 hour each) before being impregnated with increasing concentrations of epoxy resin (TAAB medium grade; 25%, 50%, 75% in acetone, 3×100%, all for 1 hour each). They were then embedded in fresh resin and polymerized at 60°C for 24-36 hours. Sections were cut on an ultramicrotome, first semi-thin sections (0.5um) were stained with toluidine blue for LM to identify the area of interest/confirm orientation of tissue. Ultrathin sections (70nm) were then cut and picked up onto copper grids. Sections were stained with 1% uranyl acetate (30 min) and 3% lead citrate (7 min) on a Leica EM AC20 automatic staining machine before being viewed on the TEM (Philips CM100). Images were captured using a CCD camera (AMT40, Deben UK). Scanning for regions of interest ×5800 and initial images were captured at ×7900, more detailed images were captured at ×13500. Muscle fibers selected for analysis exhibited no more than two Z-lines separated by a minimum of 10-15 μm, ensuring optimal transverse orientation.
Serial block face scanning electron microscopy
Tissue was fixed in 2% glutaraldehyde in 0.1M cacodylate buffer. It was then processed using a heavy metal protocol adapted from ( Wilke et al., 2013 ). Tissue was immersed in 3% potassium ferrocyanide + 2% osmium tetroxide (1 hour at 4°C), followed by filtered 0.1% thiocarbohydrazide (20 min), then 2% osmium tetroxide (30 min) and finally left overnight in 1% uranyl acetate at 4°C (with several water washes between each step). The next day the samples were immersed in 0.6% lead aspartate solution (30 min at 60°C and then dehydrated in graded acetone (as for TEM), impregnated with epoxy Taab 812 hard resin, embedded in fresh resin and polymerized at 60°C for 36-48 hours. After polymerization the block was sectioned for TEM to identify the area of interest then trimmed to approximately 0.75 mm by 0.5 mm and glued onto an aluminum pin. In order to reduce sample charging within the SEM, the block was painted with silver glue and sputter-coated with a 5 nm layer of gold. The pin was placed into a Zeiss Sigma SEM incorporating the Gatan 3view system for serial block face (SBF)-SEM, which allows sectioning of the block and the collection of serial images in the z-direction. Using Digital Micrograph software, multiple regions of interest were selected and imaged at ×8235 magnification, 1024×1024 pixel scan, which gave a pixel resolution of approximately 10nm. Section thickness was 30nm in the z-direction and at least 400 sections were collected, yielding a total imaging depth of 12um. Before SBF-SEM, fibers with a high mitochondrial content were selected via TEM and a z stack then captured. For each human and mouse sample, four cells were imaged including threw for the IMF compartment, and one for the SS/perinuclear compartment. 3D reconstructions Image stacks from the SBF-SEM were converted to MRC files and 25 to 50 mitochondria reconstructed for each fiber using 3D-MOD (IMOD image analysis software, (IMOD 4.7, Boulder Laboratory for 3-D Electron Microscopy of Cells). Starting from the center of the stack to avoid mitochondria that would be interrupted at the edges of the images volume, randomly selected mitochondria were manually traced using the ‘sculpt’ drawing tool on each section. The OMM of each mitochondrion was followed in all three dimensions. Mitochondria with immediately adjacent OMM were segmented separately, and membrane continuity was established based on continuous planar electron density. A mesh and cap was then applied to fully segmented organelles using flat criteria value of 1.5 and all other parameters set as default, which enabled generation of closed volumes for surfaces lying between two 30nm slices in the Z plane. For each completely reconstructed mitochondrion, the total mesh surface area and total contour volume were extracted and used in analyses. SS mitochondria included in quantitative analyses were situated between myofibrils and the sarcolemma, often but not always in proximity to a nucleus, and did not protrude into the IMF space. To quantitatively distinguish between the two populations, SS mitochondria with IMF protrusions, as shown in Video S2 , were not included in the analyses.
QUANTIFICATION AND STATISTICAL ANALYSIS Quantifying mitochondrial complexity Mitochondrial complexity index
(MCI) was calculated using the formula: (1) MCI = ( SA ∕ 2 3 ) 4 π V where SA is surface area and V is volume This equation was derived from form factor ( Koopman et al., 2005 ) and is a three-dimensional equivalent, used to assess mitochondrial morphological complexity. The fractional power is necessary to make the overall expression dimensionless (area dimensions of L 2 has dimensions of L 3 ), and thus independent of overall size of the object. We tested this formula and confirmed that MCI is a measure of mitochondrial complexity invariant to volume ( Figure S2 ). However, the scaling of MCI did not accurately represent the perceived increase in complexity. Changing the overall power of the complete expression has the effect of expanding the dynamic range of the measure without changing its dimensionality, and we investigated the effect of squaring and cubing the total formula. It was observed that squaring the measure gave the most accurate representation of mitochondrial complexity. As such the final formula employed was (2) MCI = ( ( SA ∕ 2 3 ) 4 π V ) 2 = SA 3 16 π 2 V 2 Equations (1) and (2) contain the same information, but Equation (2) has a more natural mapping to perceived morphological difference. MCI was compared to sphericity, another measure of three-dimensional shape that varies between 0 and 1, which asymptotically approaches 1 for a perfect sphere. MCI was selected over sphericity due to the theoretically unlimited complexity of mitochondrial morphology, which can scale up without an upper boundary as morphological complexity increases from sequential fusion events or increasing numbers of nanotunnels. Quantifying mitochondrial branching To assess mitochondrial branching and anisotropy, branching was quantified in the context of the surrounding tissue in the transverse and longitudinal planes and a ratio calculated. For transverse branching index the number of myofibrils bridged was counted and 1 added. The number of myofibrils bridged was calculated by adding together all branches that added to the distance covered in the transverse plane. If a branch curved or if the number of myofibrils was greater on one side than the other, the greatest value was taken ( Figure S3A ). For longitudinal branching the number of sarcomeres (+2), half sarcomeres (+1) and z-bands (+1) was summed and 1 added. Again only branches that added to the overall longitudinal distance were included ( Figure S3B ). The transverse branching score was divided by the longitudinal branching score, to yield a mitochondrial branching index (MBI). Mitochondrial were classified into 3 groups based on MBI; > 1 more branched in transverse orientation, 1 equally branched in both orientations and < 1 more branched longitudinally. Branching quantification was validated by comparison of assessments by two investigators, which yielded similar proportions of mitochondria established to be either more or equally branched in transverse and longitudinal orientations ( Figure S3C-E ). The inter-rater agreement in absolute MBI values was moderate ( Figure S3C-E ).
Nanotunnel measurements
For the purpose of mitochondrial nanotunnel measurements, previously identified mitochondria with nanotunnels were manually reconstructed in Microscopy Image Browser ( Belevich et al., 2016 ) and exported as Amira mesh files for measurements analysis ( Cocks et al., 2018 ). The total number of nanotunnels for which measurements were taken was 362, some nanotunnels were excluded from this analysis based morphology which was difficult to measure in Amira. The .mrc image stacks and Amira mesh models were opened in Amira to derive precise measurements of nanotunnel length, as well as minimum and maximum diameter along the length each nanotunnel.
Multivariate analysis and machine learning
We calculated summary statistics to describe the observed distributions of mitochondrial volume, complexity (MCI), and number of nanotunnels in cells from muscle biopsies of human patients, human controls and wild-type mice. Summary statistics included the percentage of mitochondria whose volume and MCI were in the 10 th percentile (bottom 10% of the distribution) or in the 90 th percentile (top 10%) of the combined control population (percent large, complex, percent small, and simple, respectively) as well as the number of nanotunnels per 100 mitochondria and mitochondrial volume density.
Partial least-squares discriminant analysis
(PLS-DA) was performed using the mixOmics (6.3.1) ( Lê Cao et al., 2009 ; Rohart et al., 2017 ) R (3.4.3) ( Team, 2017 ) package (code available: https://gist.github.com/CnrLwlss/e4b0b2a2c4290ae4ad4eb9a4373680f3 ).
Variable importance in projection
(VIP) scores were extracted for each mitochondrial feature from PLS-DA models.
Statistical analyses
Data on volume and MCI were fit using a linear mixed model with organism and cell (nested within organism) as random effects and species/disease status as fixed effects. Because of the extent of the skewness of the data, measurements were log-transformed before analysis. For all other statistics, normalization was not effective and therefore non-parametric Mann-Whitney tests were used. For branching analyses a chi square test was used to determine the significance for the percentages of mitochondria classified in each group.
DATA AND SOFTWARE AVAILABILITY
Image stacks and model files are available from the authors upon request.
EXPERIMENTAL MODELS AND SUBJECT DETAILS Human subjects and patients
This study was approved by the Newcastle and North Tyneside Local Research Ethics Committees (reference 2002/205) and prior informed consent was obtained from each participant. All experiments were carried out in accordance with the approved guidelines. Biopsies were obtained from six patients with genetically-confirmed mtDNA disease; two patients with single, large mtDNA deletions, three patients with the m.8344A>G mutation and one with the m.3243A>G mutation ( Table S1 ). In all cases, muscle biopsies were obtained from the tibialis anterior muscle. A further eight control biopsies from the distal part of the hamstring were collected from adults undergoing anterior cruciate ligament surgery ( Table S2 ). For both patients and controls a section of the biopsy specimen was processed for EM, including gentle teasing of small muscle fiber bundles to insure rapid fixation.
Mouse muscle samples
All animal experiments were conducted in compliance with the UK Home Office (PPL 60/4455) and the Newcastle University Animal Welfare Ethical Review Board. Six male PV-Cre Knockin mice on c57bl/6N background (Jackson lab 008069) aged 5 (n = 2) and 7 (n = 4) months were used for experiments. Pairs of age-matched mice were processed in parallel, one underwent transcardial perfusion and one had a lethal injection of 200 μl of euthatal at 20 mg/mL containing sodium pentobarbital. The transcardially perfused mice were perfused with 50 mL of EM fixative (2% glutaraldehyde in 0.1M cacodylate buffer), during fixation the hind limb was attached to a spatula at a right angle preventing unwanted muscle contraction. All mice were dissected and the right tibialis anterior muscle carefully removed. The muscle was dissected further to remove a small region, the muscle fiber bundles teased apart and immersed into fixative.
METHOD DETAILS Transmission electron microscopy
For all samples, muscle fiber bundles fixed overnight in 2% glutaradehyde (in cacodylate buffer (0.1M, pH7.4)) at 4°C. Fibers were post fixed in 1% osmium tetroxide for 1 hour. Samples were dehydrated in a graded series of acetone (25%, 30 min; 50%, 30 min; 75%, 30 min; 2×100%, 1 hour each) before being impregnated with increasing concentrations of epoxy resin (TAAB medium grade; 25%, 50%, 75% in acetone, 3×100%, all for 1 hour each). They were then embedded in fresh resin and polymerized at 60°C for 24-36 hours. Sections were cut on an ultramicrotome, first semi-thin sections (0.5um) were stained with toluidine blue for LM to identify the area of interest/confirm orientation of tissue. Ultrathin sections (70nm) were then cut and picked up onto copper grids. Sections were stained with 1% uranyl acetate (30 min) and 3% lead citrate (7 min) on a Leica EM AC20 automatic staining machine before being viewed on the TEM (Philips CM100). Images were captured using a CCD camera (AMT40, Deben UK). Scanning for regions of interest ×5800 and initial images were captured at ×7900, more detailed images were captured at ×13500. Muscle fibers selected for analysis exhibited no more than two Z-lines separated by a minimum of 10-15 μm, ensuring optimal transverse orientation.
Serial block face scanning electron microscopy
Tissue was fixed in 2% glutaraldehyde in 0.1M cacodylate buffer. It was then processed using a heavy metal protocol adapted from ( Wilke et al., 2013 ). Tissue was immersed in 3% potassium ferrocyanide + 2% osmium tetroxide (1 hour at 4°C), followed by filtered 0.1% thiocarbohydrazide (20 min), then 2% osmium tetroxide (30 min) and finally left overnight in 1% uranyl acetate at 4°C (with several water washes between each step). The next day the samples were immersed in 0.6% lead aspartate solution (30 min at 60°C and then dehydrated in graded acetone (as for TEM), impregnated with epoxy Taab 812 hard resin, embedded in fresh resin and polymerized at 60°C for 36-48 hours. After polymerization the block was sectioned for TEM to identify the area of interest then trimmed to approximately 0.75 mm by 0.5 mm and glued onto an aluminum pin. In order to reduce sample charging within the SEM, the block was painted with silver glue and sputter-coated with a 5 nm layer of gold. The pin was placed into a Zeiss Sigma SEM incorporating the Gatan 3view system for serial block face (SBF)-SEM, which allows sectioning of the block and the collection of serial images in the z-direction. Using Digital Micrograph software, multiple regions of interest were selected and imaged at ×8235 magnification, 1024×1024 pixel scan, which gave a pixel resolution of approximately 10nm. Section thickness was 30nm in the z-direction and at least 400 sections were collected, yielding a total imaging depth of 12um. Before SBF-SEM, fibers with a high mitochondrial content were selected via TEM and a z stack then captured. For each human and mouse sample, four cells were imaged including threw for the IMF compartment, and one for the SS/perinuclear compartment. 3D reconstructions Image stacks from the SBF-SEM were converted to MRC files and 25 to 50 mitochondria reconstructed for each fiber using 3D-MOD (IMOD image analysis software, (IMOD 4.7, Boulder Laboratory for 3-D Electron Microscopy of Cells). Starting from the center of the stack to avoid mitochondria that would be interrupted at the edges of the images volume, randomly selected mitochondria were manually traced using the ‘sculpt’ drawing tool on each section. The OMM of each mitochondrion was followed in all three dimensions. Mitochondria with immediately adjacent OMM were segmented separately, and membrane continuity was established based on continuous planar electron density. A mesh and cap was then applied to fully segmented organelles using flat criteria value of 1.5 and all other parameters set as default, which enabled generation of closed volumes for surfaces lying between two 30nm slices in the Z plane. For each completely reconstructed mitochondrion, the total mesh surface area and total contour volume were extracted and used in analyses. SS mitochondria included in quantitative analyses were situated between myofibrils and the sarcolemma, often but not always in proximity to a nucleus, and did not protrude into the IMF space. To quantitatively distinguish between the two populations, SS mitochondria with IMF protrusions, as shown in Video S2 , were not included in the analyses.
Supplementary Material 1 2 3 4 5 6 7 8
📊 Figures
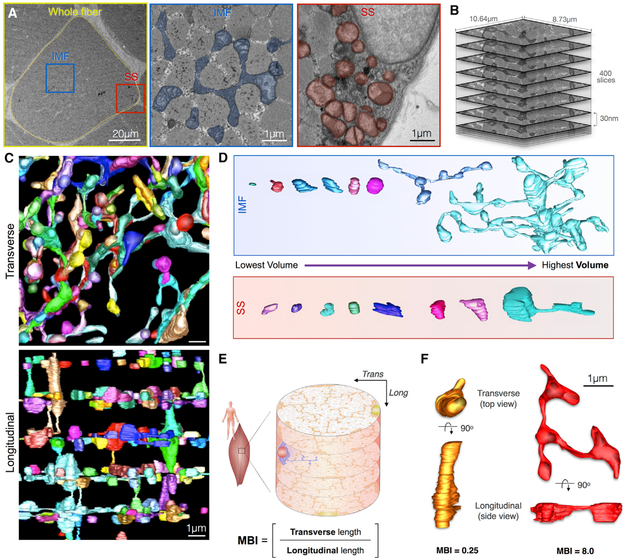
Figure 1.
Imaging and Quantitative Analysis of Mitochondrial Morphology and Volume in IMF and SS Mitochondrial Subpopulations in Human Skeletal Muscle
(A) Electron micrograph of human skeletal muscle in transverse (i.e.,ncross section) orientation. A single cell is highlighted (yellow), withncorresponding higher magnification images of intermyofibri...
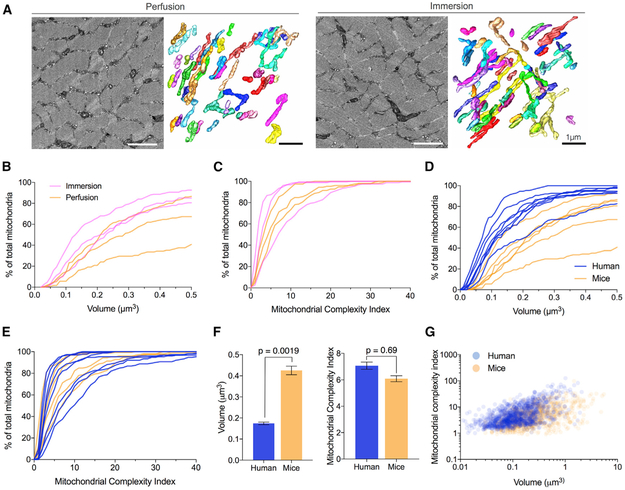
Figure 2.
Mitochondrial Morphology Differs between Healthy Humans and Mice
(A) Electron micrograph and 3D reconstruction of mitochondria in mousentibialis anterior muscle. Muscle was fixed in two ways: by immersion after andelay at room temperature (left) and via transcradia...
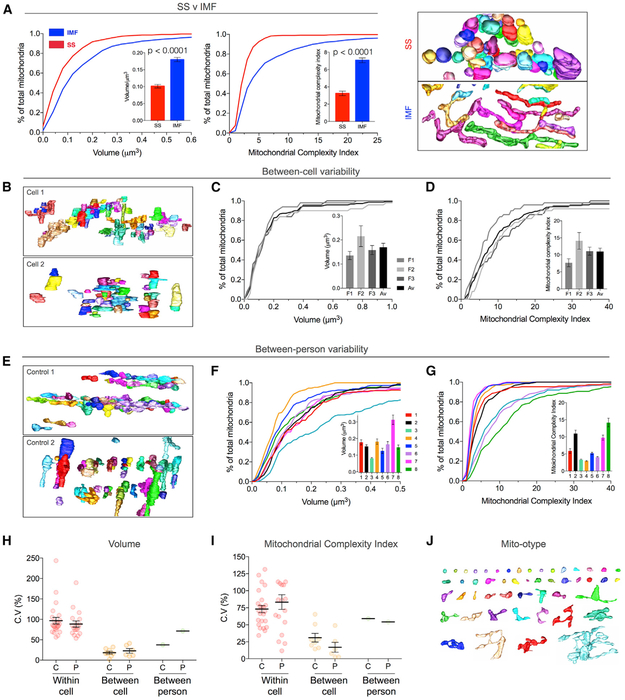
Figure 3.
Natural Variation in Mitochondrial Volume and Complexity in Healthy Human Skeletal Muscle
(A) Population distribution of mitochondrial volume and MCI in controlnhuman muscle shown as cumulative frequency distributions for SS and IMFnmitochondria. Insets: mean values u00b1 SEM; n = 346 for ...
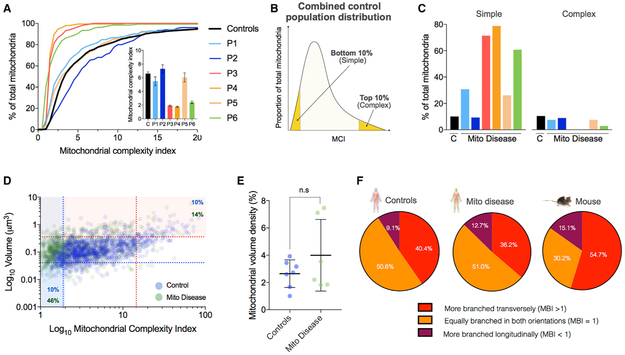
Figure 4.
IMF Mitochondrial Volume and MCI in Patients with mtDNA Disease
(A) Cumulative frequency distribution for MCI in combined healthyncontrols and patients. Each line in the patients represents 150 IMF mitochondrianacross 3 muscle fibers. Inset shows mean u00b1 SEM fo...
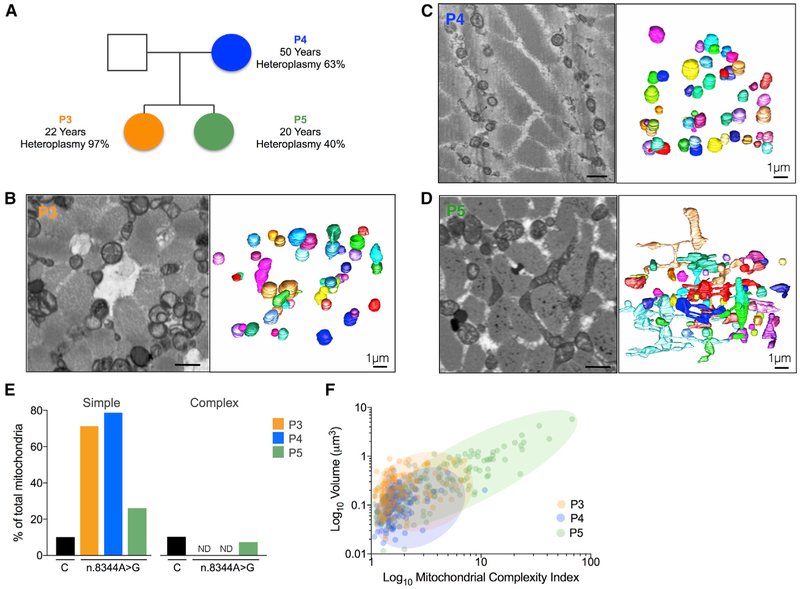
Figure 5.
Variability in Mitochondrial Morphology in Three Family Members with Variable Levels of the m.8344A>G Mutation
(A) Pedigree of three related female patients. Patient 3 (orange): thenproband with 97% heteroplasmy, 97% COX-deficient muscle fibers, and severenmyopathy and exercise intolerance; patient 4 (blue): t...
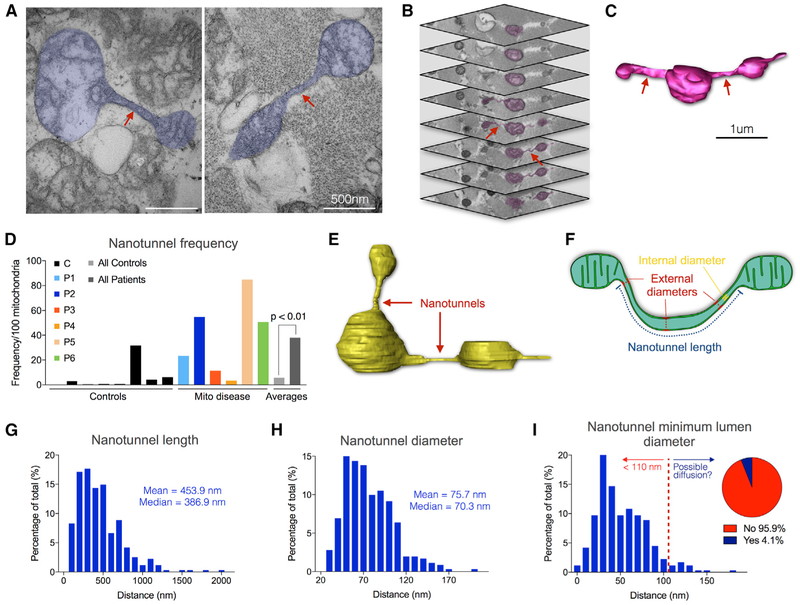
Figure 6.
Prevalence and Anatomy of Mitochondrial Nanotunnels in Human Skeletal Muscle
(A) Transmission Electron Microscopy of skeletal muscle from patient 5,nwith mitochondria harboring nanotunnels (pseudocolored blue). Arrows indicatennanotunnel shafts. (B and C) Image stack from SBF-...
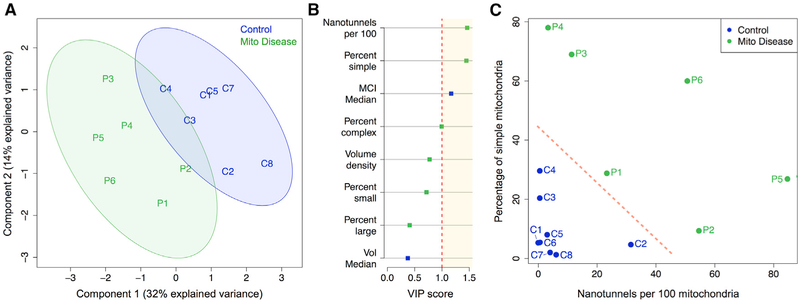
Figure 7.
Multivariate Analysis Mitochondrial Morphological Signatures among mtDNA Disease and Healthy Controls
(A) Partial least-squares discriminant analysis (PLS-DA) on mtDNAndisease patients (n = 6) and healthy controls (n = 8) with 95% confidencenintervals (shaded areas). The 2-component model illustrated ...
Figure images are served from the NIH/NLM PubMed Central Open Access Subset or Europe PMC; copyright remains with the publishers and authors.
💬 Discussion
0 commentsNo comments yet. Be the first to start a discussion!
Leave a Comment