Abstract
Mammalian oocytes contain lipid droplets that are a store of fatty acids, whose metabolism plays a substantial role in pre-implantation development. Fluorescent staining has previously been used to image lipid droplets in mammalian oocytes and embryos, but this method is not quantitative and often incompatible with live cell imaging and subsequent development. Here we have applied chemically specific, label-free coherent anti-Stokes Raman scattering (CARS) microscopy to mouse oocytes and pre-implantation embryos. We show that CARS imaging can quantify the size, number and spatial distribution of lipid droplets in living mouse oocytes and embryos up to the blastocyst stage. Notably, it can be used in a way that does not compromise oocyte maturation or embryo development. We have also correlated CARS with two-photon fluorescence microscopy simultaneously acquired using fluorescent lipid probes on fixed samples, and found only a partial degree of correlation, depending on the lipid probe, clearly exemplifying the limitation of lipid labelling. In addition, we show that differences in the chemical composition of lipid droplets in living oocytes matured in media supplemented with different saturated and unsaturated fatty acids can be detected using CARS hyperspectral imaging. These results demonstrate that CARS microscopy provides a novel non-invasive method of quantifying lipid content, type and spatial distribution with sub-micron resolution in living mammalian oocytes and embryos.
🔬 Techniques
🧬 Organisms
💻 Software
✨ Fluorophores
🧪 Sample Preparation
🏭 Microscope Brands
🧪 Reagent Suppliers
📷 Detectors
💻 Software Details
🏛️ Research Organizations (ROR)
Affiliated research institutions:
📋 Methods
Gamete collection and manipulation 4-6-week-old female MF1 mice were intraperitoneally injected with 5 IU PMSG to induce ovarian follicle growth. Approximately 24 h later, immature GV oocytes were collected from ovarian follicles or 10 IU hCG was injected to cause superovulation, and oviductal mature (MII) eggs were collected 15 h later. All animals were handled according to UK Home Office regulations, and procedures carried out under a UK Home Office Project Licence. Cumulus cells were removed by gentle pipetting (GV) or brief exposure to hyaluronidase (MII). Oocytes and eggs were kept at 37°C in drops of M2 medium (embryo-tested, Sigma). To maintain GV arrest, 100 μM IBMX (Sigma) was included. IVM was initiated by washing and culturing oocytes in standard M2 medium at 37°C or Minimum Essential Medium (MEM; Sigma) containing 3 mg/ml bovine serum albumin (BSA; Sigma). Drops of media were covered with mineral oil (embryo-tested, Sigma) to prevent evaporation. Pyruvate starvation was carried out by incubating MII eggs in HEPES-buffered KSOM medium containing 3 mg/ml BSA (both Sigma), lacking pyruvate and lactate, for ∼6 h before imaging. In vivo fertilisation was carried out by mating female MF1 mice with 10-24-week-old male F1-hybrid mice after the hCG injection, and oviductal zygotes were collected 15 h later. Embryos were cultured in KSOM (Millipore) at 37°C, 5% CO 2 under oil for up to 5 days, when blastocyst stage is reached. Where stated, egg and embryos were fixed in 1% paraformaldehyde (PFA) in phosphate buffered solution (PBS) with 1% polyvinyl alcohol (PVA) to prevent adhesion, for 10 min before holding in PBS. Fixed cells were stained for LDs using 1 µg/ml BODIPY 493/503 or HCS LipidTOX green neutral lipid stain at a 1:5000 stock dilution (both Life Technologies). Experiments were carried out on sample sizes of five or more oocytes or embryos for adequate representation, and repeated where possible. Eggs and embryos were randomly assigned to experimental and control groups, and only living eggs and embryos were included in data acquisition and analysis. CARS, DIC and TPF microscopy Standard microscope slides were prepared with SecureSeal imaging spacers (Sigma) of ∼150 μm thickness. Petroleum jelly was thinly spread around the well of the spacer for an airtight seal. Eggs were pipetted into a small drop of ∼10-20 μl of M2 media, embryos into PBS with PVA, and a coverslip used to create a sealed chamber. For imaging requiring exchange or addition of media, living cells or embryos were pipetted into a drop of M2 media covered in oil, and placed in an in-house-built imaging dish with a 25 mm round glass coverslip bottom and a removable glass lid. The CARS microscope was set up as described by Pope et al . (2013 ), with TPF and DIC imaging capabilities (further details can be found in the supplementary Materials and Methods) . 3D CARS images were taken as z -stacks over 50 μm depth in 0.5 μm steps, unless stated otherwise. CARS images in xy were taken with 0.1 μm pixel size, typically in a 100 μm×100 μm frame, with 0.01 ms pixel dwell time, and time-average total power of ∼20 mW at the sample. Hyperspectral imaging is performed by changing the relative delay time between the equally linearly chirped pump and Stokes pulses, which results in a tuning of the instantaneous frequency difference across the entire 1200-3800 cm −1 vibrational range, owing to the large bandwidth of the Stokes pulse ( Pope et al., 2013 ). In practice, scans were taken between 2600-3800 cm −1 in 5 cm −1 steps over a 10 µm×80-100 µm area, with 0.1 μm pixel size and a pixel dwell time of 0.001 ms, ten times less than the single frequency CARS images, to reduce photo-damage and motion artefacts. Raman-like spectra were retrieved from CARS spectra using hyperspectral image analysis (HIA) software developed in-house ( Masia et al., 2015 ). Hyperspectral images were background-corrected by subtracting an image measured under identical excitation and/or detection conditions but with pump and Stokes pulses out of time overlap, then were noise-filtered using a singular value decomposition (SVD) algorithm on the square root of the CARS intensity to retain only components above noise. CARS intensity ratios were calculated by dividing the background-corrected CARS intensity by the corresponding non-resonant CARS intensity measured in glass under the same excitation and detection conditions. The phase-corrected Kramers–Kronig method (PCKK) was used to retrieve from the CARS intensity ratio the complex CARS third-order susceptibility (normalised to the non-resonant value in glass), which is linear in the concentration of chemical components ( Masia et al., 2013 ). Shown spectra are the retrieved imaginary part of the susceptibility [Im(χ)] normalised to the total area, and Origin software (OriginLab) was used to plot these against eggs or embryos of the same developmental stage and/or conditions. TPF imaging of lipid stains absorbing at ∼480 nm and emitting at 510 nm±40 nm, simultaneously with CARS, was possible using a third near-infrared beam centred around 930 nm, hence separated from the pump and Stokes beam, independently optimised in time domain to provide Fourier-limited pulses of ∼30 fs duration at the sample for maximum TPF excitation (see Pope et al., 2013 ). TPF was detected simultaneously with CARS in the wavelength range 498-540 nm, via appropriate dichroic beamsplitters and band pass filters (Semrock) in front of a second photomultiplier (Hamamatsu, H10770A-40). Autofluorescence images were taken simultaneously with TPF and CARS, and were detected in the wavelength range 451-487 nm using an appropriate dichroic beam splitters and band pass filters (Semrock) and a third photomultiplier (Hamamatsu, H10721-210). Three-dimensional DIC images were taken with 20 ms frame exposure time and as z -stacks over the full cell-depth (∼70 μm) in 0.5 μm steps, using Micro-Manager software (Vale Lab, UCSF). A 12.5° polarisation angle in the de-Senarmont DIC illuminator was used, yielding a 25° phase offset, as this is found to be sufficiently small to enable good image contrast and sufficiently high to enable quantitative analysis of small phase objects such as lipid membranes ( McPhee et al., 2013 ). The MultiCARS software developed in-house was used to collect and regularise images from the CARS microscope. ImageJ (NIH) was used to assemble image stacks into maximum intensity projections and depth colour-coded projections. Intra-cytoplasmic sperm injection (ICSI) ICSI was performed as described by Yoshida and Perry (2007 ). Some zygotes died after ICSI and these were discounted from our data. Zygotes were imaged in M2 medium with DIC and subsequently a single xy image was taken of each, before culturing in KSOM (Millipore) at 37°C, 5% CO 2 under oil. DIC images of the embryos were taken five days later, and a score of the number of blastocysts in the population of living embryos was made. Control embryos were kept in M2 and not imaged, before culturing in KSOM. DIC images were then taken after development. Data are from five separate trials.
Show full methods section
Gamete collection and manipulation 4-6-week-old female MF1 mice were intraperitoneally injected with 5 IU PMSG to induce ovarian follicle growth. Approximately 24 h later, immature GV oocytes were collected from ovarian follicles or 10 IU hCG was injected to cause superovulation, and oviductal mature (MII) eggs were collected 15 h later. All animals were handled according to UK Home Office regulations, and procedures carried out under a UK Home Office Project Licence. Cumulus cells were removed by gentle pipetting (GV) or brief exposure to hyaluronidase (MII). Oocytes and eggs were kept at 37°C in drops of M2 medium (embryo-tested, Sigma). To maintain GV arrest, 100 μM IBMX (Sigma) was included. IVM was initiated by washing and culturing oocytes in standard M2 medium at 37°C or Minimum Essential Medium (MEM; Sigma) containing 3 mg/ml bovine serum albumin (BSA; Sigma). Drops of media were covered with mineral oil (embryo-tested, Sigma) to prevent evaporation. Pyruvate starvation was carried out by incubating MII eggs in HEPES-buffered KSOM medium containing 3 mg/ml BSA (both Sigma), lacking pyruvate and lactate, for ∼6 h before imaging. In vivo fertilisation was carried out by mating female MF1 mice with 10-24-week-old male F1-hybrid mice after the hCG injection, and oviductal zygotes were collected 15 h later. Embryos were cultured in KSOM (Millipore) at 37°C, 5% CO 2 under oil for up to 5 days, when blastocyst stage is reached. Where stated, egg and embryos were fixed in 1% paraformaldehyde (PFA) in phosphate buffered solution (PBS) with 1% polyvinyl alcohol (PVA) to prevent adhesion, for 10 min before holding in PBS. Fixed cells were stained for LDs using 1 µg/ml BODIPY 493/503 or HCS LipidTOX green neutral lipid stain at a 1:5000 stock dilution (both Life Technologies). Experiments were carried out on sample sizes of five or more oocytes or embryos for adequate representation, and repeated where possible. Eggs and embryos were randomly assigned to experimental and control groups, and only living eggs and embryos were included in data acquisition and analysis. CARS, DIC and TPF microscopy Standard microscope slides were prepared with SecureSeal imaging spacers (Sigma) of ∼150 μm thickness. Petroleum jelly was thinly spread around the well of the spacer for an airtight seal. Eggs were pipetted into a small drop of ∼10-20 μl of M2 media, embryos into PBS with PVA, and a coverslip used to create a sealed chamber. For imaging requiring exchange or addition of media, living cells or embryos were pipetted into a drop of M2 media covered in oil, and placed in an in-house-built imaging dish with a 25 mm round glass coverslip bottom and a removable glass lid. The CARS microscope was set up as described by Pope et al . (2013 ), with TPF and DIC imaging capabilities (further details can be found in the supplementary Materials and Methods) . 3D CARS images were taken as z -stacks over 50 μm depth in 0.5 μm steps, unless stated otherwise. CARS images in xy were taken with 0.1 μm pixel size, typically in a 100 μm×100 μm frame, with 0.01 ms pixel dwell time, and time-average total power of ∼20 mW at the sample. Hyperspectral imaging is performed by changing the relative delay time between the equally linearly chirped pump and Stokes pulses, which results in a tuning of the instantaneous frequency difference across the entire 1200-3800 cm −1 vibrational range, owing to the large bandwidth of the Stokes pulse ( Pope et al., 2013 ). In practice, scans were taken between 2600-3800 cm −1 in 5 cm −1 steps over a 10 µm×80-100 µm area, with 0.1 μm pixel size and a pixel dwell time of 0.001 ms, ten times less than the single frequency CARS images, to reduce photo-damage and motion artefacts. Raman-like spectra were retrieved from CARS spectra using hyperspectral image analysis (HIA) software developed in-house ( Masia et al., 2015 ). Hyperspectral images were background-corrected by subtracting an image measured under identical excitation and/or detection conditions but with pump and Stokes pulses out of time overlap, then were noise-filtered using a singular value decomposition (SVD) algorithm on the square root of the CARS intensity to retain only components above noise. CARS intensity ratios were calculated by dividing the background-corrected CARS intensity by the corresponding non-resonant CARS intensity measured in glass under the same excitation and detection conditions. The phase-corrected Kramers–Kronig method (PCKK) was used to retrieve from the CARS intensity ratio the complex CARS third-order susceptibility (normalised to the non-resonant value in glass), which is linear in the concentration of chemical components ( Masia et al., 2013 ). Shown spectra are the retrieved imaginary part of the susceptibility [Im(χ)] normalised to the total area, and Origin software (OriginLab) was used to plot these against eggs or embryos of the same developmental stage and/or conditions. TPF imaging of lipid stains absorbing at ∼480 nm and emitting at 510 nm±40 nm, simultaneously with CARS, was possible using a third near-infrared beam centred around 930 nm, hence separated from the pump and Stokes beam, independently optimised in time domain to provide Fourier-limited pulses of ∼30 fs duration at the sample for maximum TPF excitation (see Pope et al., 2013 ). TPF was detected simultaneously with CARS in the wavelength range 498-540 nm, via appropriate dichroic beamsplitters and band pass filters (Semrock) in front of a second photomultiplier (Hamamatsu, H10770A-40). Autofluorescence images were taken simultaneously with TPF and CARS, and were detected in the wavelength range 451-487 nm using an appropriate dichroic beam splitters and band pass filters (Semrock) and a third photomultiplier (Hamamatsu, H10721-210). Three-dimensional DIC images were taken with 20 ms frame exposure time and as z -stacks over the full cell-depth (∼70 μm) in 0.5 μm steps, using Micro-Manager software (Vale Lab, UCSF). A 12.5° polarisation angle in the de-Senarmont DIC illuminator was used, yielding a 25° phase offset, as this is found to be sufficiently small to enable good image contrast and sufficiently high to enable quantitative analysis of small phase objects such as lipid membranes ( McPhee et al., 2013 ). The MultiCARS software developed in-house was used to collect and regularise images from the CARS microscope. ImageJ (NIH) was used to assemble image stacks into maximum intensity projections and depth colour-coded projections. Intra-cytoplasmic sperm injection (ICSI) ICSI was performed as described by Yoshida and Perry (2007 ). Some zygotes died after ICSI and these were discounted from our data. Zygotes were imaged in M2 medium with DIC and subsequently a single xy image was taken of each, before culturing in KSOM (Millipore) at 37°C, 5% CO 2 under oil. DIC images of the embryos were taken five days later, and a score of the number of blastocysts in the population of living embryos was made. Control embryos were kept in M2 and not imaged, before culturing in KSOM. DIC images were then taken after development. Data are from five separate trials.
Aggregate analysis
CCDPlot software developed in-house was used to find the 3D coordinates amplitude maxima and sizes of LDs from the single-frequency CARS images. The background signal was subtracted, and the square root of the data was calculated to give amplitudes proportional to the number of CH 2 bonds in the sample. Peaks were fitted with a Gaussian function in three dimensions, and their amplitude, xyz width and centre was used to describe the LD. Origin was used to plot these parameters and analyse them statistically. An Origin script was used to assign an index to LDs separated from their nearest neighbour by less than a user-defined value L , the index being identical for all LDs belonging to the same cluster. The occurrence of this index was then used to calculate the number of LDs in each aggregate (called aggregate size) and the number of aggregates. We found that the optimum parameters to account for the observed clustering in the CARS images were obtained by calculating the distance between two LDs in resolution units, i.e.: with x i , y i , z i coordinates of the i th LD, RL=0.3 μm and RA=0.6 μm being the lateral and axial CARS resolution, respectively, and using , i.e. L equal to 1.5 times the distance in resolution units. In order to compare mean aggregate sizes across different developmental stages, the probability P k of each size k=1, 2, 3… (including size 1, i.e. isolated LDs) was calculated from the histogram of the aggregate size, as P k =O k /O, where O=Σ k O k and O k is the occurrence of size k. The mean square size was then calculated as for each egg or embryo (where we subtracted 1 to obtain the number of partner LDs in an aggregate). Origin was used to plot the square root of 〈 s 2 〉 for all eggs or embryos of a given developmental stage, against the total number of LDs at that stage. HIA, MultiCARS and CCD plot (as executable) software can be obtained by contacting the authors.
Statistical analysis
Correlation studies were carried out using an ImageJ ‘Correlation Threshold’ plug-in. The Pearson's correlation coefficient is calculated by coordinate correlation of pixels above a certain intensity threshold. Individual thresholds are calculated with ImageJ itself as intensities that give a Pearson's coefficient of 0. The resulting Pearson's coefficient for all pixels above threshold (RColoc) is a number between 0 and 1, to show the degree of significant correlation between CARS and TPF images. A correlation is accepted with a Pearson's coefficient of >0.5, but a significant correlation is considered with a coefficient of >0.95 (95% statistical confidence limit), as any lower value suggests the co-localisation seen is not more likely than random chance. The output correlation scatterplots show the linear relationship between pixels in corresponding CARS ( x -axis) and TPF ( y -axis) images.
LD size analysis
In order to compare mean LD sizes across different developmental stages, the volume of each LD was calculated using V i = W i x W i y W i z , where W i is the diameter of the i th LD in each xyz dimension obtained from the 3D fitting procedure of the CARS amplitude using CCDPlot software. To account for subresolution droplets, the volume of each LD was normalised as V in =V i (A i /A b ), where A i is the CARS amplitude (square root of the CARS intensity) of the droplet, and Ab represents the amplitude of the brightest droplet in the egg or embryo. A LD effective diameter was then calculated as d i =(V in ) 1/3 . The probability P di of each diameter d i was calculated from a histogram (see Fig. S1 ) of the diameters of LDs (bins of 1×10 –3 μm) present within that particular egg or embryo, as P di =O di /N, where N is the total number of LDs and O di is the occurrence of diameter d i . The mean diameter was then calculated as ⟨d⟩=Σ i d i P di for each egg or embryo. Origin was used to plot the mean ⟨d⟩ of all eggs or embryos of a given developmental stage, against the mean total number of LDs at that stage.
📊 Figures
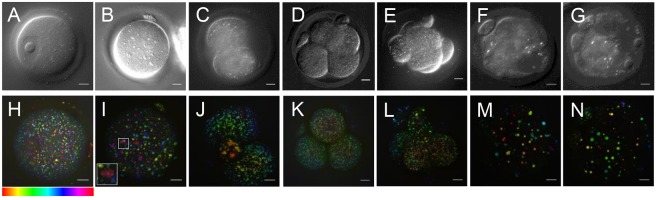
Fig. 1.
CARS and DIC images in living oocytes, eggs and early embryonic stages. (A-G) DIC images (single z -plane, except E, which is a maximum intensity projection) representative of populations of mouse egg...
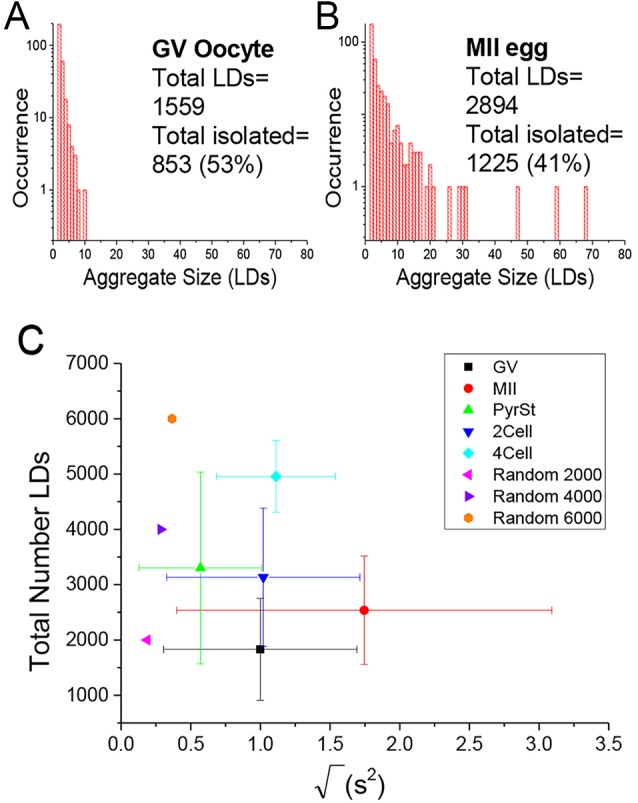
Fig. 2.
Lipid droplet quantification and clustering analysis. (A,B) Histograms of LD aggregate sizes (number of LDs in each cluster, and their occurrence) in a typical (A) GV oocyte, and (B) MII egg. Total nu...
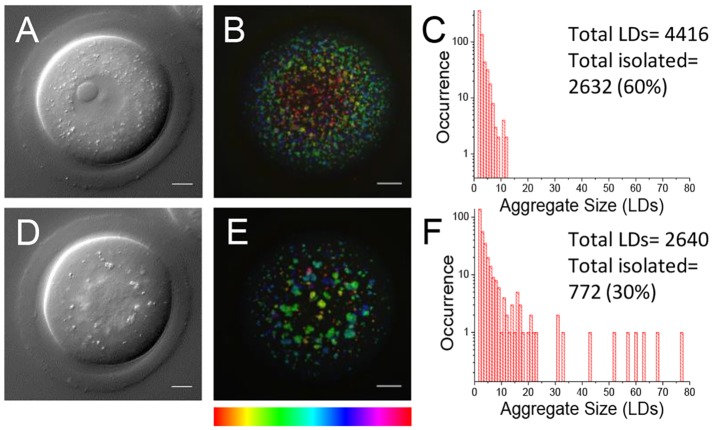
Fig. 3.
Cell viability after live imaging with CARS. (A,D) Single z -plane DIC using a 1.27 NA water objective and a 1.4 NA oil condenser and (B,E) depth colour-coded images of CARS stacks at wavenumber 2850u...
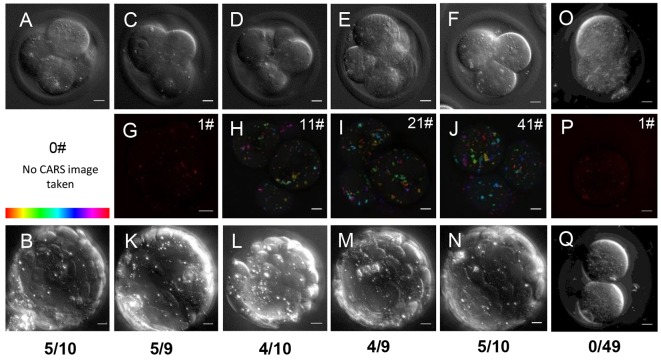
Fig. 4.
Embryo viability after live imaging with CARS. (A) Single z -plane and (B) maximum intensity projection DIC images taken with a 1.27 NA water objective and a 1.4 NA oil condenser of an embryo at four-...
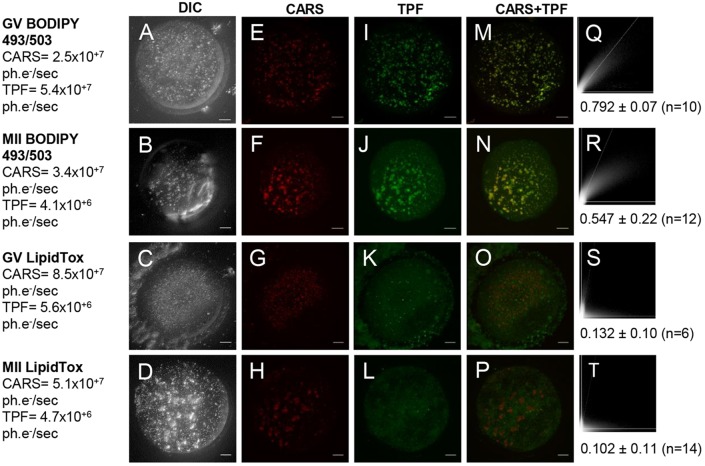
Fig. 5.
CARS images compared with conventional fluorescent lipid dyes on fixed eggs. (A-D) DIC (using a 1.27 NA water objective and a 1.4 NA oil condenser), (E-H) false-coloured CARS images at wavenumber 2850...
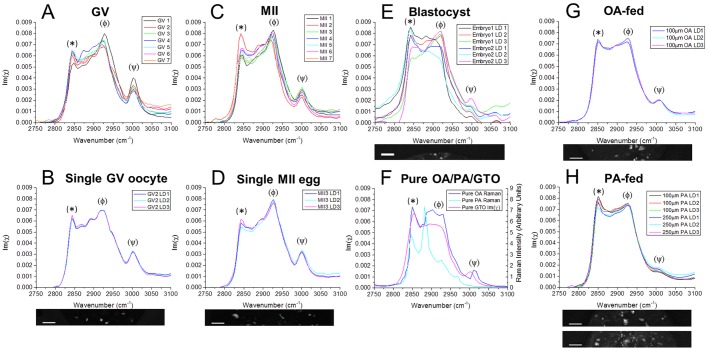
Fig. 6.
Hyperspectral imaging of chemical content of oocytes, eggs and embryos. (A-E) Vibrational Raman-like spectra Im(u03c7) obtained from CARS hyperspectral images. (A) Example LDs in all GV oocytes ( n =7...
Figure images are served from the NIH/NLM PubMed Central Open Access Subset or Europe PMC; copyright remains with the publishers and authors.
💬 Discussion
0 commentsNo comments yet. Be the first to start a discussion!
Leave a Comment