Abstract
The GTPase Rab27A interacts with myosin-VIIa and myosin-Va via MyRIP or melanophilin and mediates melanosome binding to actin. Here we show that Rab27A and MyRIP are associated with secretory granules (SGs) in adrenal chromaffin cells and PC12 cells. Overexpression of Rab27A, GTPase-deficient Rab27A-Q78L, or MyRIP reduced secretory responses of PC12 cells. Amperometric recordings of single adrenal chromaffin cells revealed that Rab27A-Q78L and MyRIP reduced the sustained component of release. Moreover, these effects on secretion were partly suppressed by the actin-depolymerizing drug latrunculin but strengthened by jasplakinolide, which stabilizes the actin cortex. Finally, MyRIP and Rab27A-Q78L restricted the motion of SGs in the subplasmalemmal region of PC12 cells, as measured by evanescent-wave fluorescence microscopy. In contrast, the Rab27A-binding domain of MyRIP and a MyRIP construct that interacts with myosin-Va but not with actin increased the mobility of SGs. We propose that Rab27A and MyRIP link SGs to F-actin and control their motion toward release sites through the actin cortex.
🔬 Techniques
🧬 Organisms
💻 Software
✨ Fluorophores
🧪 Sample Preparation
🔬 Cell Lines
🏭 Microscope Brands
🧪 Reagent Suppliers
📷 Detectors
🔎 Objectives
💻 Software Details
💾 Data Repositories
🏛️ Research Organizations (ROR)
Affiliated research institutions:
📋 Methods
Materials The rabbit anti-MyRIP antibody and the anti–myosin-VIIa antibody were described previously ( El Amraoui et al., 2002 ). Anti-LYAAT and anti-VMAT2 rabbit antisera were provided by B. Gasnier and C. Sagné (CNRS, Institut de Biologie Physico-Chimique); the anti–chromogranin B monoclonal antibody was a gift of W. Huttner (Max Planck Institute of Molecular Cell Biology and Genetics, Dresden, Germany); the anti–myosin-Va was provided by R. Cheney (University of North Carolina, Chapel Hill, NC). Anti-Rab27A monoclonal antibody was from Transduction Laboratories; anti–chromogranin A/B polyclonal antibody was from Abcam; anti-VAMP2 was from Synaptic Systems; anti-actin was from Sigma-Aldrich; and the myc tag 9B11 antibody was from Cell Signaling Technology.
Plasmid encoding rat
SERT (pcDNA3-SERT) and NPY–GFP were provided by R. Blakely (Vanderbilt University School of Medicine, Nashville, TN) and W. Almers (Oregon Health Sciences University, Portland, OR), respectively. pcDNA3-granuphilin was a gift of R. Regazzi (University of Lausanne, Lausanne, Switzerland). pEGFP-C1 was from BD Biosciences Clontech. Other plasmids encoding MyRIP and Rab27A constructs were described previously ( El-Amraoui et al., 2002 ; Ménasché et al., 2003 ). Streptolysin-O and α-toxin were obtained from S. Bhakdi (Johannes Gutenberg University, Mainz, Germany) ( Bhakdi et al., 1993 ). Latrunculin B and jasplakinolide were from Calbiochem. Other chemicals were purchased from Sigma-Aldrich.
Cell culture and transfection
Primary dissociated chromaffin cells from bovine adrenal medulla were prepared by retrograde collagenase perfusion and cultured as previously described ( Darchen et al., 1990 ). PC12 cells were cultured and transfected as described previously ( Schonn et al., 2003 ). Where indicated, NGF (50 μg/ml) was added to the culture medium. COS-7 cells were cultured in DME supplemented with 10% FBS at 37°C under 5% CO 2 . Chromaffin and COS-7 cells were transfected by electroporation using Optimix electroporation kit (Equibio). In brief, freshly prepared cells were suspended in Optimix buffer A and collected by centrifugation (800 g , 10 min). Cells (1.5 × 10 6 ) were resuspended in 55 μl Optimix buffer B containing vector DNAs (5 μg). A single electric shock (PC12: 650 V/cm, 24 ms; COS: 625 V/cm, 8 × 3 ms) was applied using a PS10 electropulsator (Jouan). Electroporated cells were immediately recovered in warm culture medium and plated onto polylysine-coated glass coverslips. Experiments were generally performed 3 d after transfection.
Show full methods section
Materials The rabbit anti-MyRIP antibody and the anti–myosin-VIIa antibody were described previously ( El Amraoui et al., 2002 ). Anti-LYAAT and anti-VMAT2 rabbit antisera were provided by B. Gasnier and C. Sagné (CNRS, Institut de Biologie Physico-Chimique); the anti–chromogranin B monoclonal antibody was a gift of W. Huttner (Max Planck Institute of Molecular Cell Biology and Genetics, Dresden, Germany); the anti–myosin-Va was provided by R. Cheney (University of North Carolina, Chapel Hill, NC). Anti-Rab27A monoclonal antibody was from Transduction Laboratories; anti–chromogranin A/B polyclonal antibody was from Abcam; anti-VAMP2 was from Synaptic Systems; anti-actin was from Sigma-Aldrich; and the myc tag 9B11 antibody was from Cell Signaling Technology.
Plasmid encoding rat
SERT (pcDNA3-SERT) and NPY–GFP were provided by R. Blakely (Vanderbilt University School of Medicine, Nashville, TN) and W. Almers (Oregon Health Sciences University, Portland, OR), respectively. pcDNA3-granuphilin was a gift of R. Regazzi (University of Lausanne, Lausanne, Switzerland). pEGFP-C1 was from BD Biosciences Clontech. Other plasmids encoding MyRIP and Rab27A constructs were described previously ( El-Amraoui et al., 2002 ; Ménasché et al., 2003 ). Streptolysin-O and α-toxin were obtained from S. Bhakdi (Johannes Gutenberg University, Mainz, Germany) ( Bhakdi et al., 1993 ). Latrunculin B and jasplakinolide were from Calbiochem. Other chemicals were purchased from Sigma-Aldrich.
Cell culture and transfection
Primary dissociated chromaffin cells from bovine adrenal medulla were prepared by retrograde collagenase perfusion and cultured as previously described ( Darchen et al., 1990 ). PC12 cells were cultured and transfected as described previously ( Schonn et al., 2003 ). Where indicated, NGF (50 μg/ml) was added to the culture medium. COS-7 cells were cultured in DME supplemented with 10% FBS at 37°C under 5% CO 2 . Chromaffin and COS-7 cells were transfected by electroporation using Optimix electroporation kit (Equibio). In brief, freshly prepared cells were suspended in Optimix buffer A and collected by centrifugation (800 g , 10 min). Cells (1.5 × 10 6 ) were resuspended in 55 μl Optimix buffer B containing vector DNAs (5 μg). A single electric shock (PC12: 650 V/cm, 24 ms; COS: 625 V/cm, 8 × 3 ms) was applied using a PS10 electropulsator (Jouan). Electroporated cells were immediately recovered in warm culture medium and plated onto polylysine-coated glass coverslips. Experiments were generally performed 3 d after transfection.
Immunoelectron microscopy
PC12 and chromaffin cells were fixed with 2% paraformaldehyde in 0.2 M phosphate buffer, pH 7.4, for 1 h at room temperature. Cells were embedded in 10% gelatin, infused in 2.3 M sucrose, and frozen in liquid nitrogen as described in detail previously ( Raposo et al., 1997 ). Ultrathin cryosections were prepared with a Leica FCS ultracryomicrotome (Leica) and single and double immunogold labeled with a mouse monoclonal anti-Rab27A antibody and a rabbit polyclonal anti–chromogranin A/B according to Slot et al. (1991) . A rabbit anti–mouse IgG was used after the first incubation with the monoclonal anti-Rab27A antibody. Protein A–gold conjugates (PAG 10 and PAG 15) were purchased from the Department of Cell Biology, Utrecht University, Utrecht, Netherlands. Relative quantitation of the immunogold labeling for Rab27A was performed directly under the electron microscope by counting 650 gold particles associated with the different subcellular compartments of PC12 cells. 560 granules were analyzed for the presence of Rab27A.
Interaction assays
GST and GST-MyRIP constructs were expressed in E. coli BL21 cells and purified by affinity chromatography onto glutathione–Sepharose (Amersham Biosciences) using standard procedures. Pull Down. Myosin-VIIa tail ( El Amraoui et al. 2002 ) was expressed in COS-7 cells. Transfected COS-7 cells or PC12 cells were scrapped, sonicated, and solubilized at 4°C for 30 min in a buffer containing 1% Triton X-100, 150 mM NaCl, 25 mM Tris-Cl, pH 7.5, 2 mM ATP, and a cocktail of proteases inhibitors. After centrifugation (12,000 g , 15 min), supernatants (0.5–1 mg protein) were incubated for 1 h at 4°C under agitation with 1 nmol of purified GST or GST–MyRIP constructs prebound to 150 μl glutathione–Sepharose beads. The beads were washed three times in 150 mM NaCl, 25 mM Tris-Cl, pH 7.5, and eluted in Laemmli sample buffer. Starting material and eluates were analyzed by SDS-PAGE and immunoblotting for the presence of myosin-Va or -VIIa. Coimmunoprecipitation. COS-7 cells were transfected 2 d before the experiment with vectors encoding myc-tagged MyRIP or MyRIP-ΔCter (1–665). Cells were lysed as described above. Extracts were incubated with protein A–Sepharose beads (100 μl wet volume; Amersham Biosciences) conjugated with or without affinity-purified anti-MyRIP antibody. After three washes, the eluates were analyzed by SDS-PAGE and immunoblotting for the presence of MyRIP (with an anti–c-myc tag antibody) or actin. Secretion assays The [ 3 H]5-HT release assay has been described previously ( Schonn et al., 2003 ). In brief, PC12 cells were transfected with the serotonin transporter SERT, loaded with [ 3 H]5-HT (5–20 Ci/mmol; Amersham Biosciences). Basal release was measured in Locke's solution containing (in mM) NaCl 154, KCl 5.5, glucose 5.6, NaHCO 3 3.5, CaCl 2 2.5, MgCl 2 1.2, Hepes 15, and 0.2% BSA, pH 7.4, adjusted with NaOH supplemented with 1 μM clomipramine. Secretion was measured at 37°C in high K + Locke's solution (55 mM K + with Na + reduced to 104.5 mM) in the presence of 1 μM clomipramine. After 2–10 min, the radioactivity released in the medium and remaining in the cells was measured. Alternatively, cells were rinsed twice with Ca 2+ -free Locke's solution and permeabilized for 4 min at 37°C with 20 μM digitonin or 22 U streptolysin-O in (in mM) potassium glutamate 139, Pipes 20, HEDTA 2, EGTA 2, free Mg 2+ 1, ATP 2, plus 0.3% BSA and pH adjusted to 7 using KOH. Secretion was then elicited in the same medium supplemented with 30 μM free Ca 2+ , for 5 min at 37°C. Free Ca 2+ concentrations were calculated according to Föhr et al. (1993) using calcv.22 software. Where indicated, cells were treated with 1 μM jasplakinolide or 5 μM latrunculin B for 20 min before being stimulated to secrete (in the continuing presence of the drug). The hGH release assay and amperometric recordings were performed as described previously ( Schonn et al., 2003 ). EW-FM An upright microscope (Olympus BX50WI) has been adapted to EW-FM by the prism approach ( Axelrod, 1981 ). To excite fluorescence, light from an argon laser set at 488 nm (Spectra Physics 177-G02) entered radially a hemispheric BK7 glass prism and struck its planar face at a supercritical angle. The angle was adjustable by means of telecentric optics to be described elsewhere, and the evanescent field decay length was calculated assuming a refractive index of 1.37 for the cellular medium (experimentally determined). NPY–GFP-transfected PC12 cells cultured on polylysine-coated glass coverslips were observed in Locke's solution. Coverslips were optically coupled to the planar face of the prism with immersion oil (Carl Zeiss MicroImaging, Inc.). The laser intensity was attenuated to ∼1 mW, and illumination was restricted to image acquisition by a shutter coupled to the camera. The cells were observed through a water immersion objective 60X 0.9 NA (Olympus), and the images were captured with a CDD camera (Photometrics CoolSnap HQ; Roper Scientific). In the present work, frames were acquired at 2 Hz in stacks of 120 images. Exposure times were of 100–300 ms, depending upon the signal to noise ratio, and under these conditions,
📊 Figures
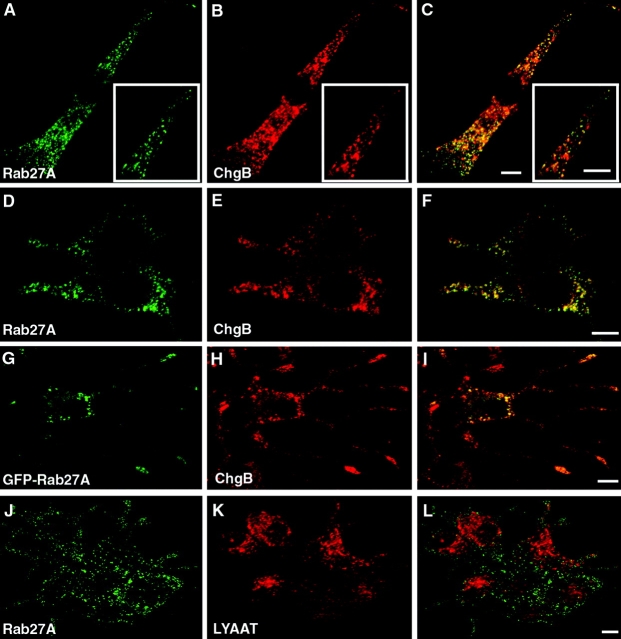
Figure 1.
Localization of Rab27A on SGs by confocal immunofluorescence. Chromaffin cells (Au2013C) were double imaged for endogenous Rab27A (A) and chromogranin A/B (B). Discrete punctate structures were observ...
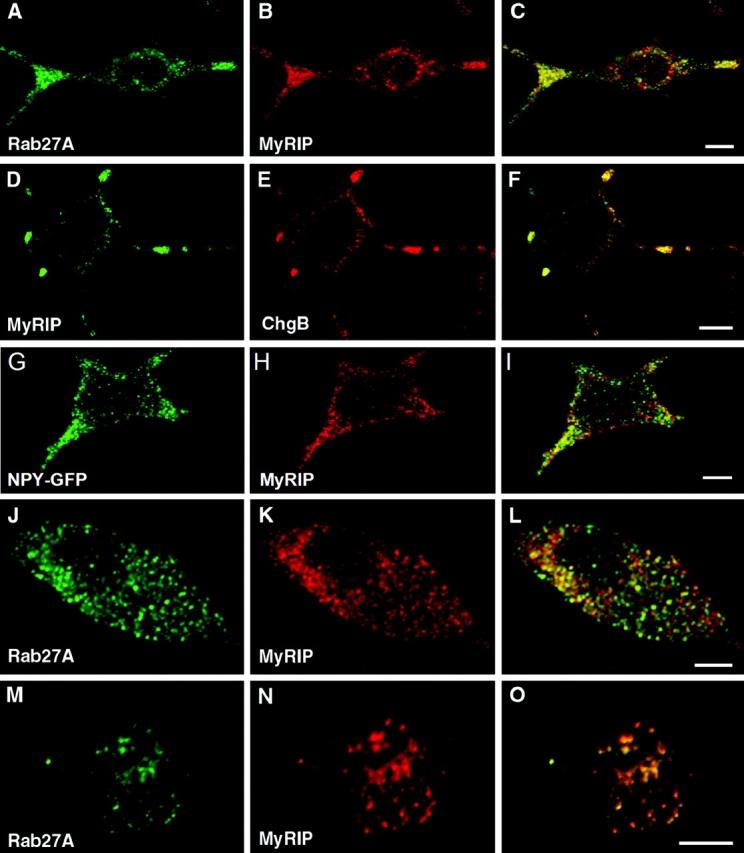
Figure 2.
Confocal immunofluorescence localization of MyRIP on SGs. PC12 cells (Au2013I) were double imaged for endogenous Rab27A (A) and MyRIP (B) showing discrete punctate structures; most of these structures...
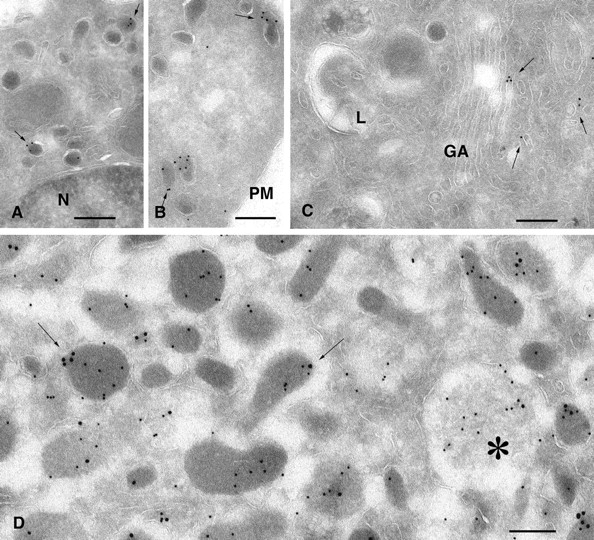
Figure 3.
Ultrastructural localization of Rab27A in PC12 and chromaffin cells. Ultrathin cryosections of PC12 (Au2013C) and chromaffin cells (D) were single or double immunogold labeled for Rab27A (10-nm gold p...
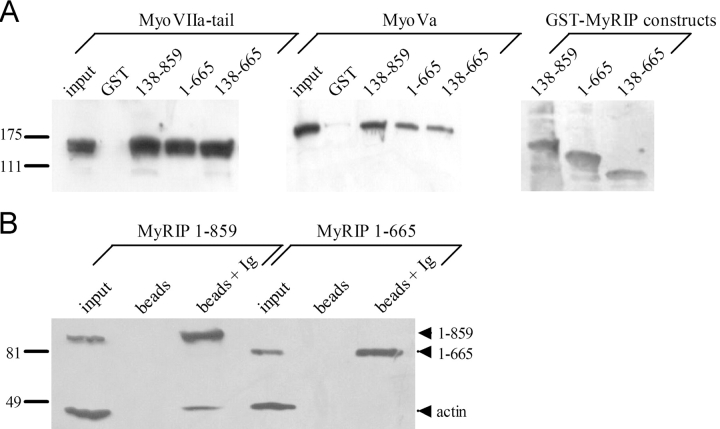
Figure 4.
Interaction of MyRIP with myosin-Va and actin. (A) Binding of myosin-VIIa tail (left) or myosin-Va (middle) to purified GST or GSTu2013MyRIP constructs immobilized on glutathioneu2013Sepharose beads. ...
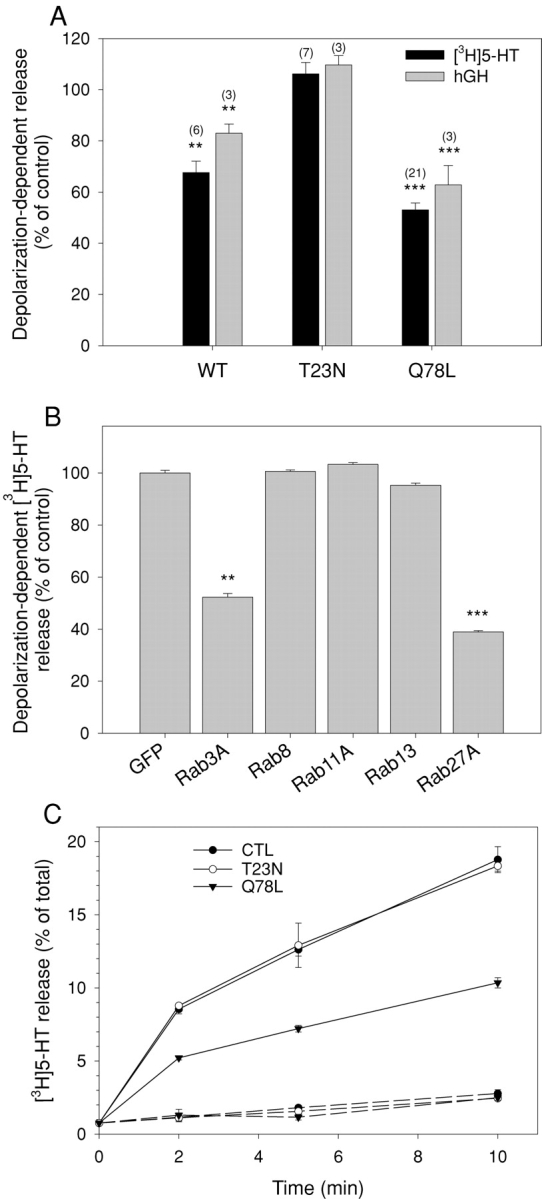
Figure 5.
Rab27A controls the magnitude of secretory responses. (A) SERT-transfected (black bars) or hGH-transfected PC12 cells (gray bars) were cotransfected with vectors encoding untagged Rab27A wild type, Ra...
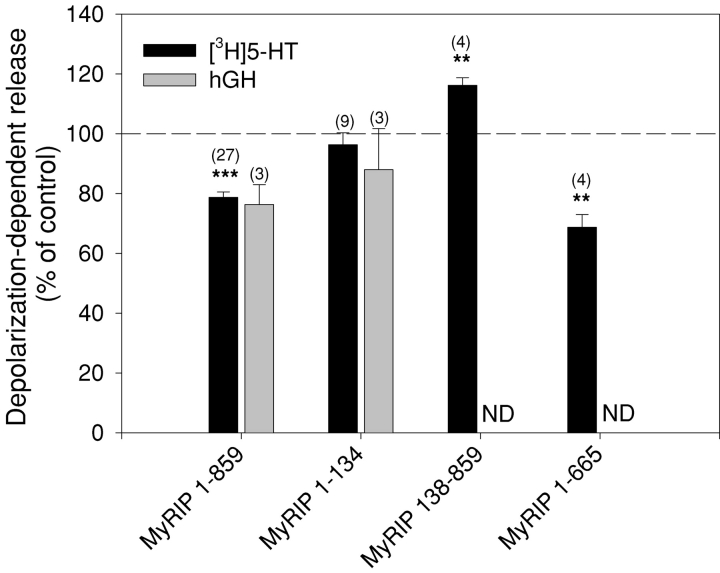
Figure 6.
MyRIP controls the magnitude of secretory responses. SERT-transfected (black bars) or hGH-transfected PC12 cells (gray bars) were cotransfected with vectors encoding wild-type MyRIP (MyRIP 1u2013859),...
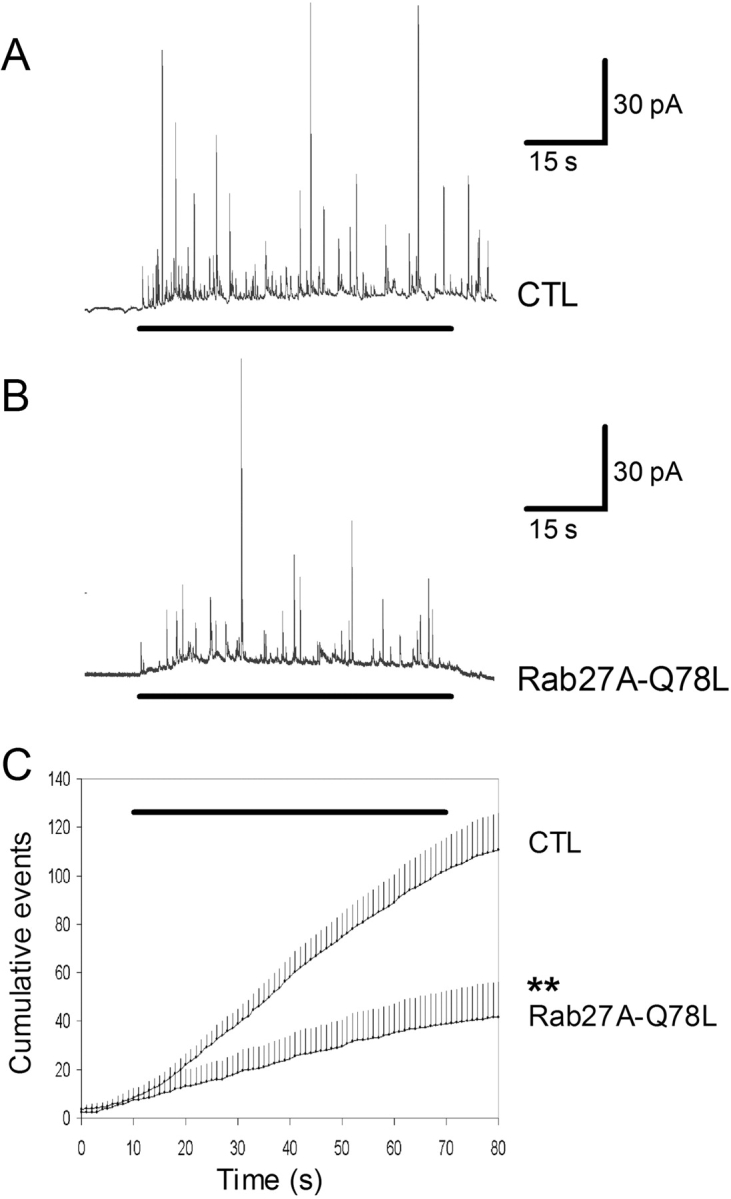
Figure 7.
Rab27A-Q78L reduces the frequency of amperometric spikes in chromaffin cells. Secretory responses of single adrenal chromaffin cells were monitored by carbon fiber amperometry. (A) Amperometric trace ...
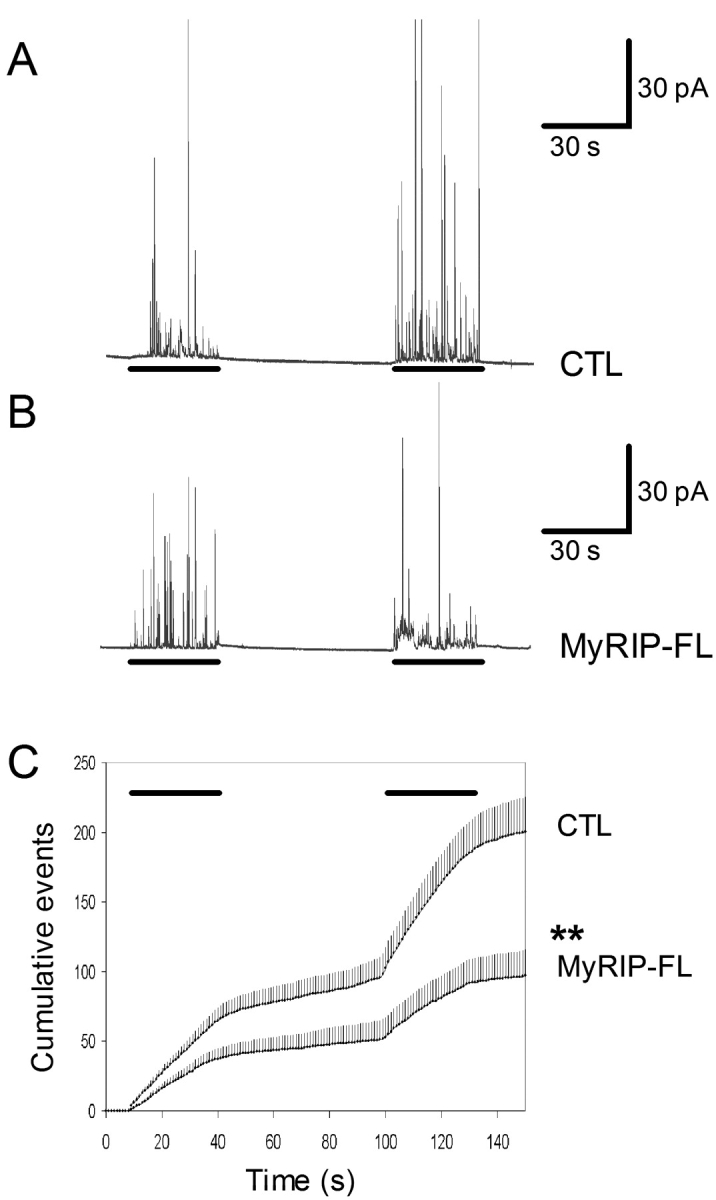
Figure 8.
Overexpression of MyRIP reduces the frequency of amperometric spikes in chromaffin cells. Secretory responses of single adrenal chromaffin cells were monitored by carbon fiber amperometry. (A) Amperom...
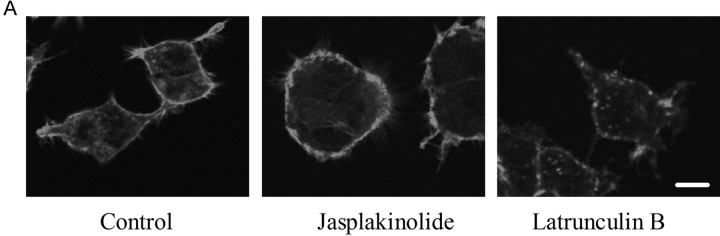
Figure 9.
The effects of Rab27A-Q78L and MyRIP on secretion depend on the state of the actin cortex. (A) Rhodamine-phalloidin staining of the actin cortex of PC12 cells. Compared with control conditions (left),...
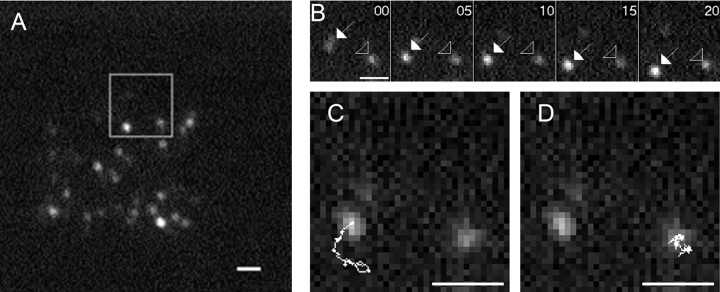
Figure 10.
Rab27A and MyRIP control the motion of SGs beneath the plasma membrane. (A) Intact PC12 cell expressing NPYu2013GFP. The cell was illuminated by evanescent field with a penetration depth of 200 nm (in...
Figure images are served from the NIH/NLM PubMed Central Open Access Subset or Europe PMC; copyright remains with the publishers and authors.
💬 Discussion
0 commentsNo comments yet. Be the first to start a discussion!
Leave a Comment