Abstract
Extracellular vesicles (EVs) have prevalent roles in cancer biology and regenerative medicine. Conventional techniques for characterising EVs including electron microscopy (EM), nanoparticle tracking analysis (NTA) and tuneable resistive pulse sensing (TRPS), have been reported to produce high variability in particle count (EM) and poor sensitivity in detecting EVs below 50 nm in size (NTA and TRPS), making accurate and unbiased EV analysis technically challenging. This study introduces direct stochastic optical reconstruction microscopy (d-STORM) as an efficient and reliable characterisation approach for stem cell-derived EVs. Using a photo-switchable lipid dye, d-STORM imaging enabled rapid detection of EVs down to 20-30 nm in size with higher sensitivity and lower variability compared to EM, NTA and TRPS techniques. Imaging of EV uptake by live stem cells in culture further confirmed the potential of this approach for downstream cell biology applications and for the analysis of vesicle-based cell-cell communication.
🔬 Techniques
🔭 Microscopes
💻 Software
✨ Fluorophores
🧪 Sample Preparation
🔬 Cell Lines
🏭 Microscope Brands
🧪 Reagent Suppliers
📷 Detectors
🔎 Objectives
💻 Software Details
🏛️ Research Organizations (ROR)
Affiliated research institutions:
📋 Methods
All materials were purchased from Thermofisher Scientific (UK) unless stated otherwise.
Cell culture
Mouse mesenchymal stem cells (MSCs, D1, ATCC CRL-12424) were cultured in low-glucose Dulbecco's modified Eagle's medium (DMEM) supplemented with 10% fetal bovine serum (FBS), 1% penicillin/streptomycin (P/S), 1% l -glutamine and 1% non-essential amino acids (NEAA). 0.25% trypsin-EDTA was used for splitting the cells.
Primary mouse neural stem cells
(NSCs) were isolated from adult mouse lateral ventricle tissue as previously described [ 36 ] and cultured in NSC medium (DMEM F12/Neurobasal (1:1) medium containing 0.5% (P/S) and 0.01% heparin, with B27 and N2 supplements, and bFGF and EGF (both 20 ng/μl)). Accutase (Sigma) was used to split NSCs.
EV isolation
Prior to EV isolation, MSCs were washed with Phosphate-buffered saline (PBS) and then incubated in with EV enrichment (Exo-E) medium - containing phenol red-free low-glucose DMEM,1% l -glutamine, 1% NEAA, 1% P/S and 10% Exo-free FBS (System Biosciences), with added DiD Vybrant Cell labelling solution according to manufacturer's instructions (5 μl/ml). After 6 h, the medium was collected and filtered using 0.45 μm syringe filters (SLS). For EV isolation, exoEasy Maxi Kit (Qiagen) was used according to manufacturer's instructions. For negative controls, freshly prepared [DiD in PBS], [DiD in Exo-E medium] and [DiD in serum-free Exo-E medium], were processed in the same way. Eluted EVs were either immediately diluted and used for size distribution and particle count analysis, or stored at −80 °C for use in cell culture experiments. Samples were sonicated prior to use using Bioruptor (Diagenode) at low power three times for 10 s. TEM and cryo-TEM For TEM, samples were prepared according to a published protocol with slight modifications [ 14 ]. Briefly, samples were fixed with 4% paraformaldehyde and added (5 μl/grid) to glow discharged (10 s at 5 mA using an Agar turbo coater aux power unit and dedicated glow discharge head) Formvar‑carbon coated EM grids (EM resolutions), and adsorbed for 20 min. Sample grids were washed with PBS and incubated with 1% glutaraldehyde for 5 min, washed with sterile distilled water, and incubated with 3% uranyl-acetate for 15 min for negative staining. TEM was carried out using a Tecnai Biotwin-12 with an accelerating voltage of 100 kV. For cryo-TEM, glow discharged Holey carbon copper TEM grids were used (EM resolutions). Samples were let to adsorb onto the grids (5 μl/grid) for 20 min before the excess solution was removed using filter paper and the grids allowed drying under ambient conditions. Samples were then frozen using a Gatan CP3 plunge freezing unit, blotting for 1 s and freezing in liquid ethane. Samples were transferred to cryo-TEM storage boxes and then loaded into a Gatan 626 cryo-TEM holder on a JEOL 2100+ TEM. Images were acquired for 2–4 s at a dose of below 10 e/A 2 , using a US1000 CCD camera and Digital Micrograph GMS 3.
Show full methods section
All materials were purchased from Thermofisher Scientific (UK) unless stated otherwise.
Cell culture
Mouse mesenchymal stem cells (MSCs, D1, ATCC CRL-12424) were cultured in low-glucose Dulbecco's modified Eagle's medium (DMEM) supplemented with 10% fetal bovine serum (FBS), 1% penicillin/streptomycin (P/S), 1% l -glutamine and 1% non-essential amino acids (NEAA). 0.25% trypsin-EDTA was used for splitting the cells.
Primary mouse neural stem cells
(NSCs) were isolated from adult mouse lateral ventricle tissue as previously described [ 36 ] and cultured in NSC medium (DMEM F12/Neurobasal (1:1) medium containing 0.5% (P/S) and 0.01% heparin, with B27 and N2 supplements, and bFGF and EGF (both 20 ng/μl)). Accutase (Sigma) was used to split NSCs.
EV isolation
Prior to EV isolation, MSCs were washed with Phosphate-buffered saline (PBS) and then incubated in with EV enrichment (Exo-E) medium - containing phenol red-free low-glucose DMEM,1% l -glutamine, 1% NEAA, 1% P/S and 10% Exo-free FBS (System Biosciences), with added DiD Vybrant Cell labelling solution according to manufacturer's instructions (5 μl/ml). After 6 h, the medium was collected and filtered using 0.45 μm syringe filters (SLS). For EV isolation, exoEasy Maxi Kit (Qiagen) was used according to manufacturer's instructions. For negative controls, freshly prepared [DiD in PBS], [DiD in Exo-E medium] and [DiD in serum-free Exo-E medium], were processed in the same way. Eluted EVs were either immediately diluted and used for size distribution and particle count analysis, or stored at −80 °C for use in cell culture experiments. Samples were sonicated prior to use using Bioruptor (Diagenode) at low power three times for 10 s. TEM and cryo-TEM For TEM, samples were prepared according to a published protocol with slight modifications [ 14 ]. Briefly, samples were fixed with 4% paraformaldehyde and added (5 μl/grid) to glow discharged (10 s at 5 mA using an Agar turbo coater aux power unit and dedicated glow discharge head) Formvar‑carbon coated EM grids (EM resolutions), and adsorbed for 20 min. Sample grids were washed with PBS and incubated with 1% glutaraldehyde for 5 min, washed with sterile distilled water, and incubated with 3% uranyl-acetate for 15 min for negative staining. TEM was carried out using a Tecnai Biotwin-12 with an accelerating voltage of 100 kV. For cryo-TEM, glow discharged Holey carbon copper TEM grids were used (EM resolutions). Samples were let to adsorb onto the grids (5 μl/grid) for 20 min before the excess solution was removed using filter paper and the grids allowed drying under ambient conditions. Samples were then frozen using a Gatan CP3 plunge freezing unit, blotting for 1 s and freezing in liquid ethane. Samples were transferred to cryo-TEM storage boxes and then loaded into a Gatan 626 cryo-TEM holder on a JEOL 2100+ TEM. Images were acquired for 2–4 s at a dose of below 10 e/A 2 , using a US1000 CCD camera and Digital Micrograph GMS 3.
Dot blot immunodetection MSCs and MSC-derived
EV extracts were lysed using RIPA lysis and extraction buffer with added proteinase inhibitor and phosphatase inhibitor cocktails (Sigma). Protein concentration was measured using a Bradford assay (Sigma). For dot blot analysis [ 37 ], 10 μg of protein from each sample were added onto nitrocellulose membranes and dried for 10 min. The membranes were blocked using 1% skimmed milk in TBS-T (0.1% Tween20 (Sigma) in Tris buffer) and incubated with primary antibodies against CD63, TSG101, or GM130 (Santa Cruz) for 30 min. Membranes were then washed with TBS-T, incubated with peroxidase conjugated secondary antibody (vector laboratories) for 30 min, and then washed with TBS-T, before a 1-minute incubation with ECL detection reagent. Membranes were immediately imaged using LAS-4000 (Fujifilm).
2.5 d-STORM characterisation
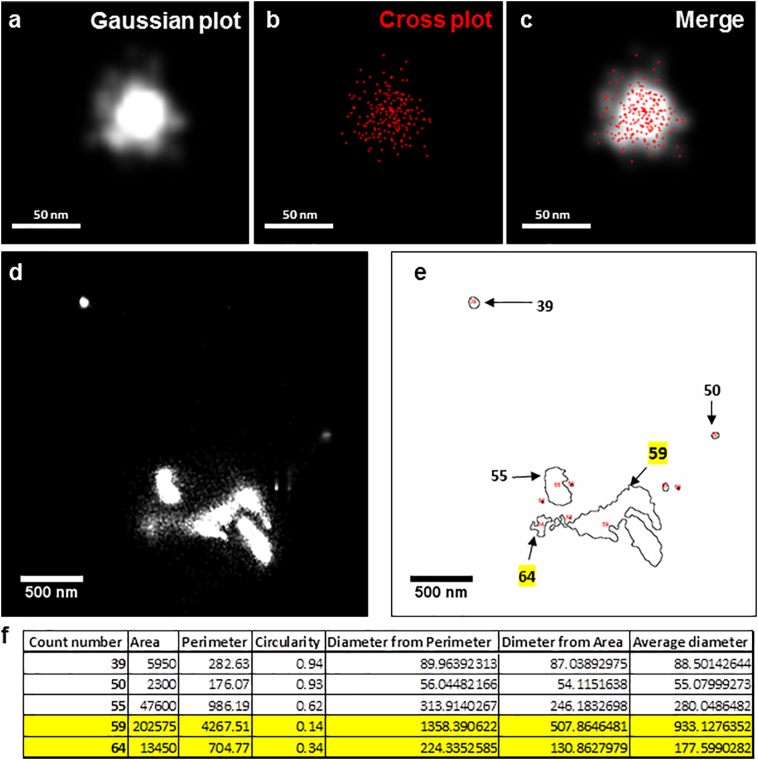
For d-STORM imaging, a 1 in 1000 dilution of DiD-labelled EVs in PBS was seeded onto poly- l -lysine (Sigma) coated 4-well glass bottom Petri dishes (Greiner-Bio). Imaging was performed using a Zeiss Elyra PS1 super resolution microscope, with an α-Plan Apo 100×/1.46 oil immersion objective in TIRF (Total internal reflection microscopy) mode. Before imaging, 30 °C oil (Zeiss, Immersol™ 518F/30°) droplet was placed on 100× objectives. The LP 650filter was used to visualise EVs. TIRF was used to visualise and scan the EVs bound to the cover glass, automatic focusing (definite focus) maintained the desired focal plane during the experiment. Before the STORM experiment, a wide-field snapshot was captured using the ‘16 Avg’ option (Zeiss) at 0.5% laser power (0.02 kW/cm 2 ) in TIRF mode to detect the distribution of DiD positive particles prior to d-STORM imaging. This feature was off when running d-STORM. d-STORM was run at 8% (0.31 kW/cm 2 ) laser power, recording 10,000 image frames (or cycles) with 25 ms exposure per frame, and 200 gain on the EM-CCD (Andor EM-CCD camera iXon Du 897). Test runs with higher power laser and longer scans did not provide extra information for this experiment. Notably, higher laser power may damage the smallest vesicles and compromise reliable STORM analysis. An 80-second video showing the photoswitching property of DiD-labelled EVs in TIRF mode during d-STORM imaging was recorded (25 frames per second). Images were processed using the PALM module of the Zeiss Zen Black software. Data were filtered as follows: number of photons threshold was adjusted to 200 according to measurements made on the negative controls -PBS only and medium only (no FBS). Localisation point centroids were blurred with a Gaussian filter, whose diameter equals the localisation precision for each localised molecule. The accuracy of the rendered image can be adjusted using the expansion factor slider in the Zeiss Zen Software (point spread function, PSF). Values lower than 1 PSF render higher precision to Gaussian representation of the localised molecules. With an expansion factor of 0.25 PSF, the cluster of localisations matched the rendered image (checked using cross plots) so that vesicle sizes were not over estimated ( Supplementary Fig. 1 a–c). Calibration experiments were done with known size fluorescent beads (100 nm and 190 nm). To export, image resolution was set at 5 nm/pixel with Render auto dynamic range of 90%. For line profiling, EV fluorescence intensity was measured on 16-bit tiff files exported as raw data from the czi files. For comparison of resolution, images were exported as tiff files and merged with reconstructed standard wide field (rSWF, for further info please see Zeiss Zen 2012, Palm Module, Help menu) of corresponding counterparts. An ImageJ macro was developed to identify and measure vesicles from exported 16-bit tiff files ( Supplementary file 1 ). The processing and analysis was carried out following the steps: (i) raw tiff images exported from Zen were imported into FIJI, (ii) a Gaussian blur filter (3 pixel) was applied to the image to smooth the edges of the vesicles, (iii) the default thresholding method was used to distinguish the vesicles from the background- thresholding setting a minimum and maximum pixel intensity range on the selected image that groups all pixels falling within this range and excluding the background, (iv) Once the vesicles were identified using the thresholding tool, particle analysis was carried out to generate size, intensity, shape measurements including the area, perimeter and circularity of the particle, (v) Outline of the identified vesicles was automatically exported as tiff so that it could be compared to the original images, (vi) Results were automatically exported as a text file. Result files generated from ImageJ macro were opened in Microsoft Excel software for further analysis as follows- (i) the diameter of objects was calculated by averaging the diameter calculated from the measured area and the measured perimeter of the object, (ii) the objects were then sorted according to their circularity. Objects below a circularity of 0.5 were discarded from the dataset as they largely corresponded to aggregate or tubular like structures ( Supplementary Fig. 1 d–f). (iii) The resulting data set from each sample was used to create a histogram frequency set in Excel. (iv) the concentration of particles was calculated using the following equation: Concentration = n ∗ dA ∗ df , where n is the number of vesicles observed per imaged area, dA is the area of the dish where sample is loaded and df is the dilution factor of loaded sample, and (v) mean ± SEM was plotted using GraphPad Prism Software ( https://www.graphpad.com ). Tuneable resistive pulse sensing (TRPS) TRPS was performed using the qNano system (IZON Sciences, New Zealand) with the IZON Control Suite software (V3.1.2.53). NP100, NP200 or NP300 elastomeric tuneable nanopores were used, suitable for analysing beads between 85 and 600 nm (as stated by the manufacturer). Carboxylated polystyrene beads, denoted as CPC200 (Bangs Laboratories, USA), with a mean nominal diameter of 210 nm and stock concentration of 1 × 10 12 particles/ml, were used as a concentration calibrant at 2 × 10 9 /ml. Prior to use, the beads were vortexed for 30 s and sonicated for 1 min to ensure mono-dispersity. An appropriate stretch and a voltage was applied throughout so that the blockades of CPC200s in PBS were at least 0.5 nA above the background noise. The qNano was operated as previously described [ 38 ]. Briefly, the lower fluid cell was filled with 75 μl of PBS, ensuring no air bubbles are present and the upper fluid cell contained 40 μl of sample. After each measurement, the sample was removed from the upper fluid cell and replaced with PBS. This was repeated several times, applying varying amounts of pressure and vacuum, until visible blockades were observed. Nanoparticle tracking analysis (NTA) A LM10/14 Nanosight (Nanosight, Malvern) instrument was used to analyse EVs. Prior to analysis, 1:10 dilution of CPC100 (IZON) and 1:1000 dilution of 200 nm polystyrene (Malvern) nanoparticles were used to test the sensitivity of the instrument. EV samples were used at 1:500 dilution. Automatic settings were applied for the minimum expected particle size, minimum track length and blur settings. For capture settings, screen gain was set at 1 and camera level was set at 10 (shutter 1500; gain 680). For analysis settings, screen gain was set at 10 and detection threshold was set at 10. Five movies of 60 s were captured at 30 frames per second for each sample. Data processing and analysis of particle size distribution and concentration were performed using NTA Software ( https://www.malvern.com ). NTA concentration estimation is dependent on the refractive index of particles under analysis according to the Rayleigh approximation σ s = 2 π 5 3 d 6 λ 4 n 2 − 1 n 2 + 2 2 (where d is the particle diameter, λ is the wavelength, and n is the ratio of particle refractive index to solvent refractive index [ 17 ]), which is known to vary in EV samples due to heterogenic size and content [ 11 ]. Therefore, NTA analysis was used only to determine PSD but not EV concentration. Confocal microscopy, structured illumination microscopy (SIM) and real-time wide-field imaging NSCs were seeded at 1 × 10 5 cells/cm 2 and left to grow for 24 h. Vybrant DiO was used to stain NSCs in culture according to manufacturer's protocol. NSCs were then incubated with 5 × 10 8 DiD labelled MSC derived-EVs as calculated by d-STORM. Nuclei were labelled with Hoechst 33258 according to manufacturer's instructions. Samples were imaged within 30 min. For confocal microscopy, real-time wide-field imaging and structured illumination microscopy (SIM), Zeiss Elyra PS.1 microscope equipped with C-Apochromat 63×/1.2 W Korr M27 objective was used. Lasers 633 (10%), 488 (0.2%) and 405 (2%) were used for confocal imaging. A pinhole of 1.06 Airy unit was used to image the full field of view, to have an optical slice equivalent of 1 μm thickness. For real-time wide-field imaging, the lasers 642 (1%), 488 (0.02%) and 405 (2%) were used with multi-bandpass filter BP 420–480 + BP 495–550 + LP 650 at exposure time of 40 ms and 200 camera gain on EMCCD camera (25 frames per second). The microscope had access to ‘internal’ hardware switch option which was used for fast imaging. For SIM, the following settings were used: multi-bandpass filter set BP 420–480 + BP 495–550 + LP 650, camera exposure time 35.0 ms, lasers 642 (20%), 488 (8%), 405 (8%), grating period 51 μm.
Statistical analysis
All experiments were run in triplicates using separate cell culture preparations (biological replicates), with at least three internal repeats (technical replicates). Mean and SEM were analysed using GraphPad Prism Software and Microsoft Excel (unless specified otherwise). One-way ANOVA with multiple comparison tests was run to determine the statistical significance for all analyses unless mentioned otherwise. Statistical significance levels were set for *p < 0.05, **p < 0.01, ***p < 0.001, ****p < 0.0001. All graphs were made using GraphPad Prism Software ( https://www.graphpad.com ).
📊 Figures
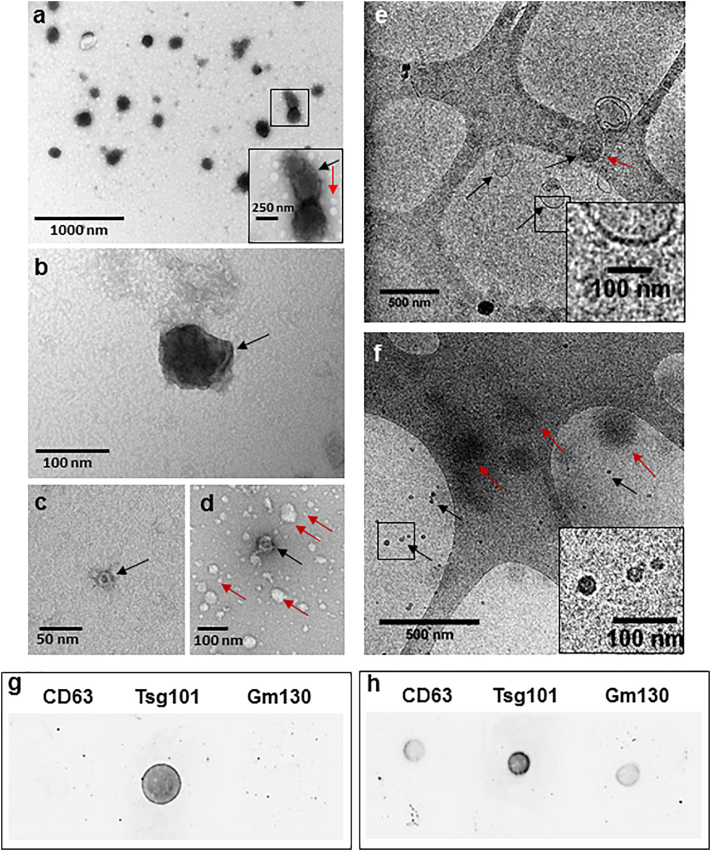
Fig. 1
Characterisation of EVs isolated from MSC culture supernatant. (au2013d) TEM images of EVs. (a) TEM showing polydispersity EV structures of 100u2013250u202fnm EVs. Zoomed-in box shows cup-shaped morph...
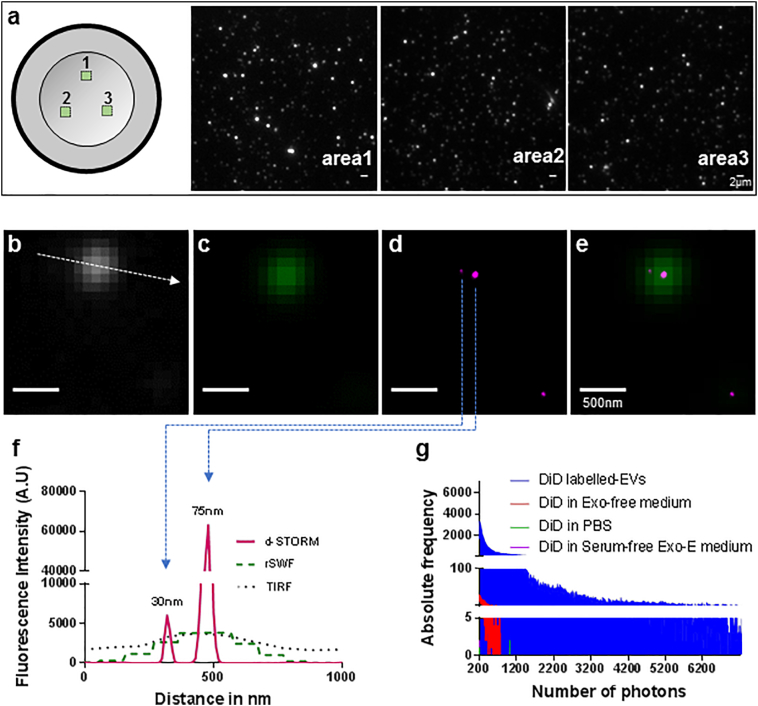
Fig. 2
d-STORM imaging of DiD-labelled EVs isolated from MSCs. (a) Graphical representation of the sample scanning pattern with snapshots of areas 1, 2 and 3 recorded in TIRF. Scale bar: 2u202fu03bcm. (bu201...
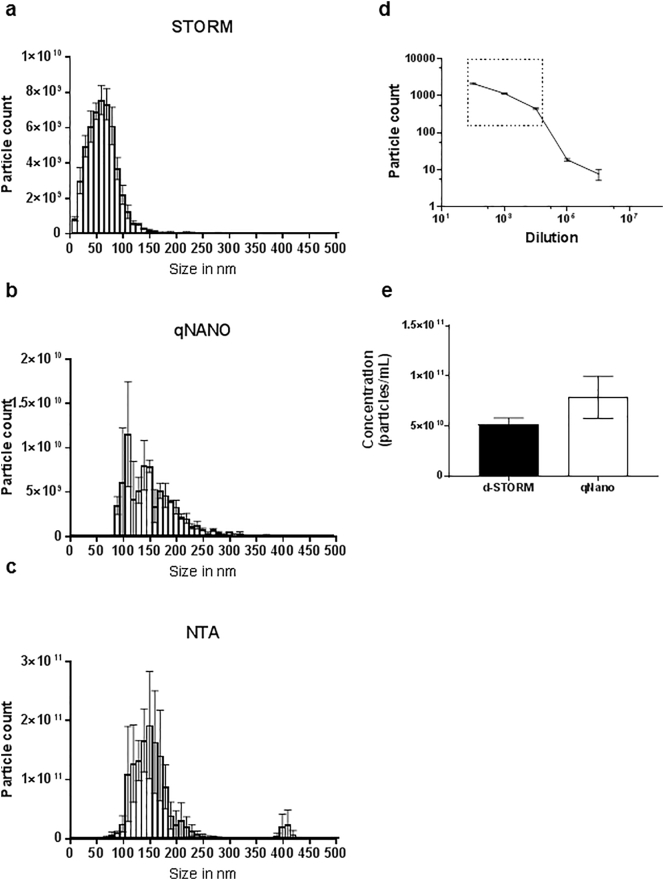
Fig. 3
Size distribution and concentration analysis of EVs isolated from MSCs. (au2013c) Particle size distribution analysed by (a) d-STORM imaging, (b) TRPS and (c) NTA. (d) Standard curve from DiD-labelled...
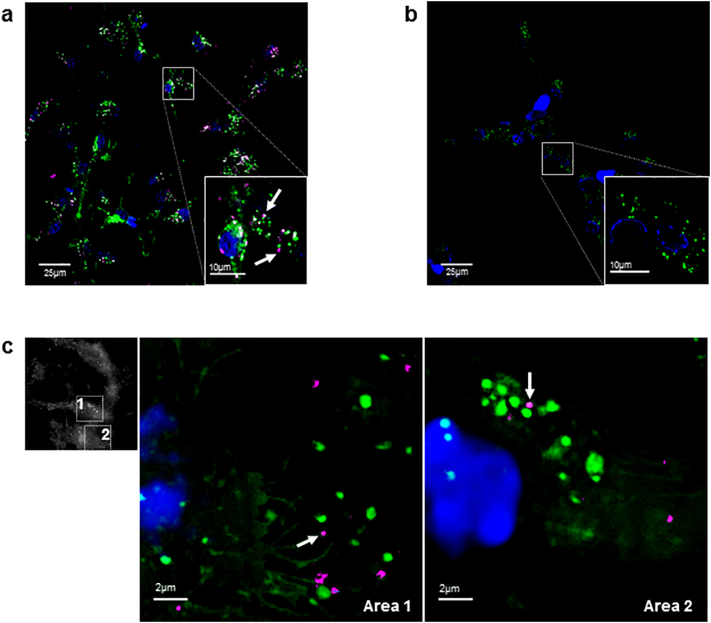
Fig. 4
Cellular uptake of MSC-derived EVs imaged in live NSC culture. (au2013b) Confocal microscopy imaging of live DiO-labelled NSCs (green) with nuclear counterstain (blue), incubated in the (a) presence o...
Supplementary Fig. 1
Image analysis of EVs captured using d-STORM super resolution microscopy. (au2013c) Snapshots describing the precision of d-STORM gaussian plot. (a) Gaussian rendered image of a vesicular structure (w...
Supplementary Fig. 2
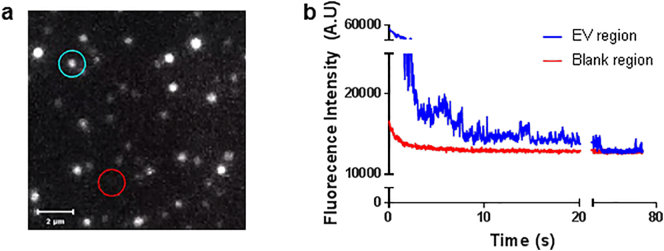
Photo-blinking frequency of DiD-labelled EVs isolated from MSCs during d-STORM imaging. (a) Screenshot from the video used to calculate the photo-blinking frequency of DiD-labelled EVs during STORM im...
Figure images are served from the NIH/NLM PubMed Central Open Access Subset or Europe PMC; copyright remains with the publishers and authors.
💬 Discussion
0 commentsNo comments yet. Be the first to start a discussion!
Leave a Comment