Abstract
Stress granules (SGs) are ribonucleoprotein (RNP) assemblies that form in eukaryotic cells as a result of limited translation in response to stress. SGs form during viral infection and are thought to promote the antiviral response because many viruses encode inhibitors of SG assembly. However, the antiviral endoribonuclease RNase L also alters SG formation, whereby only small punctate SG-like bodies that we term RNase L-dependent bodies (RLBs) form during RNase L activation. How RLBs relate to SGs and their mode of biogenesis is unknown. Herein, using immunofluorescence, live-cell imaging, and MS-based analyses, we demonstrate that RLBs represent a unique RNP granule with a protein and RNA composition distinct from that of SGs in response to dsRNA lipofection in human cells. We found that RLBs are also generated independently of SGs and the canonical dsRNA-induced SG biogenesis pathway, because RLBs did not require protein kinase R, phosphorylation of eukaryotic translation initiation factor 2 subunit 1 (eIF2α), the SG assembly G3BP paralogs, or release of mRNAs from ribosomes via translation elongation. Unlike the transient interactions between SGs and P-bodies, RLBs and P-bodies extensively and stably interacted. However, despite both RLBs and P-bodies exhibiting liquid-like properties, they remained distinct condensates. Taken together, these observations reveal that RNase L promotes the formation of a unique RNP complex that may have roles during the RNase L-mediated antiviral response.
🔬 Techniques
🔭 Microscopes
💻 Software
✨ Fluorophores
🧪 Sample Preparation
🔬 Cell Lines
🏭 Microscope Brands
🧪 Reagent Suppliers
📷 Detectors
💻 Software Details
💾 Data Repositories
🏛️ Research Organizations (ROR)
Affiliated research institutions:
📋 Methods
Plasmids
PKR-targeting sgRNAs were designed using IDT sgRNA design tool. PKR-targeting sgRNA oligonucleotides (IDT: PKR_sgRNA_1_sen, CACCGATTCAGGACCTCCACATGAT; PKR_sgRNA_1_anti, CATCATGTGGAGGTCCTGAATCAAA; PKR_sgRNA_2_sen, CACCGTTATCCATGGGGAATTACAT; and PKR_sgRNA_2_anti, CATGTAATTCCCCATGGATAACAAA) were ligated into the BbsI sites I px458-GFP-Cas9 plasmid (Addgene catalog no. 48138) using T4 ligase (NEB). The G3BP1-, G3BP2-, and GADD34-targeting Cas9 vectors were generated similarly using the following oligonucleotides: G3BP1_sgRNA_1_sen, CACCGTACCACACCATCATTTAGCG; G3BP1_sgRNA_anti, AAACCGCTAAATGATGGTGTGGTA; G3BP2_sgRNA_sen, CACCGGAGTGATGGAGTAGTTGTCC; G3BP2_sgRNA_anti, AAACGGACAACTACTCCATCACTCC; GADD34_sgRNA1_sen, CACCGGGACAACACTCCCGGTGTGA; GADD34_sgRNA1_anti, AAACTCACACCGGGAGTGTTGTCCC; GADD34_sgRNA_2_sen, CACCGTGAACGATACTCCCAGGACC; and GADD34_sgRNA_2_anti, AAACGGTCCTGGGAGTATCGTTCAC. The pLJM1–eGFP–G3BP1 vector was made by subcloning the eGFP–G3BP1 coding sequence into the NheI/EcoRI sites in pLJM1–eGFP. To make the pLenti–eGFP–G3BP1 vector, the eGFP–G3BP1 coding sequence was amplified via PCR using Phusion polymerase and inserted into the XhoI/XbaI sites of pLenti–EF1–BLAST vector using in-fusion. To generate the pLenti–mRuby-2–PABPC1 lentiviral plasmid, the mRuby-2 coding sequence was amplified via PCR, the PABPC1 coding sequence was amplified via PCR from the pCI–MS2V5–PABPC1 (Addgene catalog no. 65807), and the sequences were fused with and inserted into the XhoI/XbaI sites of pLenti–EF1–BLAST vector using in-fusion. Antibodies DCP1B (D2P9W) Rabbit mAb (Cell Signaling Technology catalog no. 13233) was used at 1:500 for IFA. Mouse anti-RNase L antibody 2E9 (Novus Biologicals catalog no. NB100-351) was used at 1:1500 for immunoblot analyses.
Show full methods section
Plasmids
PKR-targeting sgRNAs were designed using IDT sgRNA design tool. PKR-targeting sgRNA oligonucleotides (IDT: PKR_sgRNA_1_sen, CACCGATTCAGGACCTCCACATGAT; PKR_sgRNA_1_anti, CATCATGTGGAGGTCCTGAATCAAA; PKR_sgRNA_2_sen, CACCGTTATCCATGGGGAATTACAT; and PKR_sgRNA_2_anti, CATGTAATTCCCCATGGATAACAAA) were ligated into the BbsI sites I px458-GFP-Cas9 plasmid (Addgene catalog no. 48138) using T4 ligase (NEB). The G3BP1-, G3BP2-, and GADD34-targeting Cas9 vectors were generated similarly using the following oligonucleotides: G3BP1_sgRNA_1_sen, CACCGTACCACACCATCATTTAGCG; G3BP1_sgRNA_anti, AAACCGCTAAATGATGGTGTGGTA; G3BP2_sgRNA_sen, CACCGGAGTGATGGAGTAGTTGTCC; G3BP2_sgRNA_anti, AAACGGACAACTACTCCATCACTCC; GADD34_sgRNA1_sen, CACCGGGACAACACTCCCGGTGTGA; GADD34_sgRNA1_anti, AAACTCACACCGGGAGTGTTGTCCC; GADD34_sgRNA_2_sen, CACCGTGAACGATACTCCCAGGACC; and GADD34_sgRNA_2_anti, AAACGGTCCTGGGAGTATCGTTCAC. The pLJM1–eGFP–G3BP1 vector was made by subcloning the eGFP–G3BP1 coding sequence into the NheI/EcoRI sites in pLJM1–eGFP. To make the pLenti–eGFP–G3BP1 vector, the eGFP–G3BP1 coding sequence was amplified via PCR using Phusion polymerase and inserted into the XhoI/XbaI sites of pLenti–EF1–BLAST vector using in-fusion. To generate the pLenti–mRuby-2–PABPC1 lentiviral plasmid, the mRuby-2 coding sequence was amplified via PCR, the PABPC1 coding sequence was amplified via PCR from the pCI–MS2V5–PABPC1 (Addgene catalog no. 65807), and the sequences were fused with and inserted into the XhoI/XbaI sites of pLenti–EF1–BLAST vector using in-fusion. Antibodies DCP1B (D2P9W) Rabbit mAb (Cell Signaling Technology catalog no. 13233) was used at 1:500 for IFA. Mouse anti-RNase L antibody 2E9 (Novus Biologicals catalog no. NB100-351) was used at 1:1500 for immunoblot analyses.
Mouse monoclonal anti-G3BP antibody
(Abcam catalog no. ab56574) was used at 1:1000 for IFA and for IB analyses. Rabbit anti-GAPDH (Cell Signaling Technology catalog no. 2118L) was used at 1:2000 for IB analysis. Rabbit anti-PKR (Cell Signaling Technology catalog no. 12297S) was used at 1:1000 for IB analysis. Rabbit polyclonal anti-PABP antibody (Abcam catalog no. ab21060) was used at 1:1000 for IFA. Rabbit polyclonal anti-TIA1 (Abcam catalog no. ab40693) was used at 1:500 for IFA. Rabbit anti-FAM120A (Sigma–Aldrich catalog no. HPA019734) was used at 1:500 for IFA. Rabbit polyclonal anti-Caprin1 (Fisher Scientific catalog no. 50–554-357) was used at 1:500 for IFA. Rabbit polyclonal anti-PUM1 (Thermo Fisher Scientific catalog no. PA5-30327) was used at 1:500 for IFA. Rabbit polyclonal anti-FMRP (Abcam catalog no. ab17722) was used at 1:500 for IFA. Anti-GFP (Invitrogen catalog no. A11122) and IgG (Invitrogen catalog no. 10500C) were used for RLB immunoprecipitation. Goat anti-mouse IgG FITC (Abcam catalog no. ab97022) was used at 1:1000 for IFA. Goat anti-rabbit IgG Alexa Fluor 647 (Abcam catalog no. ab150079) was used at 1:1000 for IFA. Anti-rabbit IgG, HRP-linked antibody (Cell Signaling Technology catalog no. 7074S) was used at 1:3000 for IB analysis. Anti-mouse IgG, HRP-linked antibody (Cell Signaling Technology catalog no. 7076S) was used at 1:10,000 for IB analysis. Anti-puromycin antibody was used at 1:1000 for IFA (Millipore–Sigma catalog no. MABE343). Cell culture, drug treatments, and transfections The A549 cell line was provided by Dr. Chris Sullivan ( 38 ). The U-2 OS, U-2 OS G3BP1/2-KO, and U-2 OS GFP–G3BP/mRFP–DCP1a cells were provided by Dr. Paul Anderson ( 27 , 39 ). The cells were maintained at 5% CO 2 and 37 °C in Dulbecco's modified Eagle's medium supplemented with fetal bovine serum (10%, v/v) and penicillin/streptomycin (1% v/v). The cells were routinely tested for mycoplasma contamination by the CU Boulder BioFrontiers cell culture core facility and were negative for mycoplasma contamination throughout the study. The cells were transfected with high-molecular-weight poly(I·C) (InvivoGen catalog no. tlrl-pic) using 3 μl of Lipofectamine 2000 (Thermo Fisher Scientific) per 1 μg of poly(I·C). Unless otherwise noted, 500 ng/ml of poly(I·C) was used. Low-molecular-weight poly(I·C) (InvivoGen catalog no. tlrl-pic) was also used where indicated. Pateamine A was provided by Dr. Jerry Pelletier (Department of Biochemistry, McGill University), and the cells were treated with 100 n m pateamine A. The cells were treated with 500 μm of sodium arsenite (Sigma–Aldrich).
Generation of knockout cell lines
Generation of knockout cell lines was performed as described in Ref. 18 . Briefly, to knock out PKR in A549 and A549-RL-KO cell lines, cells (T-25 flask; 70% confluent) were co-transfected with 2 μg of px458-PKR and 200 ng of pcDNA3.1-puro using 6 μl of Lipofectamine 2000 (Thermo Fisher Scientific) according to the manufacturer's instructions. Twenty-four hours post-transfection, the medium was replaced with medium containing 2 μg/ml of puromycin. Selective medium was replaced 3 days post-transfection. Five days post-transfection, selective growth medium was replaced with normal growth medium. The cells were serial diluted and plated on 15-cm dishes. Individual colonies were isolated, propagated, and screened via Western blotting analysis. Knockout of GADD34 in A549-RL-KO cells was done similarly.
Generation of lentiviral particles and stable cell lines
Generation of lentivirus was performed as described in Ref. 18 . Briefly, to generate the GFP–G3BP1 and mRuby-2–PABPC1 lentiviral particles, HEK293T cells (T-25 flask; 80% confluent) were co-transfected with either 2.7 μg of either pLenti–EF1–GFP–G3BP1–blast or pLenti–EF1–mRuby-2–PABPC1–blast, 870 ng of pVSV-G, 725 ng of pRSV–Rev, and 1.4 μg of pMDLg–pRRE using 20 μl of Lipofectamine 2000. Medium was replaced 6 h post-transfection. Medium was collected at 24 and 48 h post-transfection and filter-sterilized with a 0.45-μm filter. To generate the A549 WT and RL-KO GFP–G3BP1/mRuby-2–PABPC1 stable cell lines, WT or RL-KO A549 cells (T-25 flask; 80% confluent) were transduced with 1 ml of lentiviral stocks containing 10 μg/ml of Polybrene for 1 h. Normal medium was then added to the flask. 24 h post-transduction, the cells were reseeded in T-25 flask containing 5 μg/ml of blasticidin selective medium. The cells were maintained in selective medium for 4 days before returning to normal growth medium. To generate GFP–G3BP1 lentiviral particles for transducing WT and RL-KO U-2 OS cells, HEK293T cells (15-cm dish; 80% confluent) were co-transfected with 11.7-μg of pLMJ1–GFP–G3BP1, 3.5 μg of pVSV-G, 2.9 μg of pRSV–Rev, and 5.6 μg of pMDLg–pRRE using 100 μl of Lipofectamine 2000. The medium was collected at 24 and 48 h post-transfection and filter-sterilized with a 0.45-μm filter.
WT and RL-KO U-2 OS cells
(T-25 flask, 80% confluent) were incubated with 1 ml of GFP–G3BP1 lentivirus particles (6.4 × 10 5 IU/ml; multiplicity of infection of ∼0.5) containing 10 μg/ml of Polybrene for 1 h. Normal medium was then added to the flask. 24 h post-transduction, the cells were reseeded in T-25 flask containing 2-μg/ml Puromycin selective medium. The cells were maintained in selective medium for 4 days before returning to normal growth medium.
Western blotting analysis
Western blotting analysis was performed as described in Ref. 18 . The cells were lysed in SDS solution (1% SDS, 2% β-mercaptoethanol) by boiling for 10 min followed by 1 min of vortexing. Equal volumes of lysates were fractionated on 4–12% Bis-Tris protein gels (Thermo Fisher Scientific) in MES buffer and transferred to nitrocellulose membrane (GE Healthcare). The membranes were blocked in 5% BSA in TBST. The membranes were then incubated with primary antibodies overnight at 4 °C. After washing, the membranes were incubated with HRP-linked anti-rabbit IgG or anti-mouse IgG secondary antibodies for 1 h at room temperature. After washing, the membranes were incubated with ECL substrates (Thermo Fisher Scientific catalog no. 32106) for 1–5 min. The membranes were then stripped using Restore Western blotting stripping buffer (Thermo Fisher Scientific catalog no. 21059) and reblocked with 5% BSA in TBST. Photographs of membranes were taken using ImageQuant LAS 4000 (GE Healthcare) and analyzed using ImageJ with Fiji plug-in.
Microscopy
Immunofluorescence and smFISH with 4′,6′-diamino-2-phenylindole staining were imaged using a wide field DeltaVision Elite microscope with a 100× objective using a PCO Edge sCMOS camera. For IFA, 10 Z sections at 0.3 μm/section were taken for each image. For IFA/smFISH, 15 Z planes at 0.2 μm/section were taken for each image. Deconvoluted images were processed using ImageJ with FIJI plugin. Z-planes were stacked, and minimum and maximum display values were set in ImageJ for each channel to properly view fluorescence. Quantification of smFISH was determined using Imaris Image Analysis Software (Bitplane) (University of Colorado–Boulder, BioFrontiers Advanced Light Microscopy Core). Live-cell imaging was performed using a Nikon spinning-disk confocal microscope outfitted with an environmental chamber with O 2 , CO 2 , temperature, and humidity control (University of Colorado–Boulder, BioFrontiers Advanced Light Microscopy Core). All images were acquired using a 2× Andor Ultra 888 EMCCD camera. FRAP assays were performed using an inverted Nikon A1R laser scanning confocal microscope equipped with an environmental chamber, a 100× NA 1.5 oil objective, and Nikon Elements software. Cells expressing GFP–G3BP and mCherry–PABP were transfected with poly(I·C). 3 h later, the cells were then placed in the Nikon A1R environmental chamber at 37 °C, 5% CO 2 . SG regions of varying sizes were selected for photobleaching. FRAP was performed by bleaching selected areas with 100% laser power for GFP and mCherry channels and then subsequently monitoring recovery of GFP and mCherry simultaneously over a period of 3 min. Three SGs were selected per cell with five cells/condition. To analyze recovery, the mean intensity of each bleached region was quantified in ImageJ, and recovery intensities were normalized to the mean prebleach measurements. Mobile fractions ϕM were computed by subtracting the minimum normalized mean intensity I 0 from the normalized end-point intensity IF: ϕM = IF − I0. To determine t ½ , the data were fit in to the equation: f ( t ) = A (1 − e (−τ; t )) + c , where f ( t ) = % recovery, A = mobile fraction, t = time, and τ = t ½ . Using % recovery, time, and calculated mobile fractions ( A ) as an upper constraint, t ½ was determined using Excel Solver.
Mass spectrometry U-2
OS-GFP–G3BP1 cells were grown to 80% confluence in 15-cm dishes (two dishes/replicate). The cells were transfected with poly(I·C) at 0.5 μg/ml. 4 h post-transfection, the medium was then aspirated, and the cells were resuspended in medium, scraped into a 50-ml conical tube, and pelleted via centrifuged at 1500 × g . The supernatant was aspirated, and the pellets were snap-frozen in liquid nitrogen. After thawing, the cells were resuspended in 1 ml of stress granule lysis buffer (50 m m Tris-HCl, pH 7.4, 100 m m potassium acetate, 2 m m magnesium acetate, 0.5 m m DTT, 50 μg/ml heparin, 0.5% Nonidet P-40, 1 complete mini EDTA free protease inhibitor tablet per 50 ml of buffer). The cells were then passed through a 25-gauge 5/8 needle seven times on ice to lyse. At this step, the lysate was inspected by wide field microscopy to determine whether granules were visible in the medium. The cells were then pelleted by centrifugation at 300 × g for 5 min at 4 °C. The supernatant was taken RNP complexes were pelleted via centrifugation at 18,000 × g for 20 min at 4 °C. The pellet was resuspended in 1 ml of stress granule lysis buffer and pelleted via centrifugation at 18,000 × g for 20 min at 4 °C. To preclear the samples and remove nonspecific binders, the pellet was resuspended in 340 μl of lysis buffer, and 60 μl of prewashed protein A Dynabeads were added and incubated for 30 min at 4 °C on nutator. Dynabeads were then taken off twice using a magnet, and the preclearance step was repeated. Following final removal of beads, 1 μg of either anti-GFP antibody (Invitrogen catalog no. A11122) or anti-IgG (Invitrogen catalog no. 10500C) were added to the respective samples and incubated overnight on nutator at 4 °C. Following incubation, the samples were centrifuged at 18,000 × g for 20 min at 4 °C to remove antibody. The pellet was resuspended in 500 μl of stress granule lysis buffer, and 33 μl of washed protein A Dynabeads (1 mg) were added and nutated for 3 h at 4 °C. The beads were then washed for 2 min in wash buffer 1 (stress granule lysis buffer + 2 m urea), for 5 min in wash buffer 2 at 4 °C (stress granule lysis buffer + 300 m m of potassium acetate), and for 5 min with stress granule lysis buffer at 4 °C. The sample was then washed eight times with 1 ml of tris-EDTA (TE) buffer to remove detergent, and the beads were brought up in 50 μl of TE buffer. The samples were then processed by the MS facility at University of Colorado–Boulder and analyzed on Thermo LTQ Orbitrap (Thermo Fisher Scientific). The Andromeda search engine was used to map peptides against the Uniprot human protein sequence database (71,803 entries) downloaded on January 12, 2018 ( 40 ). Parameters for mapping are included in Data File S1 . Only identification, reverse, or potential contaminants were filtered out. The false discovery rate was calculated as described in Refs. 40 and 41 . Proteins with fewer than five cumulative spectral counts between the three replicates were removed. Analysis of the variance between the GPF–G3BP1 immunoprecipitated replicates showed that the proteins enriched are reproducible (Rep1 and Rep2: R 2 = 0.774, Rep2 and Rep3: R 2 = 0.929, Rep1 and Rep3: R 2 = 0.721). The spectral counts from the remaining proteins were averaged and divided by the spectral counts in the IgG control. Proteins that were 2-fold enriched over the IgG control were selected for further analysis. A stress granule reference file was created by merging the proteins identified in three different stress granule proteomic studies that stress cells with sodium arsenite ( 3 , 42 , 43 ), which resulted in a stress granule proteome of 491 proteins. To determine the overlap between the poly I:C granule proteome and the sodium arsenite stress granule proteome, the two protein lists were inner joined using R . Gene Ontology was performed on the proteins that did not overlap with the stress granule proteome. Gene ontology biological processes were derived from Gene Ontology Consortium enrichment analysis ( 44 ).
Data availability
Raw mass spectrometry data sets were deposited in Mendeley: Burke, J. (2019), RNase L promotes the formation of unique ribonucleoprotein granules distinct from stress granules, Mendeley Data, V1, doi: 10.17632/gy3br29tzr.1.
📊 Figures
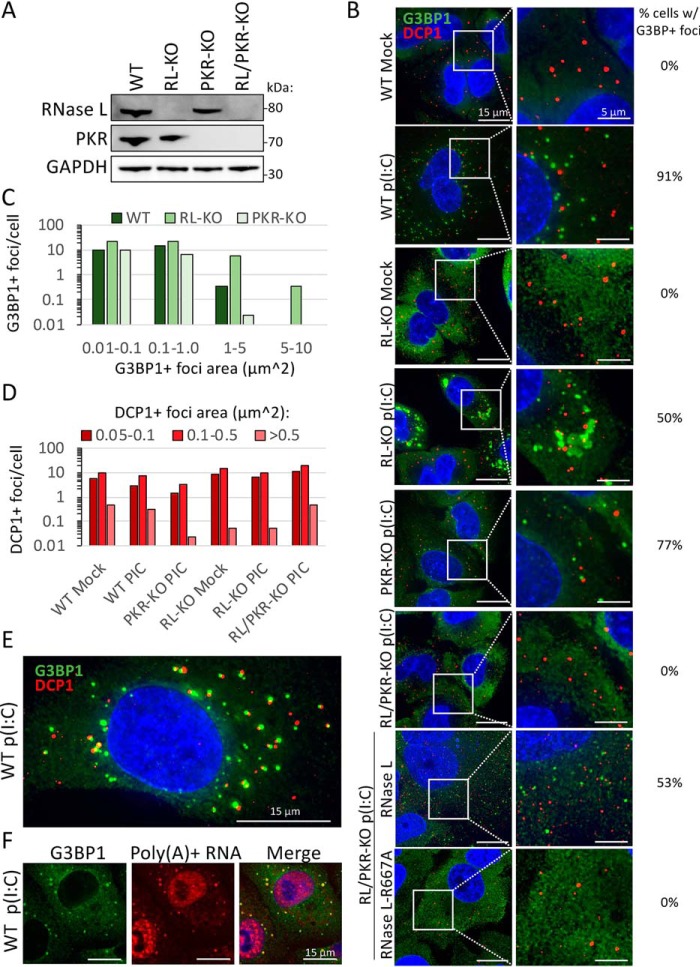
Figure 1.
RNase L inhibits SG but not PB assembly and promotes RLB assembly. A , Western blotting analysis of PKR and RNase L in parental (WT), RNase Lu2013KO (RL-KO), PKR-KO, and RNase L/PKR double knockout (R...
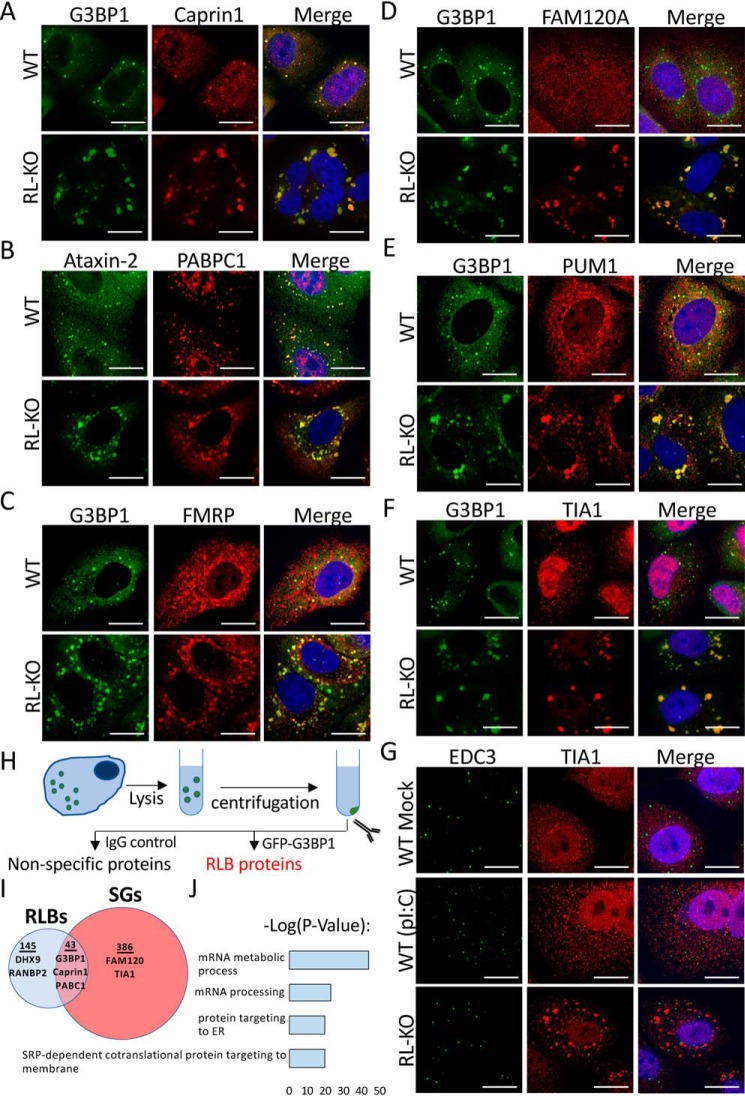
Figure 2.
RNase L regulates the localization of RBPs to mRNP complexes during dsRNA stress. Au2013G , IF for indicated RBPs in WT and RL-KO A549 cells post-poly(Iu00b7C) treatment. Scale bars represent 15 u03bc...
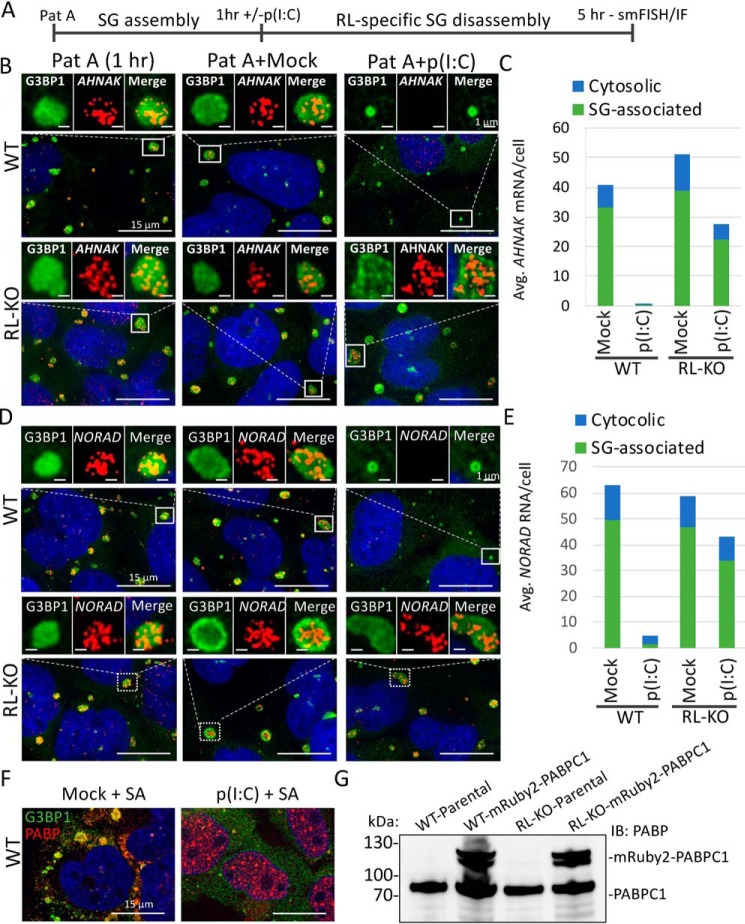
Figure 3.
RNase L inhibits the assembly and promotes the disassembly of SGs. A , schematic representing the experiment in Bu2013E . WT or RL-KO U-2 OS cells were treated with 100 n m of pateamine A ( Pat A ) fo...
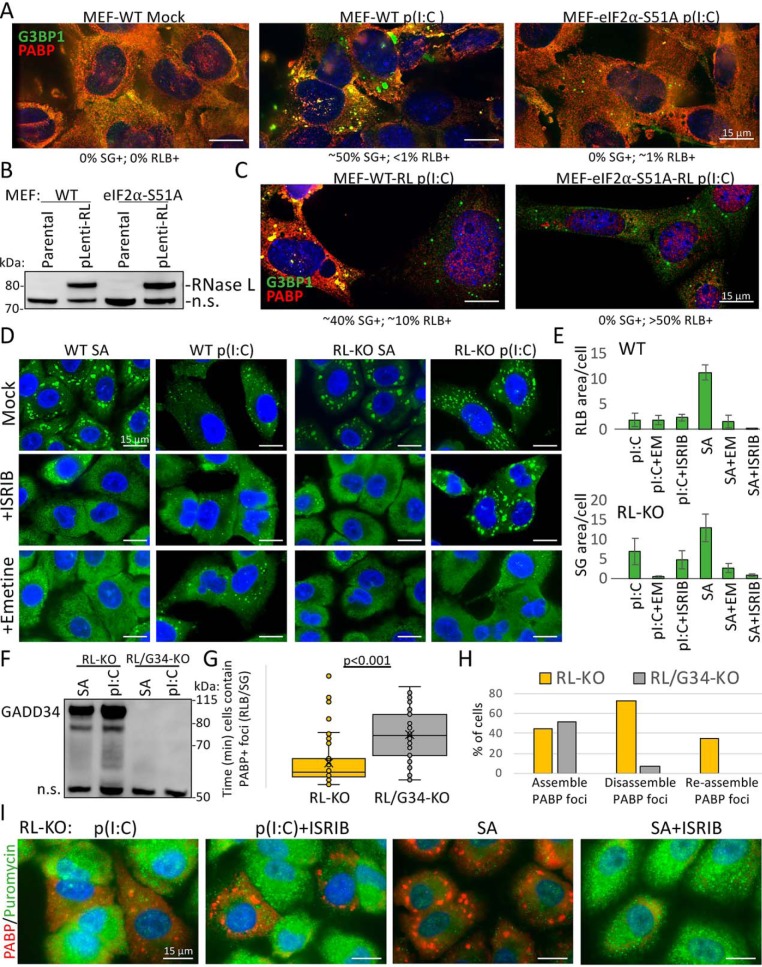
Figure 4.
RLBs do not require p-eIF2u03b1 or translation elongation to release mRNAs. A , IF for G3BP1 and PABPC1 in parental (WT) and eIF2u03b1u2013S51A knockin MEFs transfected with or without poly(Iu00b7C). ...
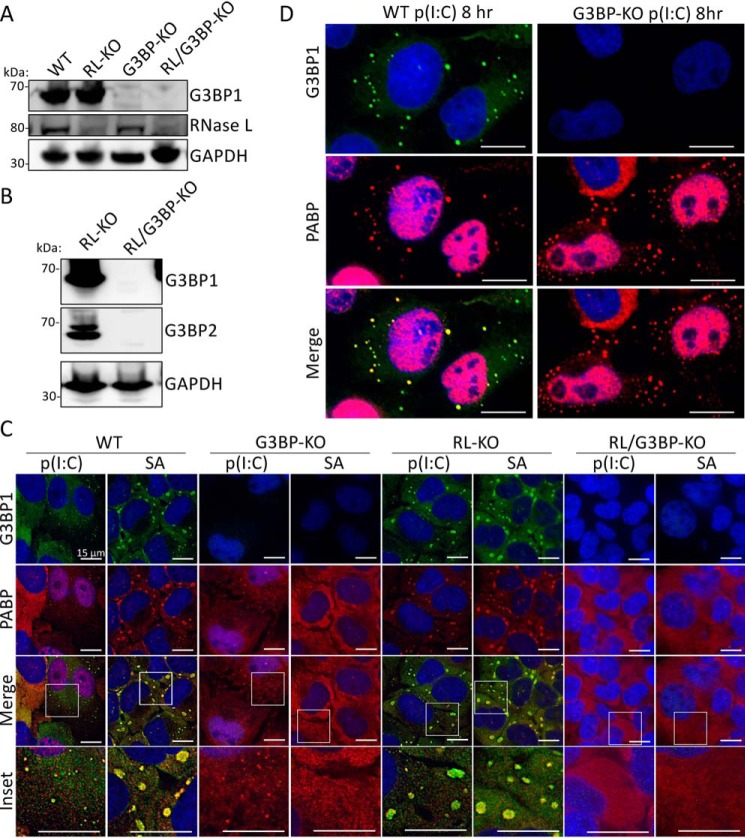
Figure 5.
dsRNA-induced SGs require G3BP1 and G3BP2, whereas RLBs do not. A , immunoblot for G3BP1, RNase L, GAPDH in parental (WT), RL-KO, G3BP-KO, and RL/G3BP-KO U-2 OS cells. B , immunoblot for G3BP1 and G3B...
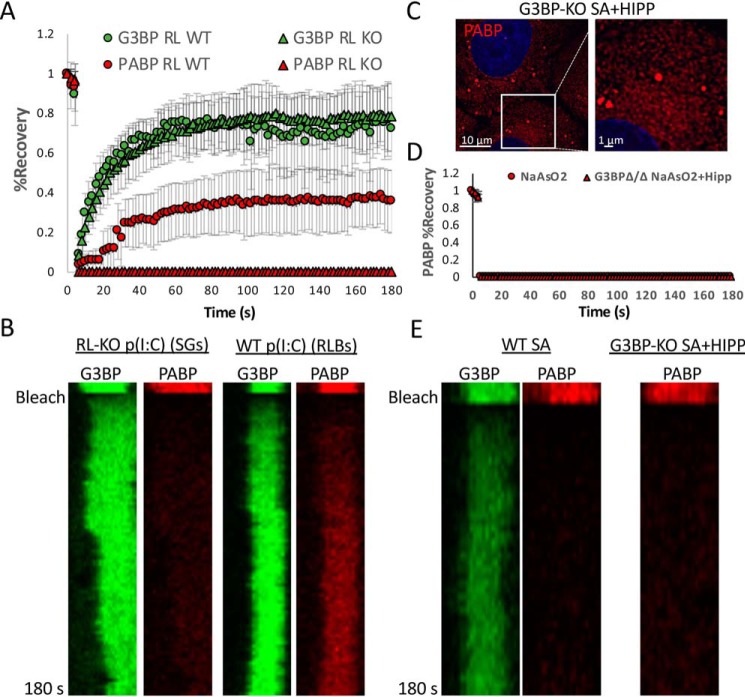
Figure 6.
PABP is more dynamically associated with RLBs than SGs. A , FRAP of GFPu2013G3BP1 and mRuby-2u2013PABPC1 in WT and RL-KO A549 cells. B , kymograph of FRAP analysis represented in A. C , PABPC1u2013mRu...
Figure images are served from the NIH/NLM PubMed Central Open Access Subset or Europe PMC; copyright remains with the publishers and authors.
💬 Discussion
0 commentsNo comments yet. Be the first to start a discussion!
Leave a Comment