Abstract
BACKGROUND: The notion that AP-2 clathrin adaptor is an essential component of an endocytic clathrin coat appears to conflict with recent observations that substantial AP-2 depletion, using RNA interference with synthesis of AP-2 subunits, fails to block uptake of certain ligands known to internalize through a clathrin-based pathway. METHODOLOGY/PRINCIPAL FINDINGS: We report here the use of in vivo imaging data obtained by spinning-disk confocal microscopy to study the formation of clathrin-coated structures at the plasma membranes of BSC1 and HeLa cells depleted by RNAi of the clathrin adaptor, AP-2. Very few clathrin coats continue to assemble after AP-2 knockdown. Moreover, there is a total absence of clathrin-containing structures completely lacking AP-2 while all the remaining coats still contain a small amount of AP-2. These observations suggest that AP-2 is essential for endocytic coated-pit and coated-vesicle formation. We also find that AP-2 knockdown strongly inhibits light-density lipoprotein (LDL) receptor-mediated endocytosis, as long as cells are maintained in complete serum and at 37 degrees C. If cells are first incubated with LDL at 4 degrees C, followed by warming, there is little or no decrease in LDL uptake with respect to control cells. LDL uptake at 37 degrees C is also not affected in AP-2 depleted cells first deprived of LDL by incubation with either serum-starved or LDL-starved cells for 24 hr. The LDL-deprived cells display a significant increase in endocytic structures enriched on deeply invaginated tubes that contain LDL and we suggest that under this condition of stress, LDL might enter through this alternative pathway. CONCLUSIONS/SIGNIFICANCE: These results suggest that AP-2 is essential for endocytic clathrin coated-pit and coated-vesicle formation. They also indicate that under normal conditions, functional endocytic clathrin coated pits are required for LDL internalization. We also show that under certain conditions of stress, cells can upregulate alternative endocytic structures with the potential to provide compensatory trafficking pathways.
🔬 Techniques
🔭 Microscopes
💻 Software
✨ Fluorophores
🧪 Sample Preparation
🔬 Cell Lines
🏭 Microscope Brands
🧪 Reagent Suppliers
📷 Detectors
💻 Software Details
🏛️ Research Organizations (ROR)
Affiliated research institutions:
📋 Methods
Methodology/Principal Findings We report here the use of in vivo imaging data obtained by spinning-disk confocal microscopy to study the formation of clathrin-coated structures at the plasma membranes of BSC1 and HeLa cells depleted by RNAi of the clathrin adaptor, AP-2. Very few clathrin coats continue to assemble after AP-2 knockdown. Moreover, there is a total absence of clathrin-containing structures completely lacking AP-2 while all the remaining coats still contain a small amount of AP-2. These observations suggest that AP-2 is essential for endocytic coated-pit and coated-vesicle formation. We also find that AP-2 knockdown strongly inhibits light-density lipoprotein (LDL) receptor-mediated endocytosis, as long as cells are maintained in complete serum and at 37°C. If cells are first incubated with LDL at 4°C, followed by warming, there is little or no decrease in LDL uptake with respect to control cells. LDL uptake at 37°C is also not affected in AP-2 depleted cells first deprived of LDL by incubation with either serum-starved or LDL-starved cells for 24 hr. The LDL-deprived cells display a significant increase in endocytic structures enriched on deeply invaginated tubes that contain LDL and we suggest that under this condition of stress, LDL might enter through this alternative pathway.
Methods
Cells, plasmids, transfections and reagents BSC1 (BS-C-1; ATCC CCL-26) and HeLa (ATCC CCL-2) cells were grown at 37°C with 5% CO 2 and 100% humidity as adherent cells in DMEM supplemented with 10% fetal bovine serum (FBS). The generation and characterization of BSC1 and HeLa cell lines stably expressing EGFP-fusion chimeras of LCa or σ2 were described previously [3] , [12] . We have generated cell lines stably expressing CD8-LDLR (a gift from M. Robinson) by transfection with the plasmid (see below) followed by selection and maintenance with complete medium supplemented with geneticin (G418, 0.5–0.7 mg/ml). Transient transfections of Tomato-LCa (previously described in [12] ) on σ2-EGFP stable cell lines were carried out using FuGENE 6 (Roche Diagnostics, Indianapolis, IN) for HeLa cells and Lipofectamine 2000 (Invitrogen, Carlsbad, CA) for BSC1 cells and the cells were studied 24–48 h after. The following reagents were used: human transferrin labeled with Alexa Fluor 594 (Tf-A594) or Alexa Fluor 647 (Tf-A647), FM 1-43 (Molecular Probes, Eugene, OR); LDL-Cy5 was prepared by labeling LDL (a gift from Prof. Angelo Scanu, University of Chicago) with a Cy5-labelling kit (Molecular Probes, Eugene, OR or Amersham GE Healthcare, UK). The following antibodies were used: mouse monoclonal anti-human CD8 clone UCHT-4 (Sigma, Saint Louis, MO), mouse anti-actin (Sigma, Saint Louis MO), mouse anti μ2-adaptin (Transduction Laboratories) and mouse anti α-adaptin (BD Biosciences, San Jose CA). Small interfering RNA BSC1 or HeLa cells in 6-well plates were transfected using Oligofectamine (Invitrogen Carlsbad, CA) with 6 nM siRNA specific for μ2-adaptin [5] purchased from Dharmacon, Inc. (Lafayette, CO), followed by a second transfection 24 h later with 6 nM siRNA; experiments were conducted after an additional 48 interval (for Figure 1 ). Similar results were obtained when BSC1 or HeLa cells in 6-well plates were subjected to two successive transfections, performed 48 h apart, with 10 nM siRNA each time. Cells were plated on glass coverslips 36 h after the second transfection and studied 12 h after (for Figure 2 – 7 ). Control cells were treated equally but with no μ2 siRNA. 10.1371/journal.pone.0010597.g001 Figure 1 RNAi Depletion of AP-2. ( A , B ) Immunoblots of cell extracts from HeLa or BSC1 cells treated with for 72 h in presence or absence of μ2- siRNA oligos and probed with antibodies specific for μ2-adaptin, α-adaptin or β-actin (used as loading control). Serial dilutions (30 µl (100%), 15 µl (50%), 6 µl (20%) and 3 µl (10%)) of the control cell extracts were processed for western blots; 30 µl (100%) were used for 3 independent μ2-RNAi cell extracts. ( C , D ) Residual μ2-adaptin and α-adaptin in each cell type, obtained from three independent RNAi experiments. Each band was background-corrected, normalized to the corresponding intensity of the actin band, then expressed as percent of its value with respect to the 100% loading. 10.1371/journal.pone.0010597.g002 Figure 2 Effect of AP-2 depletion on the surface distribution of AP-2 and on the uptake of transferrin. ( A , B ) Control (-μ2 RNAi) and treated (+ μ2 RNAi) HeLa and BSC1 cells stably expressing σ2-EGFP were incubated at 37°C with 10 µg/ml of Tf-A594 for 10 min, followed by a quick rinse at 4°C to remove unbound transferrin, fixed with 3.7% PFA, and imaged in 3D with wide-field illumination. Representative views of the plane closest to the coverslip (σ2-EGFP) and of an equatorial plane (Tf) show a decrease in punctate σ2-EGFP signals at the cell membrane and inhibition of transferrin uptake. Insets correspond to representative boxed regions. Arrowheads mark the few remaining AP-2 spots in Tf-negative cells. Bar, 20 µm. ( C , D ) Histrograms showing the amount, relative to controls, of internalized transferrin obtained from the total fluorescence signal of Tf-A594 in the 3D stacks. The remaining signals were 11.9±6.9% ( p
Show full methods section
Methodology/Principal Findings We report here the use of in vivo imaging data obtained by spinning-disk confocal microscopy to study the formation of clathrin-coated structures at the plasma membranes of BSC1 and HeLa cells depleted by RNAi of the clathrin adaptor, AP-2. Very few clathrin coats continue to assemble after AP-2 knockdown. Moreover, there is a total absence of clathrin-containing structures completely lacking AP-2 while all the remaining coats still contain a small amount of AP-2. These observations suggest that AP-2 is essential for endocytic coated-pit and coated-vesicle formation. We also find that AP-2 knockdown strongly inhibits light-density lipoprotein (LDL) receptor-mediated endocytosis, as long as cells are maintained in complete serum and at 37°C. If cells are first incubated with LDL at 4°C, followed by warming, there is little or no decrease in LDL uptake with respect to control cells. LDL uptake at 37°C is also not affected in AP-2 depleted cells first deprived of LDL by incubation with either serum-starved or LDL-starved cells for 24 hr. The LDL-deprived cells display a significant increase in endocytic structures enriched on deeply invaginated tubes that contain LDL and we suggest that under this condition of stress, LDL might enter through this alternative pathway.
Methods
Cells, plasmids, transfections and reagents BSC1 (BS-C-1; ATCC CCL-26) and HeLa (ATCC CCL-2) cells were grown at 37°C with 5% CO 2 and 100% humidity as adherent cells in DMEM supplemented with 10% fetal bovine serum (FBS). The generation and characterization of BSC1 and HeLa cell lines stably expressing EGFP-fusion chimeras of LCa or σ2 were described previously [3] , [12] . We have generated cell lines stably expressing CD8-LDLR (a gift from M. Robinson) by transfection with the plasmid (see below) followed by selection and maintenance with complete medium supplemented with geneticin (G418, 0.5–0.7 mg/ml). Transient transfections of Tomato-LCa (previously described in [12] ) on σ2-EGFP stable cell lines were carried out using FuGENE 6 (Roche Diagnostics, Indianapolis, IN) for HeLa cells and Lipofectamine 2000 (Invitrogen, Carlsbad, CA) for BSC1 cells and the cells were studied 24–48 h after. The following reagents were used: human transferrin labeled with Alexa Fluor 594 (Tf-A594) or Alexa Fluor 647 (Tf-A647), FM 1-43 (Molecular Probes, Eugene, OR); LDL-Cy5 was prepared by labeling LDL (a gift from Prof. Angelo Scanu, University of Chicago) with a Cy5-labelling kit (Molecular Probes, Eugene, OR or Amersham GE Healthcare, UK). The following antibodies were used: mouse monoclonal anti-human CD8 clone UCHT-4 (Sigma, Saint Louis, MO), mouse anti-actin (Sigma, Saint Louis MO), mouse anti μ2-adaptin (Transduction Laboratories) and mouse anti α-adaptin (BD Biosciences, San Jose CA). Small interfering RNA BSC1 or HeLa cells in 6-well plates were transfected using Oligofectamine (Invitrogen Carlsbad, CA) with 6 nM siRNA specific for μ2-adaptin [5] purchased from Dharmacon, Inc. (Lafayette, CO), followed by a second transfection 24 h later with 6 nM siRNA; experiments were conducted after an additional 48 interval (for Figure 1 ). Similar results were obtained when BSC1 or HeLa cells in 6-well plates were subjected to two successive transfections, performed 48 h apart, with 10 nM siRNA each time. Cells were plated on glass coverslips 36 h after the second transfection and studied 12 h after (for Figure 2 – 7 ). Control cells were treated equally but with no μ2 siRNA. 10.1371/journal.pone.0010597.g001 Figure 1 RNAi Depletion of AP-2. ( A , B ) Immunoblots of cell extracts from HeLa or BSC1 cells treated with for 72 h in presence or absence of μ2- siRNA oligos and probed with antibodies specific for μ2-adaptin, α-adaptin or β-actin (used as loading control). Serial dilutions (30 µl (100%), 15 µl (50%), 6 µl (20%) and 3 µl (10%)) of the control cell extracts were processed for western blots; 30 µl (100%) were used for 3 independent μ2-RNAi cell extracts. ( C , D ) Residual μ2-adaptin and α-adaptin in each cell type, obtained from three independent RNAi experiments. Each band was background-corrected, normalized to the corresponding intensity of the actin band, then expressed as percent of its value with respect to the 100% loading. 10.1371/journal.pone.0010597.g002 Figure 2 Effect of AP-2 depletion on the surface distribution of AP-2 and on the uptake of transferrin. ( A , B ) Control (-μ2 RNAi) and treated (+ μ2 RNAi) HeLa and BSC1 cells stably expressing σ2-EGFP were incubated at 37°C with 10 µg/ml of Tf-A594 for 10 min, followed by a quick rinse at 4°C to remove unbound transferrin, fixed with 3.7% PFA, and imaged in 3D with wide-field illumination. Representative views of the plane closest to the coverslip (σ2-EGFP) and of an equatorial plane (Tf) show a decrease in punctate σ2-EGFP signals at the cell membrane and inhibition of transferrin uptake. Insets correspond to representative boxed regions. Arrowheads mark the few remaining AP-2 spots in Tf-negative cells. Bar, 20 µm. ( C , D ) Histrograms showing the amount, relative to controls, of internalized transferrin obtained from the total fluorescence signal of Tf-A594 in the 3D stacks. The remaining signals were 11.9±6.9% ( p
📊 Figures
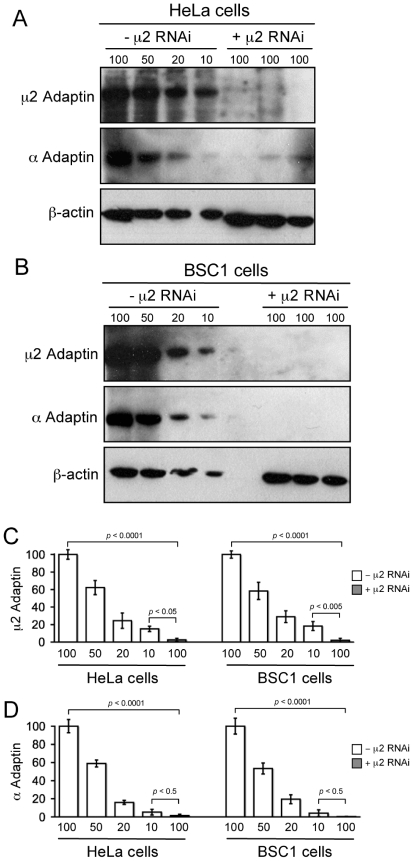
Figure 1
RNAi Depletion of AP-2.
( A , B ) Immunoblots of cell extracts from HeLa or BSC1 cells treated with for 72 h in presence or absence of u03bc2- siRNA oligos and probed with antibodies specific for u03bc2-adaptin, u03b1-adapti...
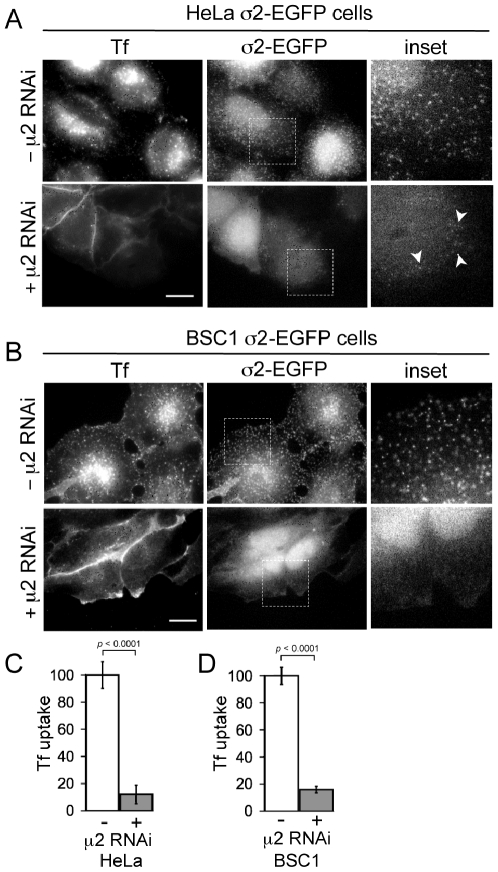
Figure 2
Effect of AP-2 depletion on the surface distribution of AP-2 and on the uptake of transferrin.
( A , B ) Control (-u03bc2 RNAi) and treated (+ u03bc2 RNAi) HeLa and BSC1 cells stably expressing u03c32-EGFP were incubated at 37u00b0C with 10 u00b5g/ml of Tf-A594 for 10 min, followed by a quick r...
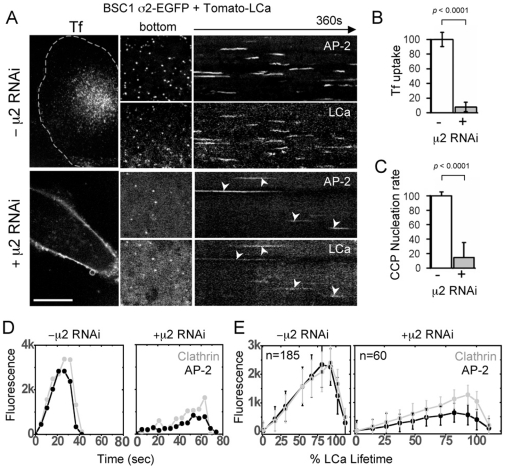
Figure 3
Effect of AP-2 depletion on the formation of clathrin-coated structures at the plasma membrane of BSC1 cells.
( A ) Time-series acquired with a spinning disk confocal microscope. The fluorescent assemblies were tagged with transiently expressed clathrin Tomato-LCa and with stably expressed AP-2 u03c32-EGFP in...
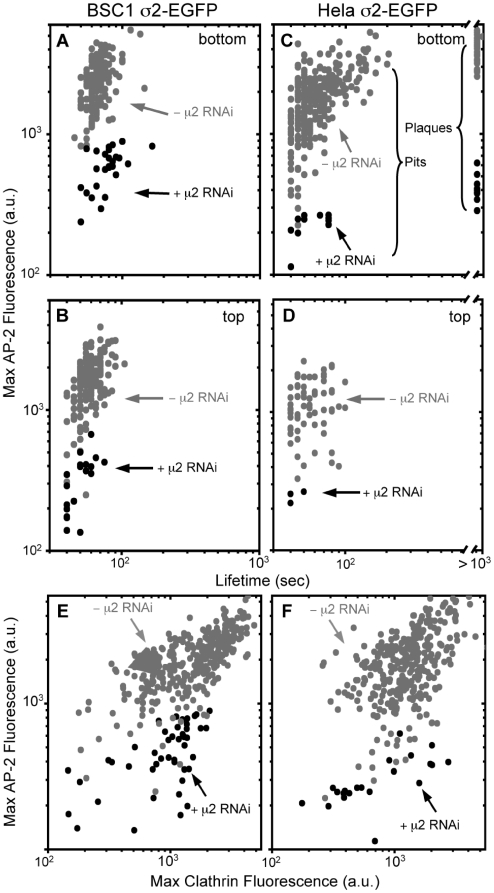
Figure 4
Effect of AP-2 depletion on sizes and lifetimes of clathrin-coats forming at the cell surface.
The double logarithmic plots show the maximum fluorescence intensity (prior to dissolution) and the lifetimes of every fluorescent spot containing clathrin and AP-2 recorded at the adhered (bottom) or...
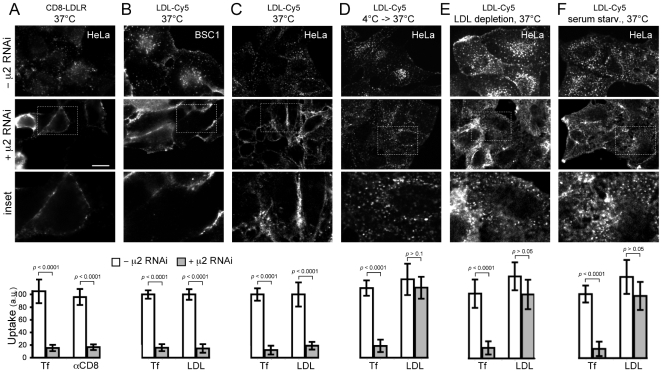
Figure 5
Effect of LDL or serum starvation and of low temperature on the inhibition of LDL uptake in cells depleted of AP-2.
Fluorescent 3D image stacks spanning the complete cell were obtained with a spinning disk confocal microscope; the middle plane is shown as a reference. Bar, 20 u00b5m. Insets correspond to representa...
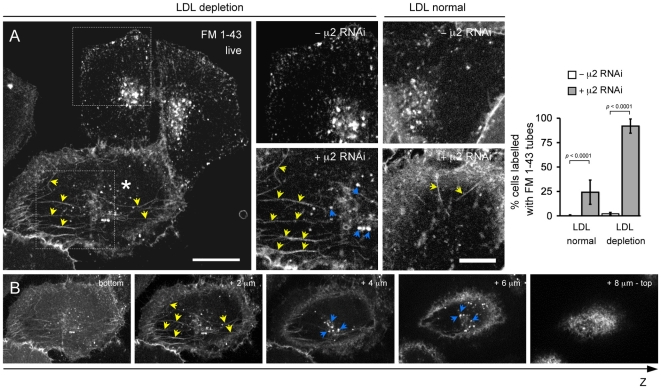
Figure 6
Enrichment of endocytic tubules labeled with FM 1-43 dye in HeLa cells depleted of AP-2 and LDL.
( A ) Effect of AP-2 depletion on the enrichment of tubular structures labeled with FM 1-43 fluorescent dye. The experiment was carried out on a mixture of HeLa cells depleted (+ u03bc2 RNAi) or not (...
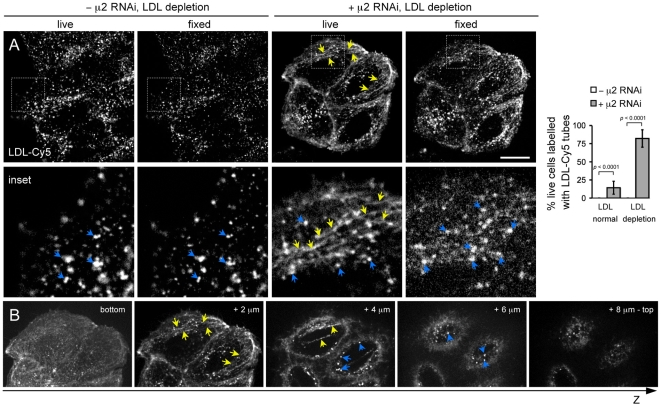
Figure 7
Enrichment of endocytic tubules labeled with LDL-Cy5 in HeLa cells depleted of AP-2 and LDL and their susceptibility to chemical fixation.
( A ) HeLa cells depleted (+ u03bc2 RNAi) or not (-u03bc2 RNAi) of AP-2 by treatment with u03bc2 RNAi were plated and incubated for 24 hrs in medium containing LDL-deficient serum (LDL depletion). The...
Figure images are served from the NIH/NLM PubMed Central Open Access Subset or Europe PMC; copyright remains with the publishers and authors.
💬 Discussion
0 commentsNo comments yet. Be the first to start a discussion!
Leave a Comment