Abstract
The super-resolution microscopy called RESOLFT relying on fluorophore switching between longlived states, stands out by its coordinate-targeted sequential sample interrogation using low light levels. While RESOLFT has been shown to discern nanostructures in living cells, the reversibly photoswitchable green fluorescent protein (rsEGFP) employed in these experiments was switched rather slowly and recording lasted tens of minutes. We now report on the generation of rsEGFP2 providing faster switching and the use of this protein to demonstrate 25-250 times faster recordings.DOI:http://dx.doi.org/10.7554/eLife.00248.001.
🔬 Techniques
🧬 Organisms
💻 Software
✨ Fluorophores
🧪 Sample Preparation
🔬 Cell Lines
🏭 Microscope Brands
🧪 Reagent Suppliers
💻 Software Details
📋 Protocols
🏛️ Research Organizations (ROR)
Affiliated research institutions:
📋 Methods
Mutagenesis
For site-directed mutagenesis, the QuikChange Site Directed Mutagenesis Kit (Stratagene, La Jolla, CA) or a multiple-site mutagenesis approach using several primers were used. Protein expression, purification and characterization The experimental procedures were essentially as described previously ( Grotjohann et al., 2011 ). In brief, proteins were expressed in the E. coli strain BL21-CP-RIL and purified by Ni-NTA affinity chromatography (His SpinTrap, GE Healthcare), according to the manufacturer's instructions. The purified proteins were concentrated by ultrafiltration and taken up in 100 mM Tris–HCl, 150 mM NaCl, pH 7.5. For the determination of the absorption, excitation and emission spectra of rsEGFP2, a protein solution (pH 7.5) was analyzed with a Varian Cary 4000 UV/VIS photospectrometer and a Varian Cary Eclipse fluorescence spectrometer, respectively. At this pH, the majority of the equilibrium-state rsEGFP2 chromophores are in the deprotonated cis-state (see Figure 1D ). To determine its emission spectrum, rsEGFP2 was excited at 460 nm; the excitation spectrum was determined by measuring fluorescence at 520 nm. The fluorescence quantum yields and the molar extinction coefficients at the respective absorption maximum were determined relative to the reported values of EGFP (quantum yield Φ FL = 0.60, molar extinction coefficient at 489 nm ε = 53,000 M −1 cm −1 ) ( Patterson et al., 1997 ). Irradiation-dependent changes in the absorption were quantified by illuminating the protein solution in a cuvette with a fiber coupled mercury lamp (Lecia Microsystems, Wetzlar, Germany) equipped with a (488 ± 5) nm excitation filter. For each measurement of the spectrum the irradiation was briefly interrupted. For the embedding of rsEGFP2 in a PAA layer, 24.5 µl of purified rsEGFP2 (~0.1 mM) was mixed with 17.5 µl Tris–HCl pH 7.5, 30 µl acrylamide (Rotiphorese Gel 30, Roth, Karlsruhe, Germany), 0.75 µl 10 % ammonium persulfate and 1µl 10 % TEMED. About 10 µl of this solution was placed on a glass slide and a cover slip was pressed onto the sample. After complete polymerization, the sample was sealed with silicon-based glue (Picodent twinsil, Picodent, Wipperfürth, Germany).
Show full methods section
Mutagenesis
For site-directed mutagenesis, the QuikChange Site Directed Mutagenesis Kit (Stratagene, La Jolla, CA) or a multiple-site mutagenesis approach using several primers were used. Protein expression, purification and characterization The experimental procedures were essentially as described previously ( Grotjohann et al., 2011 ). In brief, proteins were expressed in the E. coli strain BL21-CP-RIL and purified by Ni-NTA affinity chromatography (His SpinTrap, GE Healthcare), according to the manufacturer's instructions. The purified proteins were concentrated by ultrafiltration and taken up in 100 mM Tris–HCl, 150 mM NaCl, pH 7.5. For the determination of the absorption, excitation and emission spectra of rsEGFP2, a protein solution (pH 7.5) was analyzed with a Varian Cary 4000 UV/VIS photospectrometer and a Varian Cary Eclipse fluorescence spectrometer, respectively. At this pH, the majority of the equilibrium-state rsEGFP2 chromophores are in the deprotonated cis-state (see Figure 1D ). To determine its emission spectrum, rsEGFP2 was excited at 460 nm; the excitation spectrum was determined by measuring fluorescence at 520 nm. The fluorescence quantum yields and the molar extinction coefficients at the respective absorption maximum were determined relative to the reported values of EGFP (quantum yield Φ FL = 0.60, molar extinction coefficient at 489 nm ε = 53,000 M −1 cm −1 ) ( Patterson et al., 1997 ). Irradiation-dependent changes in the absorption were quantified by illuminating the protein solution in a cuvette with a fiber coupled mercury lamp (Lecia Microsystems, Wetzlar, Germany) equipped with a (488 ± 5) nm excitation filter. For each measurement of the spectrum the irradiation was briefly interrupted. For the embedding of rsEGFP2 in a PAA layer, 24.5 µl of purified rsEGFP2 (~0.1 mM) was mixed with 17.5 µl Tris–HCl pH 7.5, 30 µl acrylamide (Rotiphorese Gel 30, Roth, Karlsruhe, Germany), 0.75 µl 10 % ammonium persulfate and 1µl 10 % TEMED. About 10 µl of this solution was placed on a glass slide and a cover slip was pressed onto the sample. After complete polymerization, the sample was sealed with silicon-based glue (Picodent twinsil, Picodent, Wipperfürth, Germany).
Determination of chromophore maturation halftime
To determine the time required for chromophore maturation in rsEGFP2, the E. coli cell strain TOP10 (Invitrogen, Carlsbad, CA) was transformed with the inducible expression plasmid pBad-rsEGFP2 and grown overnight at 37°C in LB-Amp medium. The overnight culture was used to inoculate 200 ml LB-Amp growth medium. At an OD600 of 0.5 to 0.6, addition of arabinose to a final concentration of 0.2% induced the protein expression. The cultures were further incubated at 37°C for 2 hr. Cells were opened up by several freeze–thaw cycles and pelleted by centrifugation. rsEGFP2 was purified immediately from the supernatant using a His SpinTrap column (GE Healthcare, Freiburg, Germany). The proteins were diluted in buffer (final concentration: 20 mM NaH 2 PO 4 , 500 mM NaCl, 30 mM imidazol, pH 7.5). Care was taken that all preparation steps took place at 4°C. Finally, fluorescence emission spectra of rsEGFP2 were taken at several time points using a fluorescence spectrometer (Varian Cary Eclipse) while incubating the protein solution at 37°C. Mammalian cell culture PtK2 ( Potorous tridactylis ) cells were cultured under constant conditions at 37°C and 5% CO 2 in DMEM (Invitrogen, Carlsbad, CA) containing 5% FCS (PAA, Pasching, Austria), 100 units per ml streptomycin, 100 µg/ml penicillin (all Biochrom, Berlin, Germany), and 1 mM pyruvate (Sigma, St. Louis, USA ). For transfection, cells were seeded on cover glasses in 6-well plates. At the next day, cells were transfected with plasmid DNA using Nanofectin (PAA, Pasching, Austria) according to the manufacturer's instructions. After 24 hr the growth medium was replaced. Cells were imaged 24–72 hr after transfection.
Cloning
To generate the various fusion constructs of rsEGFP with Keratin19, with the histone H2B, with Vimentin, or with the peroxisomal membrane protein Pex16, rsEGFP was amplified (forward primer: GATCCACCGGTCGCGGCGTGAGCAAGGGCGAGGAGCTG/reverse primer: ACAACTTAAGAACAACAATTGTTACTTGTACAGCTCGTCCATGCC). The PCR fragment was cloned into the gateway destination vector pMD-tdEosFP-N using the restriction sites Age I and Afl II , thereby replacing the tdEosFP coding sequence against the rsEGFP2 sequence. The final plasmids pMD-Ker19-rsEGFP2, pMD-H2B-rsEGFP2, pMD-Vim-rsEGFP2 and pMD-Pex16-rsEGFP2 were constructed by gateway vector conversion (Invitrogen, Carlsbad, CA) using the donor vectors pDONR223-Krt19, pDONR223-Hist1H2BN, pDONR223-Vim and pDONR223-Pex16, respectively ( Lamesch et al., 2007 ). Pex16-rsEGFP was cloned accordingly. To generate pMD-rsEGFP2-α-Tubulin, rsEGFP2 was amplified (forward primer: GATCCGCTAGCGCTAATGGTGAGCAAGGGCGAGGAG/reverse primer: CACTCGAGATCTGAGTCCGGACTTGTACAGCTCGTCCATGCC) and cloned into the vector pEGFP-Tub (Clontech, Mountain View, CA) using the restriction sites Nhe I and Bgl II replacing EGFP. To generate a construct that targets rsEGFP2 to the ER, the rsEGFP2 sequence was PCR-amplified (forward primer: CTGCAGGTCGACATGGTGAGCAAGGGCGAGGA/reverse primer: TTCTG CGGCCGCCTTGTACAGCTCGTCCATGCCGCCGGT). The PCR product was ligated into the vector pEF/myc/ER (Invitrogen, Carlsbad, CA) using the Sal I and Not I restriction sites.
RESOLFT microscope
A home-built RESOLFT microscope ( Grotjohann et al., 2011 ; Testa et al., 2012 ) was adapted for imaging rsEGFP2 in living cells. The microscope utilized three separate beam paths for generating focal spots: two at 491 nm wavelength for excitation and off-switching and one at 405 nm for on-switching of the fluorophores. The two focal spots at 491 nm comprised: (i) a normal diffraction-limited focus with a Gaussian profile for reading out the fluorescence signal and (ii) a focus with a central intensity minimum (‘zero’) for off-switching at the focal periphery in the xy-plane, obtained by passing the beam through a vortex phase mask (463 nm mask, vortex plate VPP-A, RPC Photonics, Rochester, NY). The first two foci were both generated by the same laser diode (50 mW, Calypso 50, Cobolt, Stockholm, Sweden). The third focal spot, again with a normal diffraction-limited Gaussian profile, was generated by a laser diode at 405 nm wavelength (30 mW, BCL-030-405-S, CrystaLaser, Reno, NV, USA) and used for the on-switching of rsEGFP2. The microscope was equipped with a glycerol-immersion objective lens (PL APO, CORR CS, 63×, 1.3NA, glycerol; Leica Microsystems, Wetzlar, Germany). A piezo system (ENV40/20, Piezosystem Jena, Jena, Germany) was used to move the objective lens along the optical axis. A separate piezo stage (NV40, Piezosystem Jena) was implemented to translate the sample with nanometer precision in the xy-plane. The fluorescence signal was filtered by a band pass filter (532/70 nm) and detected by an avalanche photo diode (Perkin Elmer, Waltham, MA, USA); fluorescence photons were only allowed to be counted when the 491 nm read-out beam was switched on. The individual laser beam paths were triggered either by an acousto-optic modulator (MTS 130A3, Pegasus Optik GmbH, Wallenhorst, Germany) or by an acousto-optic tunable filter (AOTF.nC/TN, Pegasus Optik GmbH). The pulse sequence and duration were defined by a pulse generator (Model 9514, QUANTUM COMPOSERS, Bozeman, MT, USA) and triggered by a fast acquisition card (MCA-3 Series/P7882, FAST ComTec GmbH, Oberhaching, Germany) pixel by pixel. Alternatively, we assembled the Abberior RESOLFT Quad P microscopy kit provided by Abberior Instruments GmbH, Göttingen, Germany, which used the same arrangement and wavelengths as the home-built system, except for the fact that scanning was accomplished by a galvanometer beam scanning system (Quad scanner) and the body of the microscope was an Olympus iX81 inverted microscope. Imaging was performed with a 100× Olympus oil immersion objective lens of 1.4 numerical aperture.
Image acquisition and analysis
Image acquisition was performed with the software Imspector (www.imspector.de). Each image was recorded by applying a specific pulse scheme, pixel by pixel. The fluorescence signal was recorded only when the 491 nm read-out Gaussian shaped beam was on. Between each pixel pulse sequence (pixel dwell times 75–380 µs) a delay of 20 µs was inserted for synchronization, resulting in effective dwell times of 95–400 µs. The laser intensities used in our illumination scheme ranged between 1–100 kW/cm 2 . The approximately 10% remaining switching background introduces some diffraction-limited components in the final raw image. To remove this background, we deconvolved the final image by Richardson–Lucy ( Richardson, 1972 ; Lucy, 1974 ) restoration with a 10% diffraction-limited PSF added to the RESOLFT PSF, as detailed previously ( Hofmann et al., 2005 ). 10 iterations were performed. All experiments were performed at 35°C except those presented in Figure 3B and Figure 3—figure supplement 2 .
Determination of the single-molecule brightness
The single-molecule brightness of EGFP, rsEGFP and rsEGFP2 were determined using fluorescence fluctuation spectroscopy, specifically fluorescence correlation spectroscopy (FCS) ( Haustein and Schwille, 2003 ) and fluorescence intensity distribution analysis ( Chen et al., 1999 ; Kask et al., 1999 ). Both methods analyze characteristic fluctuations δF ( t ) in the fluorescence signal F ( t ) in time t about an average value F ( t ) = < F ( t )> + δF ( t ) by either calculating the second-order auto-correlation function G ( t c ) (FCS, with correlation time t c ) or by building up a frequency histogram P ( n , ∆ T ) of photon counts detected per time window ∆ T (FIDA, with number of photons n ). Fluctuations in F arise for example from diffusion of the fluorescent proteins in and out of the confocal detection volume or by transitions into and out of a dark state such as the triplet, other metastable dark or the switch-off state. FCS and FIDA data were analyzed using common theory. As outlined in detail previously ( Eggeling et al., 2007 ), the analysis most importantly resulted in three characteristic molecular parameters of the fluorescent proteins: the single-molecule brightness (or count-rate per particle) q (from FIDA measurements with ∆ T = 10 µs), the observation time τ obs (from FCS measurements), and the average population of a µs-long-lived dark state (probably the triplet state of the fluorophore, from FCS measurements). In Figure 1—figure supplement 2 the q values in relation to the normalized q value of EGFP are shown. Without saturating the excitation, the brightness q ~ Φ FL ε scales with the fluorescence quantum yield Φ FL and the extinction coefficient ε (compare Table 1 ). For EGFP, the observation time τ obs is given by its average transit time through the focal spot, while for rsEGFP and rsEGFP2 it is given by both the transit time and—if faster—the average switch-off time ( Eggeling et al., 2007 ). The fluorescence fluctuation data were recorded on a FCS reader (Insight, Inovation GmbH, Osnabrück, Germany), applying a water immersion objective (60× UPLSAPO, NA 1.2, Olympus, Japan). Data was recorded for different powers of the 491 nm excitation laser (Viper, Qioptiq, Hamble, UK) and for the fluorescent proteins in aqueous solution (PBS buffer, pH 7.5). The observation times τ obs were ~225 µs for EGFP (in accordance to the expected focal transit time), while those of rsEGFP and rsEGFP2 were shorter, reaching a value of ~40 µs at excitation powers >50 µW (15 kW/cm 2 ) for rsEGFP and ~10–15 µs for rsEGFP2. The shorter observation times in the case of rsEGFP and rsEGFP2 result from a fast population of >200 µs-lived dark states (for details see ( Eggeling et al., 2007 )).
📊 Figures
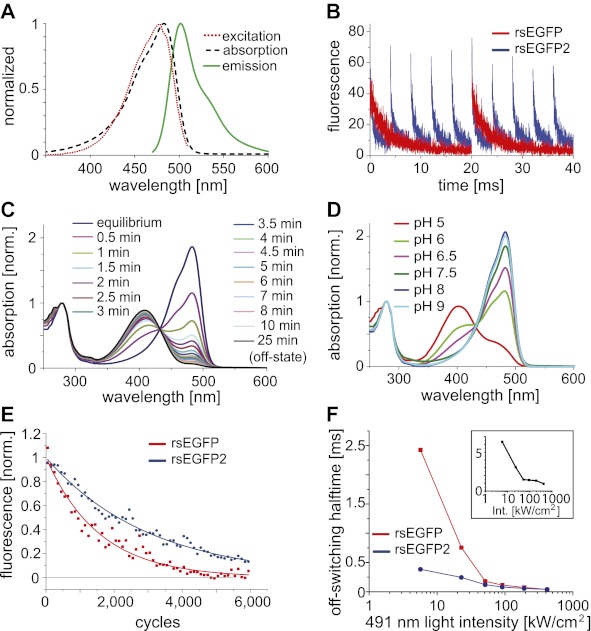
Figure 1.
Characteristics of rsEGFP2.
( A ) Absorption (black dashed line), excitation (red dotted line), and emission (green solid line) spectra of rsEGFP2 in its equilibrium state at pH 7.5. ( B ) Switching curves of rsEGFP2 (blue) and ...
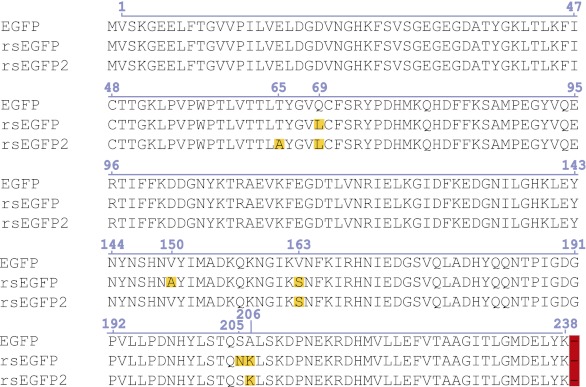
Figure 1u2014figure supplement 1.
Alignment of the amino acid sequences of EGFP (GenBank Accession # U55762 ), rsEGFP (GenBank Accession # JQ969017 ), and rsEGFP2.
Differences are highlighted. DOI: http://dx.doi.org/10.7554/eLife.00248.004
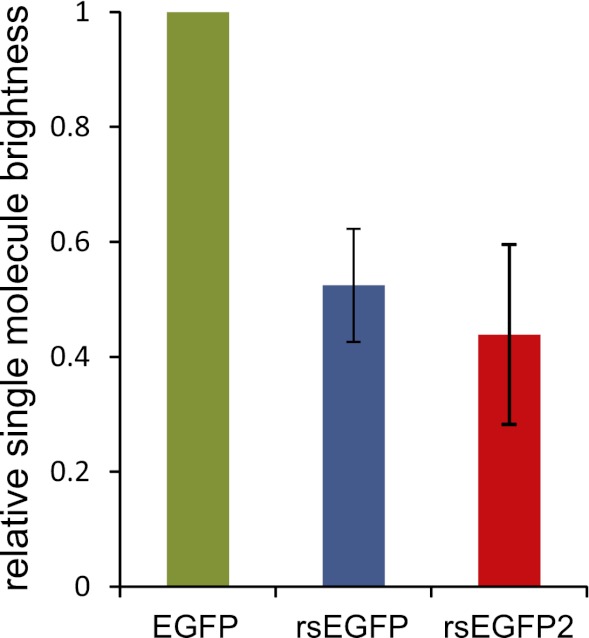
Figure 1u2014figure supplement 2.
Single-molecule brightness values of EGFP, rsEGFP, and rsEGFP2 measured in PBS buffer (pH 7.5).
Average and standard deviation of >30 FCS measurements at various laser intensities between 5 and 100 kW/cm 2 . Values normalized to EGFP. The error bars represent the error in the FCS experiments wit...
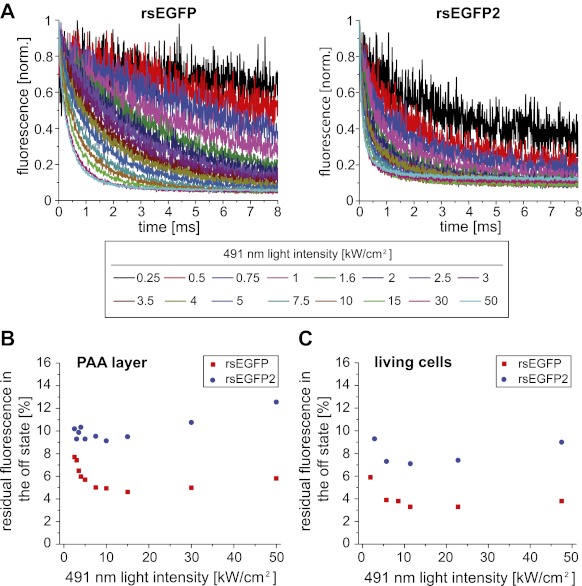
Figure 1u2014figure supplement 3.
Off-switching speed of rsEGFP and rsEGFP2.
( A ) Off-switching kinetics of rsEGFP and rsEGFP2 embedded in a PAA layer (pH ~6.5) determined at different intensities of the 491 nm off-switching light. Each curve is an average of 100 measurements...
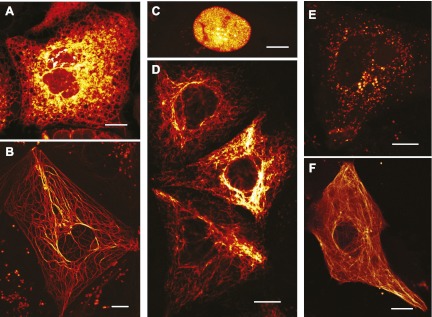
Figure 2.
Expression of various functional rsEGFP2 fusion proteins in mammalian cells.
( A ) rsEGFP2-KDEL (targeting to the ER), ( B ) Keratin19-rsEGFP2, ( C ) Histone H2B-rsEGFP2, ( D ) Vimentin-rsEGFP2, ( E ) Pex16-rsEGFP2, and ( F ) rsEGFP2-alpha-tubulin. Shown are single confocal se...
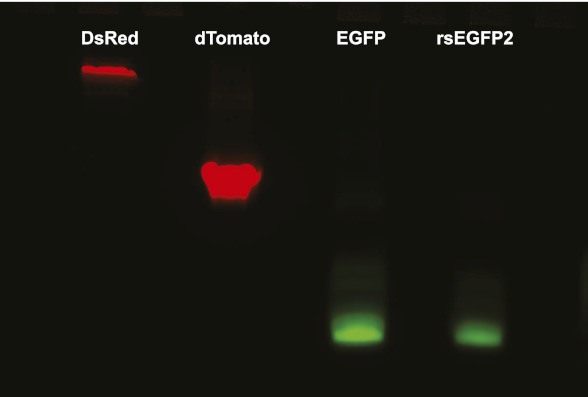
Figure 2u2014figure supplement 1.
Semi-native polyacrylamide gel electrophoresis of rsEGFP2.
Purified monomeric EGFP, dimeric dTomato, tetrameric DsRed, and rsEGFP2 were separated on a semi-native gel (a two-phase polyacrylamide gel) consisting out of a 12.5% separation gel (6.3 ml H 2 O, 5 m...
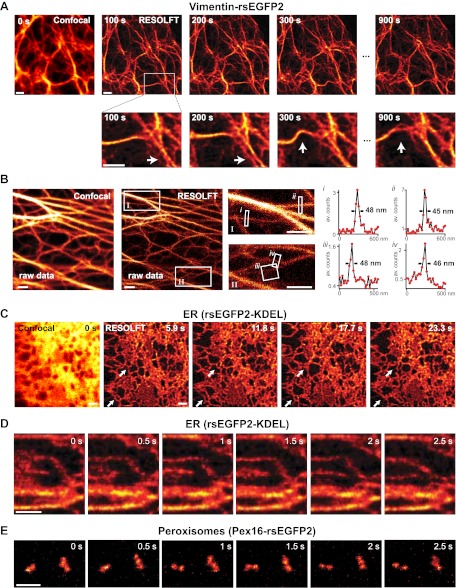
Figure 3.
RESOLFT time lapse imaging using rsEGFP2 in living mammalian PtK2 cells.
( A ) Cells expressing Vimentin-rsEGFP2: initial confocal (left) and subsequent RESOLFT images taken every 100 s. Lower row: magnifications of the indicated areas. ( B ) Lateral resolution measurement...
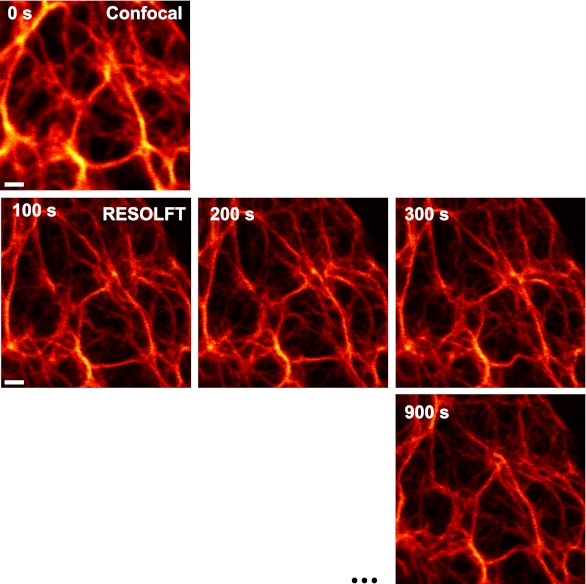
Figure 3u2014figure supplement 1.
Raw RESOLFT images of Figure 3A .
No image processing was applied. Shown are PtK2 cells expressing Vimentin-rsEGFP2: initial confocal (left) and subsequent RESOLFT images taken every 100 s. Scale bar: 1 u00b5m. DOI: http://dx.doi.org/...
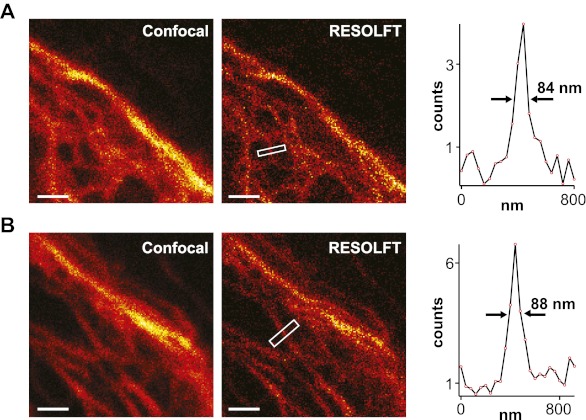
Figure 3u2014figure supplement 2.
Lateral resolution in fast RESOLFT imaging.
( A ),( B ) Typical examples. Shown are raw images of cells expressing Keratin19-rsEGFP2 taken on a RESOLFT Quad P microscope (Abberior Instruments GmbH, Gu00f6ttingen, Germany) with a pixel dwell tim...
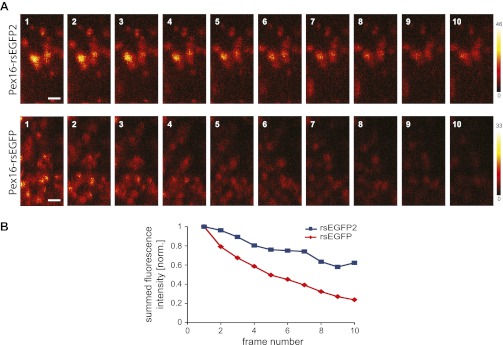
Figure 3u2014figure supplement 3.
Comparison of rsEGFP and rsEGFP2 at RESOLFT imaging conditions.
( A ) Repeated imaging of peroxisomes labeled by Pex16-rsEGFP or Pex16-EGFP2 fusion proteins. Imaging conditions were as in Figure 3D . Pixel step size: 40 nm; on: 405 nm, 4 kW/cm u00b2 , 20 u00b5s; o...
Movie 1.
Animated sequence of RESOLFT recordings of a living PtK2 cell expressing Vimentin-rsEGFP2 as shown in Figure 3A . 20 RESOLFT images were taken every 100 s. Image size: 10 u00b5m u00d7 10 u00b5m. The m...
Movie 2.
Animated sequence of RESOLFT recordings of a living PtK2 cell expressing rsEGFP2 targeted to the ER as shown in Figure 3D . 100 RESOLFT images were taken every 0.5 s. Image size: 2.8 u00b5m u00d7 3.2 ...
Movie 3.
Animated sequence of RESOLFT recordings of a living PtK2 cell expressing Pex16-rsEGFP2 to highlight the peroxisomes as shown in Figure 3E . 20 RESOLFT images were taken every 0.5 s. Image size: 3 u00b...
Figure images are served from the NIH/NLM PubMed Central Open Access Subset or Europe PMC; copyright remains with the publishers and authors.
💬 Discussion
0 commentsNo comments yet. Be the first to start a discussion!
Leave a Comment