Abstract
AIMS: In atrial fibrillation (AF), abnormalities in Ca(2+) release contribute to arrhythmia generation and contractile dysfunction. We explore whether ryanodine receptor (RyR) cluster ultrastructure is altered and is associated with functional abnormalities in AF. METHODS AND RESULTS: Using high-resolution confocal microscopy (STED), we examined RyR cluster morphology in fixed atrial myocytes from sheep with persistent AF (N = 6) and control (Ctrl; N = 6) animals. RyR clusters on average contained 15 contiguous RyRs; this did not differ between AF and Ctrl. However, the distance between clusters was significantly reduced in AF (288 ± 12 vs. 376 ± 17 nm). When RyR clusters were grouped into Ca(2+) release units (CRUs), i.e. clusters separated by 50% higher spark frequency with increased spark time to peak (TTP) and duration, and a higher incidence of macrosparks. A computational model of the CRU was used to simulate the morphological alterations observed in AF cells. Increasing cluster fragmentation to the level observed in AF cells caused the observed changes, i.e. higher spark frequency, increased TTP and duration; RyR clusters dispersed between Z-lines increased the occurrence of macrosparks. CONCLUSION: In persistent AF, ultrastructural reorganization of RyR clusters within CRUs is associated with overactive Ca(2+) release, increasing the likelihood of propagating Ca(2+) release.
🔬 Techniques
✨ Fluorophores
🧪 Sample Preparation
🏭 Microscope Brands
💻 Software Details
🏛️ Research Organizations (ROR)
Affiliated research institutions:
📋 Methods
Methods and results Using high-resolution confocal microscopy
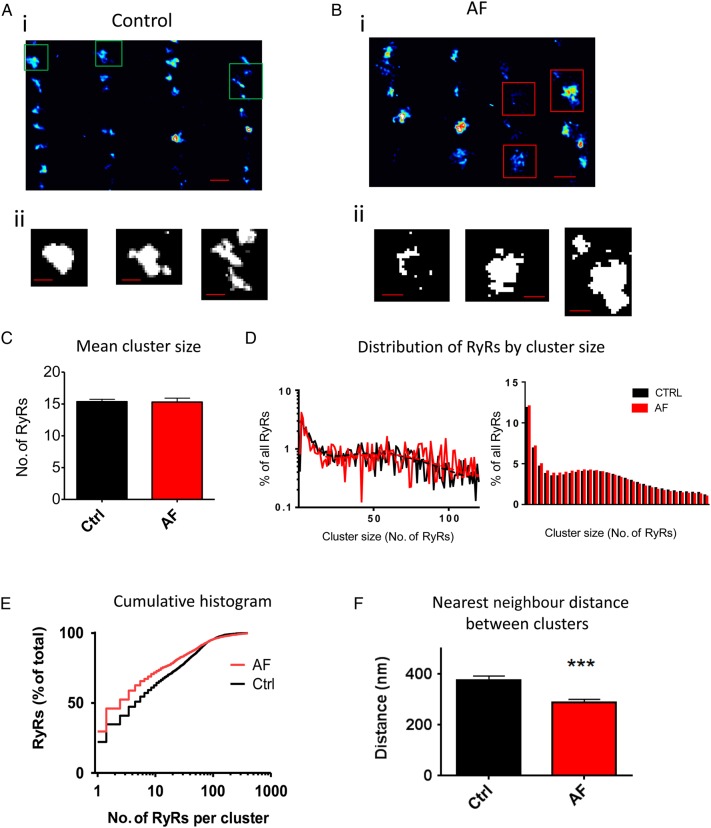
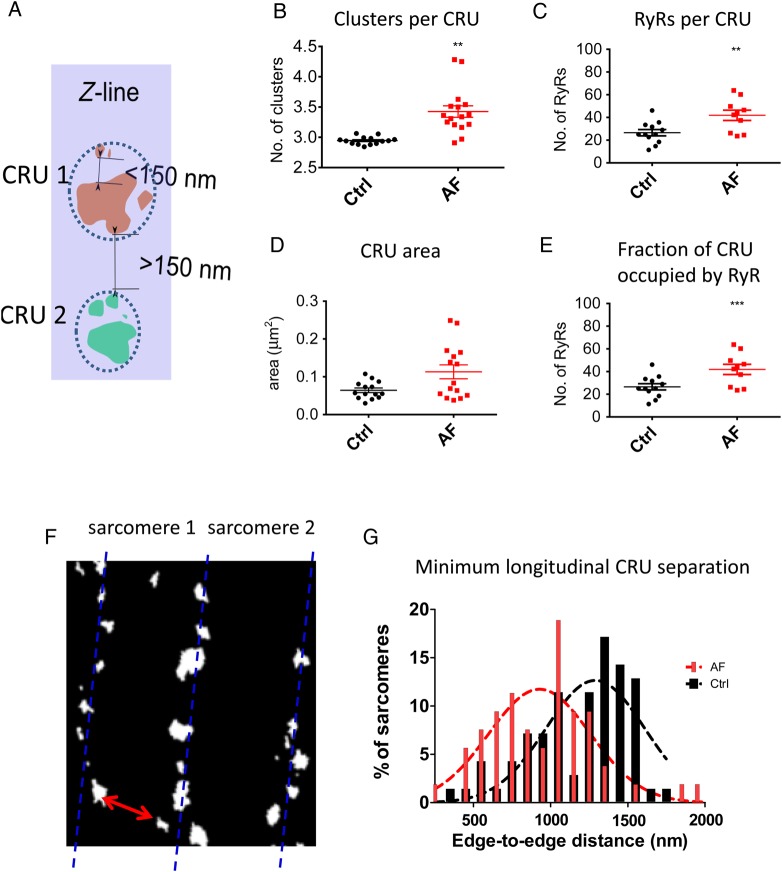
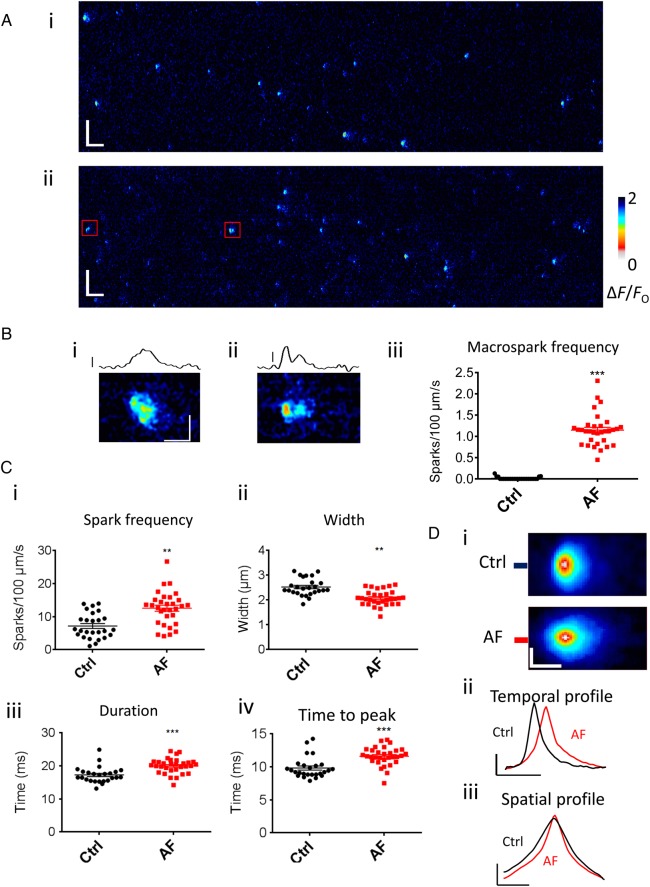
(STED), we examined RyR cluster morphology in fixed atrial myocytes from sheep with persistent AF ( N = 6) and control (Ctrl; N = 6) animals. RyR clusters on average contained 15 contiguous RyRs; this did not differ between AF and Ctrl. However, the distance between clusters was significantly reduced in AF (288 ± 12 vs. 376 ± 17 nm). When RyR clusters were grouped into Ca 2+ release units (CRUs), i.e. clusters separated by 50% higher spark frequency with increased spark time to peak (TTP) and duration, and a higher incidence of macrosparks. A computational model of the CRU was used to simulate the morphological alterations observed in AF cells. Increasing cluster fragmentation to the level observed in AF cells caused the observed changes, i.e. higher spark frequency, increased TTP and duration; RyR clusters dispersed between Z -lines increased the occurrence of macrosparks.
2.
Methods
A detailed description is available in the Supplementary material online . The sheep model and atrial myocyte isolation were as described before. 9 For STED microscopy, myocytes were fixed immediately after isolation in 2% paraformaldehyde. Fixed myocytes were labelled with a primary RyR2 antibody and Alexa 647N secondary. Samples were imaged on a custom-built STED microscope 21 (see Supplementary material online, Figure S1 ) and analysed using custom software written in Python. Ca 2+ sparks were measured in permeabilized myocytes perfused with a mock intracellular solution containing Fluo-3 (20 µmol/L) with a free Ca 2+ of 150 nmol/L. Ca 2+ sparks were analysed using custom software based on the Cheng algorithm. 22 Computer modelling of Ca 2+ release was based on a modified version of a previous model 23 using an Ultrafast Monte Carlo method, with the inclusion of localized RyR Ca 2+ -sensing domain. Data are presented as mean ± SEM for RyR clusters and otherwise as scatter plots for individual cells. To include both N animals and n cells in the analysis, a hierarchical method was used.
Show full methods section
Methods and results Using high-resolution confocal microscopy
(STED), we examined RyR cluster morphology in fixed atrial myocytes from sheep with persistent AF ( N = 6) and control (Ctrl; N = 6) animals. RyR clusters on average contained 15 contiguous RyRs; this did not differ between AF and Ctrl. However, the distance between clusters was significantly reduced in AF (288 ± 12 vs. 376 ± 17 nm). When RyR clusters were grouped into Ca 2+ release units (CRUs), i.e. clusters separated by 50% higher spark frequency with increased spark time to peak (TTP) and duration, and a higher incidence of macrosparks. A computational model of the CRU was used to simulate the morphological alterations observed in AF cells. Increasing cluster fragmentation to the level observed in AF cells caused the observed changes, i.e. higher spark frequency, increased TTP and duration; RyR clusters dispersed between Z -lines increased the occurrence of macrosparks.
2.
Methods
A detailed description is available in the Supplementary material online . The sheep model and atrial myocyte isolation were as described before. 9 For STED microscopy, myocytes were fixed immediately after isolation in 2% paraformaldehyde. Fixed myocytes were labelled with a primary RyR2 antibody and Alexa 647N secondary. Samples were imaged on a custom-built STED microscope 21 (see Supplementary material online, Figure S1 ) and analysed using custom software written in Python. Ca 2+ sparks were measured in permeabilized myocytes perfused with a mock intracellular solution containing Fluo-3 (20 µmol/L) with a free Ca 2+ of 150 nmol/L. Ca 2+ sparks were analysed using custom software based on the Cheng algorithm. 22 Computer modelling of Ca 2+ release was based on a modified version of a previous model 23 using an Ultrafast Monte Carlo method, with the inclusion of localized RyR Ca 2+ -sensing domain. Data are presented as mean ± SEM for RyR clusters and otherwise as scatter plots for individual cells. To include both N animals and n cells in the analysis, a hierarchical method was used.
Supplementary material Supplementary material is available at Cardiovascular Research online.
📊 Figures
Figureu00a01
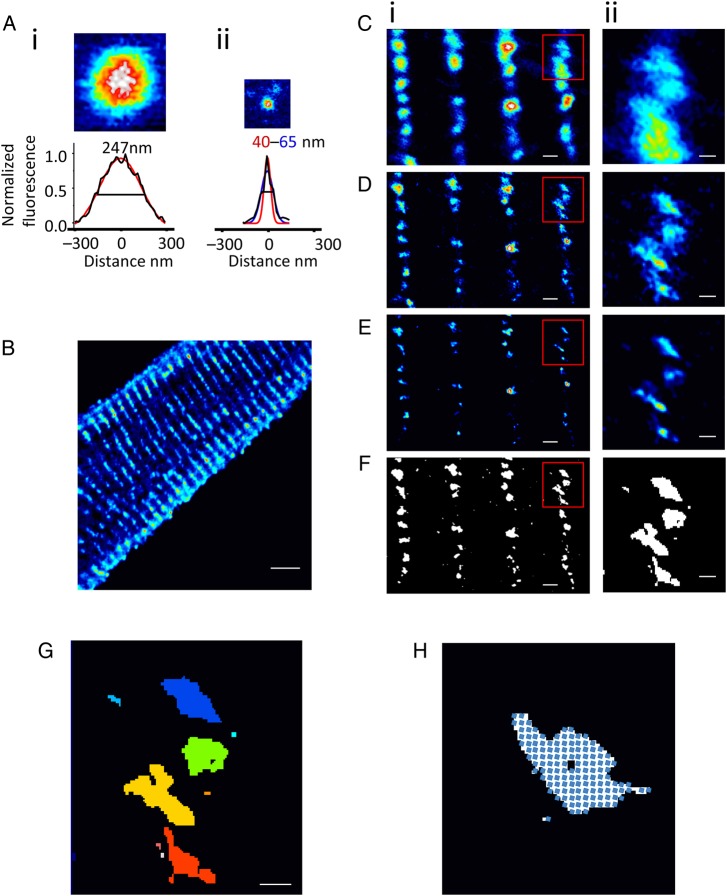
Deconvolved STED microscopy resolves RyR sub-cluster formations in atrial myocytes. ( A ) Average of the same three fluorescent beads aligned on their peaks from confocal (i) and STED (ii) recordings,...
Figureu00a02
Quantification of RyR cluster size. ( A and B ) Typical deconvolved STED (i) and thresholded STED (ii) from Ctrl and AF cells; scale bars: upper panel 500 nm, lower 200 nm. ( C ) Mean RyR cluster size...
Figureu00a03
Quantification of alterations of CRU morphology and separation in AF. ( A ) Criteria for cluster grouping within CRUs defined as functionally grouped clusters if within the 150 nm edge to edge of each...
Figureu00a04
More frequent Ca 2+ sparks, with slowed kinetics in permeabilized AF myocytes. ( A ) Examples of line scan images of spark recording in Ctrl (i) and AF (ii); rectangles highlight macrosparks. ( B ) Ex...
Figureu00a05
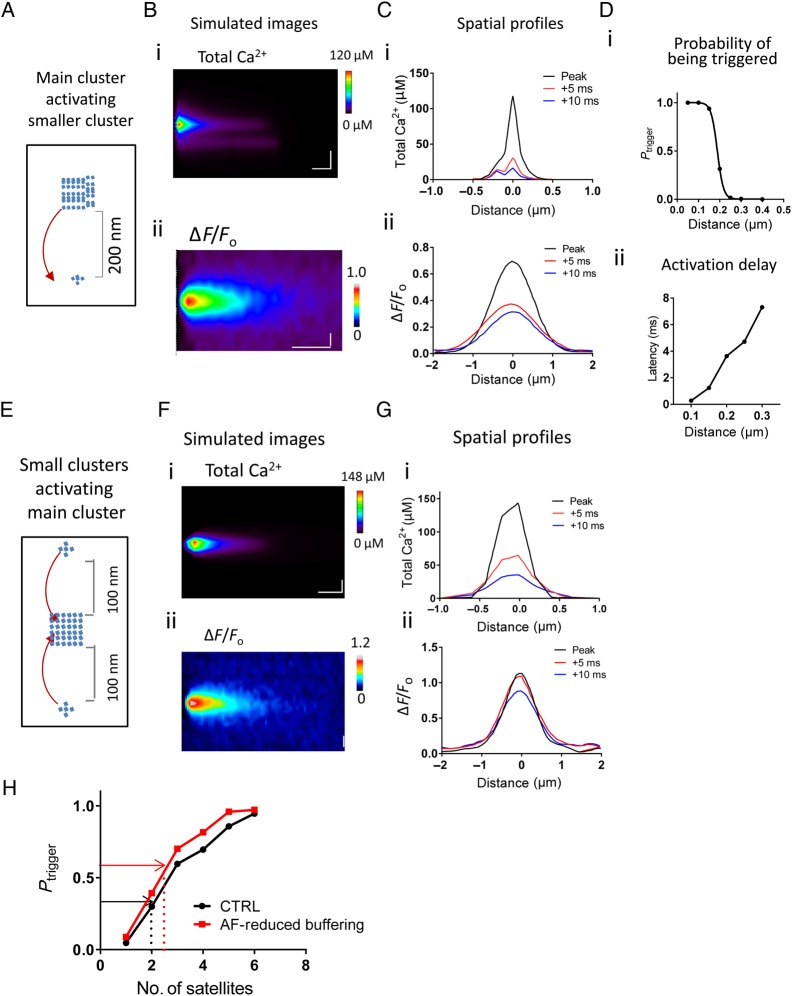
Computational modelling of intra-CRU RyR interaction. ( A ) Schematic of model for simulation: release from one large RyR cluster within the CRU can activate the smaller RyR cluster by the diffusion o...
Figureu00a06
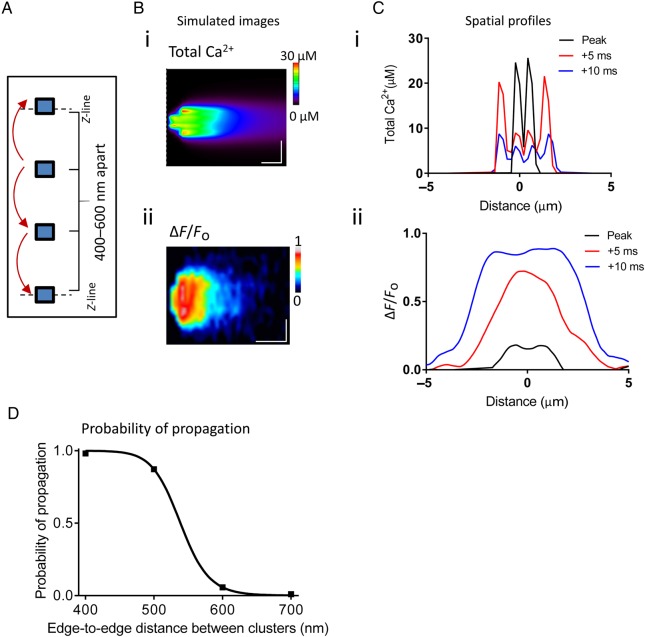
Simulation of neighbouring cluster activation during a macrospark. ( A ) Schematic of the model: four clusters, each with one central 25 RyR cluster and three clusters with 5 RyR, placed at variable e...
Figure images are served from the NIH/NLM PubMed Central Open Access Subset or Europe PMC; copyright remains with the publishers and authors.
💬 Discussion
0 commentsNo comments yet. Be the first to start a discussion!
Leave a Comment