Abstract
Reduced cardiac contractility during heart failure (HF) is linked to impaired Ca 2+ release from Ryanodine Receptors (RyRs). We investigated whether this deficit can be traced to nanoscale RyR reorganization. Using super-resolution imaging, we observed dispersion of RyR clusters in cardiomyocytes from post-infarction HF rats, resulting in more numerous, smaller clusters. Functional groupings of RyR clusters which produce Ca 2+ sparks (Ca 2+ release units, CRUs) also became less solid. An increased fraction of small CRUs in HF was linked to augmented ‘silent’ Ca 2+ leak, not visible as sparks. Larger multi-cluster CRUs common in HF also exhibited low fidelity spark generation. When successfully triggered, sparks in failing cells displayed slow kinetics as Ca 2+ spread across dispersed CRUs. During the action potential, these slow sparks protracted and desynchronized the overall Ca 2+ transient. Thus, nanoscale RyR reorganization during HF augments Ca 2+ leak and slows Ca 2+ release kinetics, leading to weakened contraction in this disease.
🔬 Techniques
🧬 Organisms
✨ Fluorophores
🧪 Sample Preparation
🏭 Microscope Brands
🧪 Reagent Suppliers
📷 Detectors
🔎 Objectives
🎨 Filters
💻 Software Details
💻 Code & Software
📂💾 Data Repositories
🏷️ Research Resource Identifiers (RRIDs)
Verified research resources used in this paper:
🏛️ Research Organizations (ROR)
Affiliated research institutions:
📋 Methods
Key resources table
Reagent type (species) or resource Designation Source or reference Identifiers Additional information Strain, strain background ( Rattus norvegicus , M) Male Wistar- Hannover rats Janvier-labs RjHan: WI; RGD: 13792727 Antibody Mouse-anti-RyR2 primary antibody ThermoFischer Scientific Cat# MA3-916; RRID: AB_2183054 IHC, 1:100; WB, 1:1000 Antibody Alexa Fluo 647 conjugated goat-anti-mouse secondary Ab Molecular Probes/Invitrogen Cat# A-21237; RRID: AB_2535806 IHC, 1:200 Antibody Anti-goat IgG-HRP linked whole antibody R and D Systems Cat# HAF109; RRID: AB_357236 WB, 1:3000 Antibody Mouse IgG HRP linked Whole Ab GE Healthcare Cat# NA931V; RRID: AB_772210 WB, 1:3000 Antibody Rabbit IgG HRP linked Whole Ab GE Healthcare Cat# NA934V; RRID: AB_772206 WB, 1:3000 Antibody Goat Anti-GAPDH Polyclonal antibody Santa Cruz Biotechnology Cat# sc-20357; RRID: AB_641107 WB, 1:500 Antibody Goat Anti- Junctophilin-2 Polyclonal Antibody Santa Cruz Biotechnology Cat# sc-51313; RRID: AB_2296391 WB, 1:1000 Antibody BIN1 (Amphiphysin II (2F11) Antibody) Santa Cruz Biotechnology Cat# sc-23918; RRID: AB_667901 WB, 1:500 Software, algorithm Dense Stochastic Sampling Imaging (DSSI) algorithm SoftWoRx, GE Healthcare Software, algorithm dSTORM image post-processing algorithm PMID: 26490742 Described in the Github repository ( Kolstad, 2018 ; copy archived at https://github.com/elifesciences-publications/Ryanodine_Receptor_Dispersion_during_Heart_Failure ) Software, algorithm Mathematical Model PMID: 22495592 ; PMID: 23708355 ; this paper Described in the Github repository ( Kolstad, 2018 ; copy archived at https://github.com/elifesciences-publications/Ryanodine_Receptor_Dispersion_during_Heart_Failure ) Software, algorithm SigmaPlot SigmaPlot RRID: SCR_003210 Rat model of post-myocardial infarction congestive HF All experiments were approved by the Norwegian National Animal Research Authority (project license no. FOTS 5982, 7786), and were performed in accordance with the National Institute of Health guidelines (NIH publication No. 85 – 23, revised 2011) and European Directive 2010/63/EU. Large anterolateral myocardial infarctions were induced in ~300 g male Wistar-Hannover rats, by ligation of the left coronary artery as previously described ( Lunde et al., 2012 ). Development of HF was verified six weeks later using a Vevo 2100 echocardiography imaging system (VisualSonics, Toronto, Canada). Inclusion of failing animals was based on established criteria ( Sjaastad et al., 2000 ), including dilation of the left atrium (diameter >5 mm) and ventricle, and increased lung weight (>2.5 g). Sham-operated rats served as controls. Experiments were performed over a two year period, using animals from 10 rounds of animal surgery. Sample sizes were determined by power analysis, assuming that only 50% of post-infarction animals would be included in the final data set, and based on a pilot project of variability in CRU morphology in healthy controls.
Show full methods section
Key resources table
Reagent type (species) or resource Designation Source or reference Identifiers Additional information Strain, strain background ( Rattus norvegicus , M) Male Wistar- Hannover rats Janvier-labs RjHan: WI; RGD: 13792727 Antibody Mouse-anti-RyR2 primary antibody ThermoFischer Scientific Cat# MA3-916; RRID: AB_2183054 IHC, 1:100; WB, 1:1000 Antibody Alexa Fluo 647 conjugated goat-anti-mouse secondary Ab Molecular Probes/Invitrogen Cat# A-21237; RRID: AB_2535806 IHC, 1:200 Antibody Anti-goat IgG-HRP linked whole antibody R and D Systems Cat# HAF109; RRID: AB_357236 WB, 1:3000 Antibody Mouse IgG HRP linked Whole Ab GE Healthcare Cat# NA931V; RRID: AB_772210 WB, 1:3000 Antibody Rabbit IgG HRP linked Whole Ab GE Healthcare Cat# NA934V; RRID: AB_772206 WB, 1:3000 Antibody Goat Anti-GAPDH Polyclonal antibody Santa Cruz Biotechnology Cat# sc-20357; RRID: AB_641107 WB, 1:500 Antibody Goat Anti- Junctophilin-2 Polyclonal Antibody Santa Cruz Biotechnology Cat# sc-51313; RRID: AB_2296391 WB, 1:1000 Antibody BIN1 (Amphiphysin II (2F11) Antibody) Santa Cruz Biotechnology Cat# sc-23918; RRID: AB_667901 WB, 1:500 Software, algorithm Dense Stochastic Sampling Imaging (DSSI) algorithm SoftWoRx, GE Healthcare Software, algorithm dSTORM image post-processing algorithm PMID: 26490742 Described in the Github repository ( Kolstad, 2018 ; copy archived at https://github.com/elifesciences-publications/Ryanodine_Receptor_Dispersion_during_Heart_Failure ) Software, algorithm Mathematical Model PMID: 22495592 ; PMID: 23708355 ; this paper Described in the Github repository ( Kolstad, 2018 ; copy archived at https://github.com/elifesciences-publications/Ryanodine_Receptor_Dispersion_during_Heart_Failure ) Software, algorithm SigmaPlot SigmaPlot RRID: SCR_003210 Rat model of post-myocardial infarction congestive HF All experiments were approved by the Norwegian National Animal Research Authority (project license no. FOTS 5982, 7786), and were performed in accordance with the National Institute of Health guidelines (NIH publication No. 85 – 23, revised 2011) and European Directive 2010/63/EU. Large anterolateral myocardial infarctions were induced in ~300 g male Wistar-Hannover rats, by ligation of the left coronary artery as previously described ( Lunde et al., 2012 ). Development of HF was verified six weeks later using a Vevo 2100 echocardiography imaging system (VisualSonics, Toronto, Canada). Inclusion of failing animals was based on established criteria ( Sjaastad et al., 2000 ), including dilation of the left atrium (diameter >5 mm) and ventricle, and increased lung weight (>2.5 g). Sham-operated rats served as controls. Experiments were performed over a two year period, using animals from 10 rounds of animal surgery. Sample sizes were determined by power analysis, assuming that only 50% of post-infarction animals would be included in the final data set, and based on a pilot project of variability in CRU morphology in healthy controls.
Cell isolation
Cardiac myocytes from failing and Sham-operated rats were isolated using a standard enzymatic dispersion technique ( Louch et al., 2011 ). Excised hearts were mounted on a Langendorff setup, and retrogradely perfused through the aorta with Ca 2+ -free solution containing (in mmol/L): 130 NaCl, 25 Hepes, 5.4 KCl, 0.5 MgCl 2 , 0.4 NaH 2 PO 4 , 5.5 D-glucose, pH 7.4. Once cleared of blood, hearts were then perfused with the above solution including collagenase (2 mg/mL, Worthington Biochemical Corp., Lakewood, NJ, USA) and low [Ca 2+ ] (0.05 mmol/L). After 10 min of digestion, hearts were cut down, minced, and filtered, and isolated cardiomyocytes were allowed to sediment. Immunostaining Isolated cardiomyocytes were transferred to cell culture medium (DMEM 1X, Life Technologies with 10% FBS, Biowest Nuaillé, France and 1% Penicillin-Streptomycin, Sigma), and plated on laminin-coated, glass bottom culture dishes (MatTek corporation, Ashland MA). Staining was performed according to a described protocol ( Swift et al., 2007 ), with consecutive steps for chemical fixation (4% Formaldehyde in 1 mol/L HEPES buffer, 10 min), quenching (PBS + 100 mmol/L Glycine, 10 min), permeabilization (PBS + 0,03% Triton X-100, 10 min), and blocking (NaCl 150 mmol/L, Na 3 citrate 17.5 mmol/L, 5% goat serum, 3% BSA, 0.02% NaN 3 , 2 hr). PBS washing was performed in between each step. The cells were then incubated overnight with 1/100 diluted mouse-anti-RyR2 primary antibody (ThermoFischer Scientific, MA3–916) in low blocking buffer, containing 150 mmol/L NaCl, 17.5 mmol/L Na 3 citrate, 2% goat serum, 1% BSA, and 0.02% NaN 3 at 4°C. This protocol has previously been reported to result in the binding of multiple primary antibodies to each RyR tetramer ( Baddeley et al., 2009 ). The following day, cells were washed with PBS and incubated with 1/200 diluted secondary antibody (Alexa Fluo 647 conjugated goat-anti-mouse secondary Ab, Molecular Probes/Invitrogen) in low blocking buffer for 2 hr. Cells were then washed and stored in PBS until image acquisition. Of note, the fab-fragment secondary antibody employed places the fluorescent label far closer to the epitope than traditional antibodies. Thus, under our experimental conditions, the steric error is generally half the area of a 30 nm square was above threshold, and RyR clusters were defined by occupied, neighbouring grid positions. Based on previous ( Macquaide et al., 2015 ) and present ( Figure 4—figure supplement 1 ) calculations clusters with edge-to-edge distance
📊 Figures
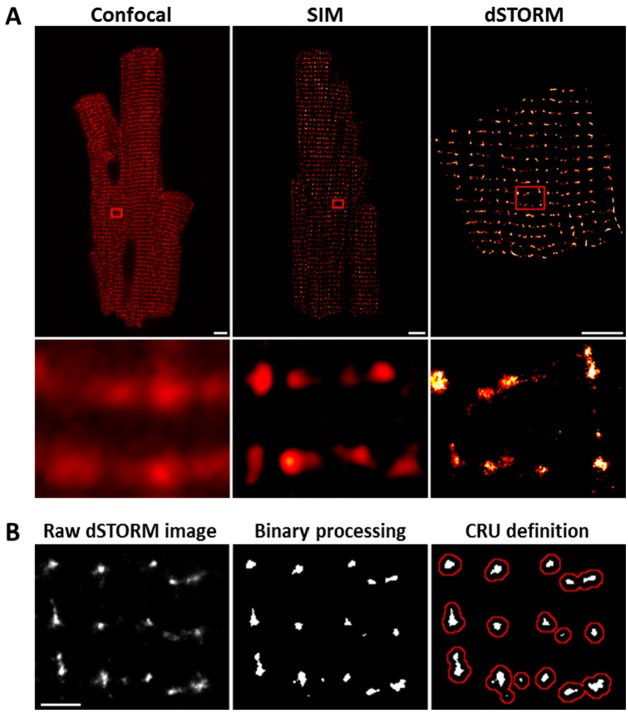
Figure 1.
dSTORM imaging enables quantification of RyR localization within Ca 2+ release units (CRUs).
RyR imaging was performed with antibody labelling of isolated and fixed rat ventricular cardiomyocytes. ( A ). Imaging of RyRs with confocal microscopy (left panel) or Structured Illumination Microsco...
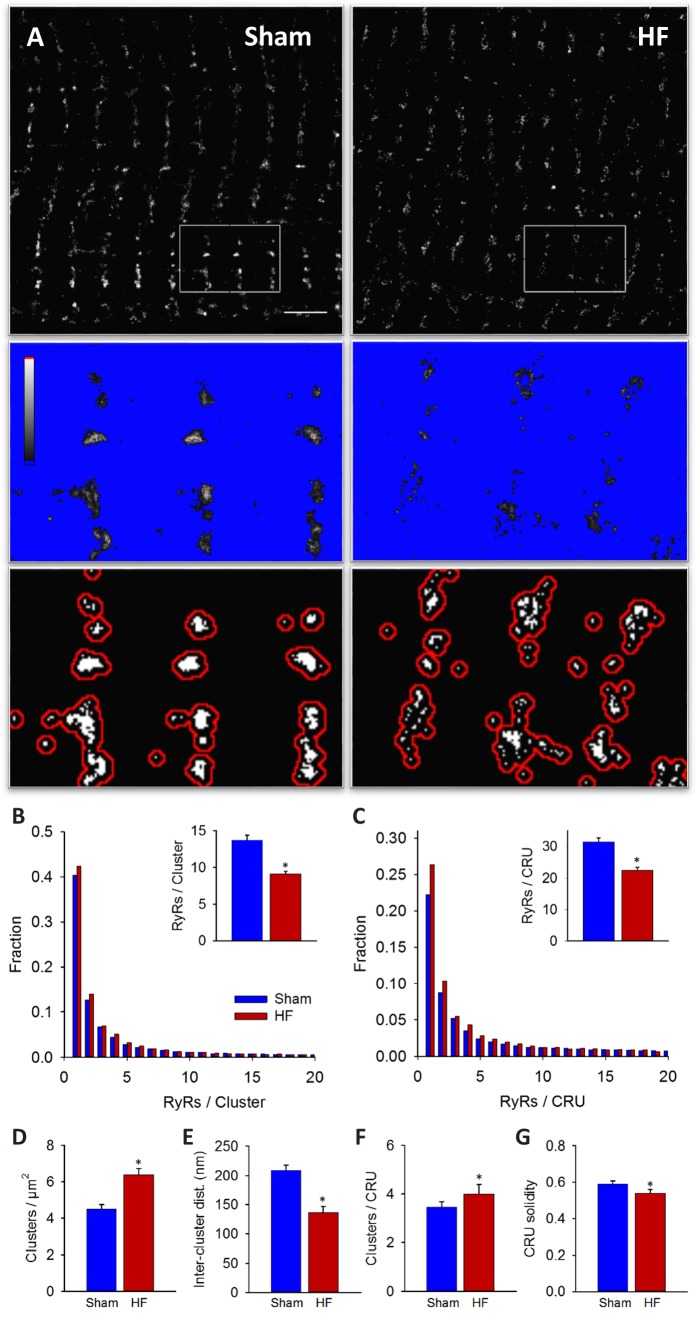
Figure 2.
RyRs are dispersed in failing cardiomyocytes.
Alterations in nanoscale RyR organization were examined in cardiomyocytes from rats with post-infarction heart failure (HF). Representative images show that macroscale organization of RyRs was similar...
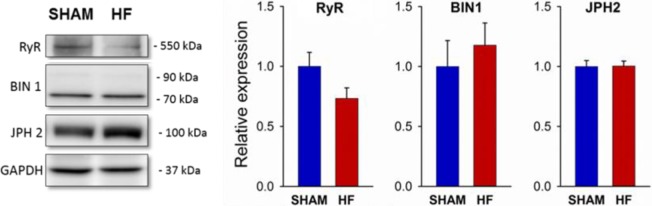
Figure 2u2014figure supplement 1.
HF in post-infarction rats is not associated with altered expression of RyR, BIN1, or Junctophilin-2.
Western blotting was performed on homogenates of left ventricles from post-MI HF rats and Sham-operated controls. Representative immunoblots are shown at left, with mean values at right, normalized to...
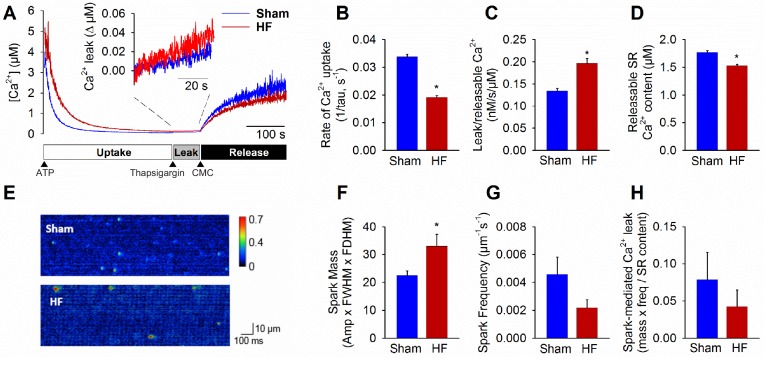
Figure 3.
Failing cardiomyocytes exhibit increased u2018silentu2019 RyR leak.
Total RyR-mediated Ca 2+ leak was assessed in SR microsomes using fura-2 fluorescence ( A ). Vesicular Ca 2+ uptake was initiated by addition of ATP, and halted by addition of thapsigargin. SR Ca 2+ l...
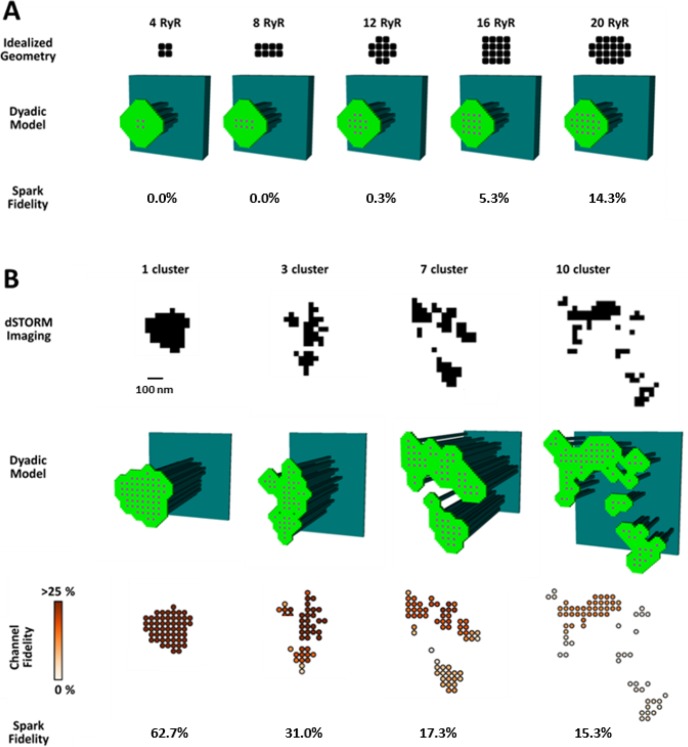
Figure 4.
CRU dispersion provides the structural basis for silent RyR leak in HF.
A mathematical model of the dyad was employed to examine the effects of CRU dispersion on Ca 2+ sparks and non-spark mediated RyR leak. ( A ). As dSTORM imaging indicated an increased fraction of smal...
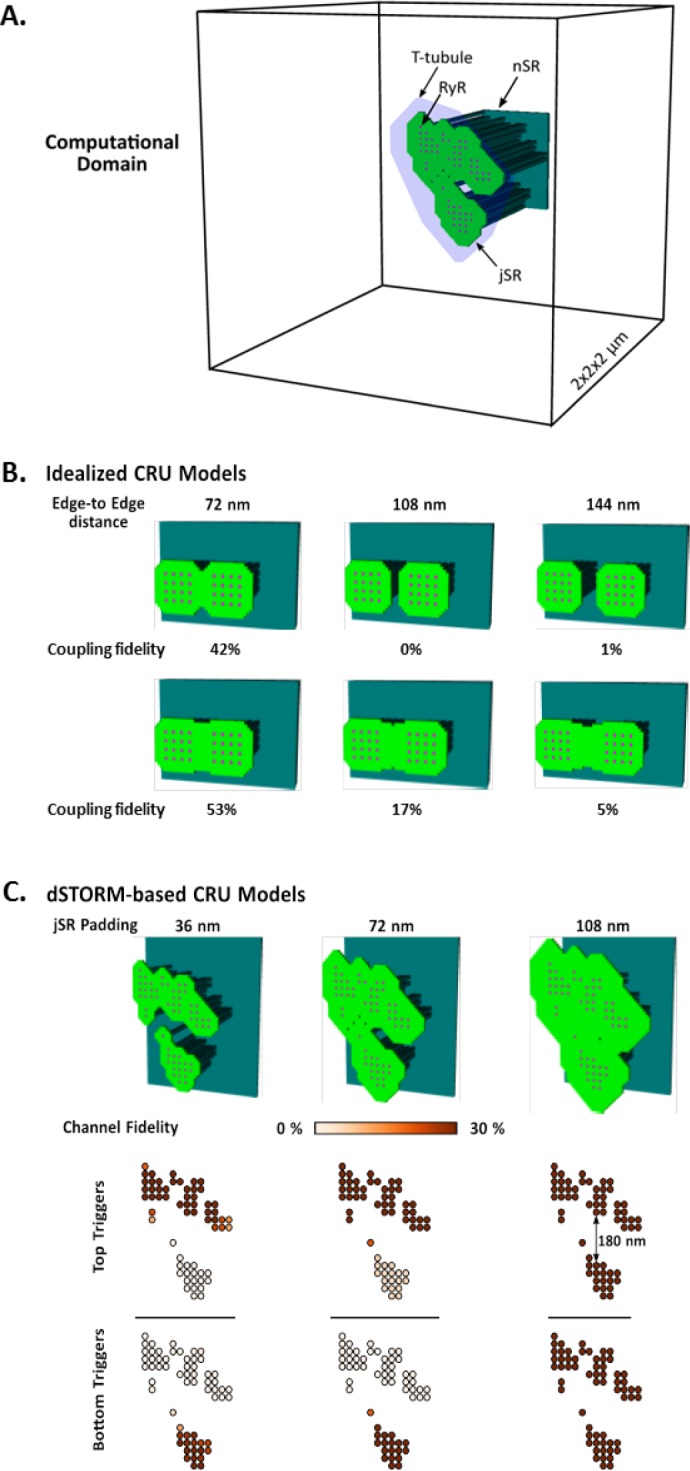
Figure 4u2014figure supplement 1.
Development and characterization of the mathematical dyadic model.
( A ) Graphical representation of the computational domain of the model. The junctional SR (jSR) was shaped to encompass idealized RyR geometries or dSTORM-based CRU contours. ( B ) To understand the ...
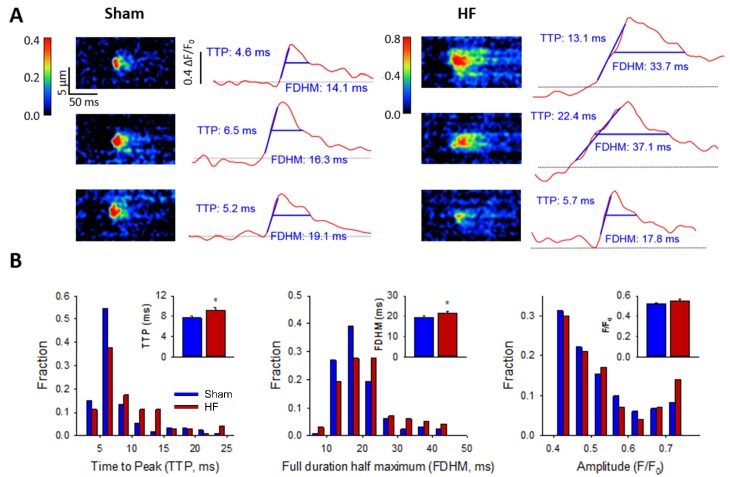
Figure 5.
Ca 2+ spark kinetics are slowed in HF.
( A ) Representative line-scan images of Ca 2+ sparks in Sham and HF, selected from the cell-wide scans presented in Figure 3E . Temporal profiles (right panels) show that spark kinetics were generall...
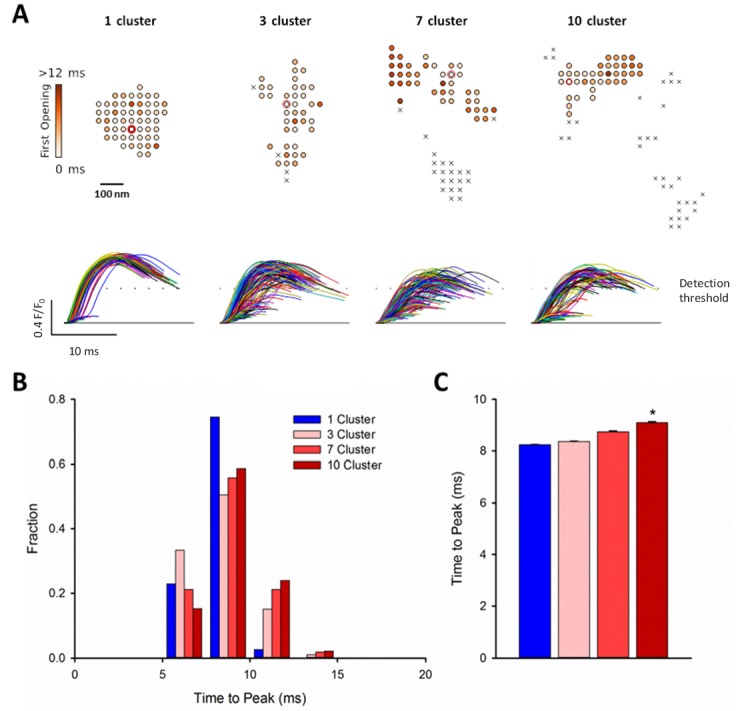
Figure 6.
RyR dispersion during HF results in slowing of Ca 2+ sparks.
To examine whether altered CRU morphology could slow Ca 2+ spark kinetics in HF, spark profiles were simulated for a variety of dSTORM-derived RyR configurations. ( A ) Sparks were triggered by openin...
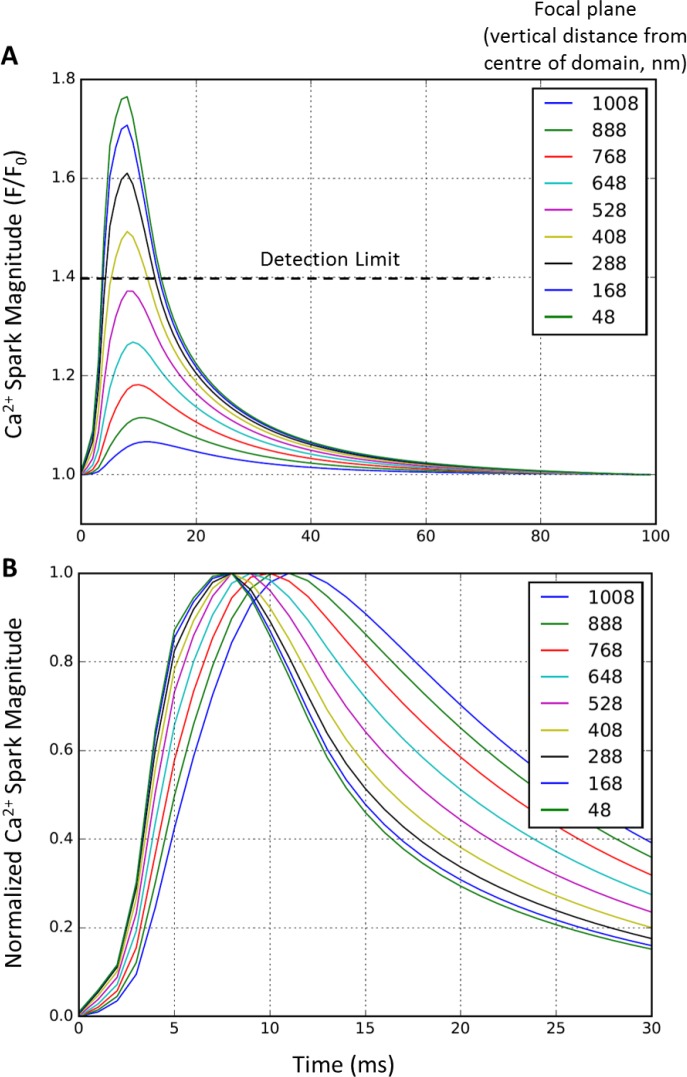
Figure 6u2014figure supplement 1.
Effect of focal plane on Ca 2+ spark detection and kinetics.
To examine whether out-of-focus Ca 2+ release events could artefactually alter assessment of Ca 2+ spark parameters, simulated Ca 2+ release profiles were compared in u2018linescansu2019 collected at ...
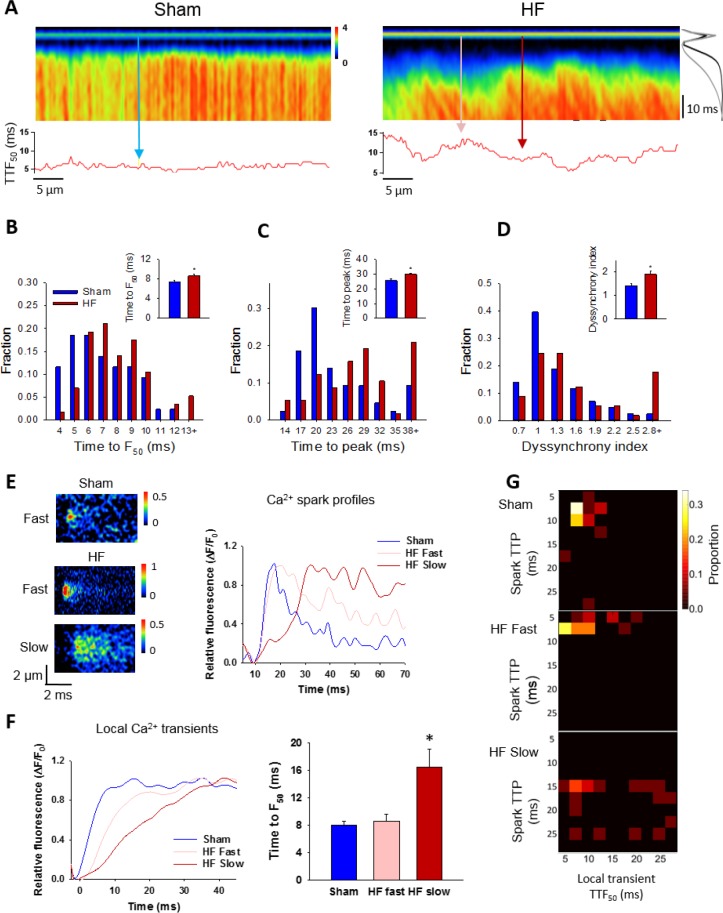
Figure 7.
Slow Ca 2+ sparks promote slow, desynchronized Ca 2+ transients in HF.
( A ) Representative confocal linescan images of Ca 2+ transients in field-stimulated cells (stimulus illustrated as a horizontal line). The overall Ca 2+ transient was slowed in HF compared to Sham, ...
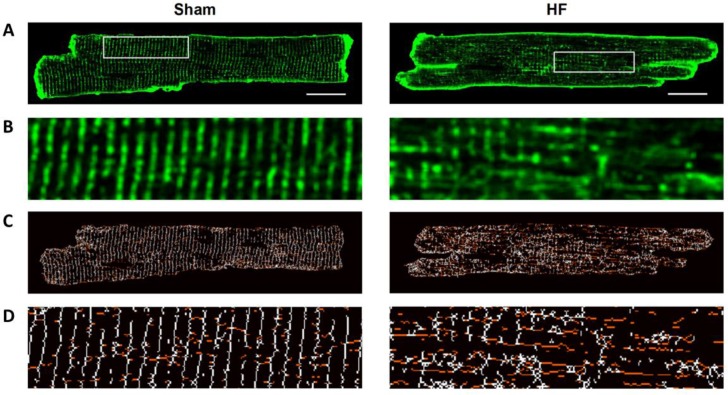
Figure 7u2014figure supplement 1.
T-tubule structure is disrupted during HF.
Isolated cardiomyocytes were stained with di-8-ANEPPS and examined by confocal microscopy ( A ).u00a0Zoomed regions enlarged in ( B ). In agreement with previous work employing the same post-infarctio...
Figure images are served from the NIH/NLM PubMed Central Open Access Subset or Europe PMC; copyright remains with the publishers and authors.
💬 Discussion
0 commentsNo comments yet. Be the first to start a discussion!
Leave a Comment