Abstract
AbstractTissue expansion techniques physically expand swellable gel‐embedded biological specimens to overcome the resolution limit of light microscopy. As the benefits of expansion come at the expense of signal concentration, imaging volume and time, and mechanical integrity of the sample, the optimal expansion ratio may widely differ depending on the experiment. However, existing expansion methods offer only fixed expansion ratios that cannot be easily adjusted to balance the gain and loss associated with expansion. Here, a hydrogel conversion‐based expansion method is presented, that enables easy adjustment of the expansion ratio for individual needs, simply by changing the duration of a heating step. This method, termed ZOOM, isotropically expands samples up to eightfold in a single expansion process. ZOOM preserves biomolecules for post‐processing labelings and supports multi‐round expansion for the imaging of a single sample at multiple zoom factors. ZOOM can be flexibly and scalably applied to nanoscale imaging of diverse samples, ranging from cultured cells to thick tissues, as well as bacteria, exoskeletal Caenorhabditis elegans, and human brain samples.
🔬 Techniques
🔭 Microscopes
🧬 Organisms
✨ Fluorophores
🧪 Sample Preparation
🔬 Cell Lines
🏭 Microscope Brands
🧪 Reagent Suppliers
📷 Detectors
💻 Software Details
💾 Data Repositories
🏛️ Research Organizations (ROR)
Affiliated research institutions:
📋 Methods
Reagents : Antibodies for immunostaining were purchased as follows: mouse monoclonal anti‐α‐tubulin (T6199, Sigma‐Aldrich), rabbit polyclonal anti‐CEP164 (ab221447, Abcam), mouse monoclonal anti‐Centrin (04‐1624, Merck), mouse monoclonal anti‐ATPB (ab110280, Abcam), rabbit polyclonal anti‐Homer1 (160003, Synaptic Systems), guinea pig polyclonal anti‐Bassoon (141004, Synaptic Systems), goat polyclonal anti‐tdTomato (AB8181‐200, SICGEN), rabbit monoclonal anti‐ribosomal protein S6 (5364S, Cell Signaling Technology), chicken polyclonal anti‐GFP (GFP‐1020, Aves Labs), rabbit polyclonal anti‐GFP (A‐6455, Thermo Fisher Scientific), mouse monoclonal anti‐pS129 α‐synuclein (#825702, Biolegend), Alexa 488‐conjugated rabbit polyclonal anti‐GFP (A‐21311, Thermo Fisher Scientific), Alexa 647‐conjugated rabbit polyclonal anti‐GFP (A‐31852, Thermo Fisher Scientific), Alexa 488‐conjugated rabbit monoclonal anti‐TOMM20 antibody (ab205486, Abcam), Alexa 647‐conjugated rabbit monoclonal anti‐TOMM20 antibody (ab205487, Abcam), Alexa 405‐conjugated donkey anti‐goat IgG (ab175665, Abcam), Alexa 647‐conjugated goat anti‐mouse IgG (ab150115, Abcam), Alexa 647‐conjugated donkey anti‐rabbit IgG (ab150063, Abcam), Alexa 488‐conjugated donkey anti‐rabbit IgG (150061, Abcam), Alexa 594‐conjugated donkey anti‐chicken IgY (703‐585‐155, Jackson ImmunoResearch), Alexa 647‐conjugated donkey anti‐guinea pig IgG (706‐605‐148, Jackson ImmunoResearch), Alexa 647‐conjugated donkey anti‐mouse IgG (A‐31571, Thermo Fisher Scientific).
Show full methods section
Reagents : Antibodies for immunostaining were purchased as follows: mouse monoclonal anti‐α‐tubulin (T6199, Sigma‐Aldrich), rabbit polyclonal anti‐CEP164 (ab221447, Abcam), mouse monoclonal anti‐Centrin (04‐1624, Merck), mouse monoclonal anti‐ATPB (ab110280, Abcam), rabbit polyclonal anti‐Homer1 (160003, Synaptic Systems), guinea pig polyclonal anti‐Bassoon (141004, Synaptic Systems), goat polyclonal anti‐tdTomato (AB8181‐200, SICGEN), rabbit monoclonal anti‐ribosomal protein S6 (5364S, Cell Signaling Technology), chicken polyclonal anti‐GFP (GFP‐1020, Aves Labs), rabbit polyclonal anti‐GFP (A‐6455, Thermo Fisher Scientific), mouse monoclonal anti‐pS129 α‐synuclein (#825702, Biolegend), Alexa 488‐conjugated rabbit polyclonal anti‐GFP (A‐21311, Thermo Fisher Scientific), Alexa 647‐conjugated rabbit polyclonal anti‐GFP (A‐31852, Thermo Fisher Scientific), Alexa 488‐conjugated rabbit monoclonal anti‐TOMM20 antibody (ab205486, Abcam), Alexa 647‐conjugated rabbit monoclonal anti‐TOMM20 antibody (ab205487, Abcam), Alexa 405‐conjugated donkey anti‐goat IgG (ab175665, Abcam), Alexa 647‐conjugated goat anti‐mouse IgG (ab150115, Abcam), Alexa 647‐conjugated donkey anti‐rabbit IgG (ab150063, Abcam), Alexa 488‐conjugated donkey anti‐rabbit IgG (150061, Abcam), Alexa 594‐conjugated donkey anti‐chicken IgY (703‐585‐155, Jackson ImmunoResearch), Alexa 647‐conjugated donkey anti‐guinea pig IgG (706‐605‐148, Jackson ImmunoResearch), Alexa 647‐conjugated donkey anti‐mouse IgG (A‐31571, Thermo Fisher Scientific).
SYTO‐16 for nuclear staining
(S7578) was purchased from Thermo Fisher Scientific. DyLight 488‐labeled tomato lectin (DL‐1174) and DyLight 649‐labeled Tomato Lectin (DL‐1178‐1) were purchased from Vector Laboratories. Normal donkey serum (NDS, 017‐000‐121) was purchased from Jackson ImmunoResearch. The recombinant AAV vector expressing eYFP (AAV1‐CaMKIIα0.4‐eYFP, 1.2 × 10 13 copies mL −1 ) was purchased from Penn Vector Core. High glucose Dulbecco's modified Eagle's medium (DMEM, LM 001‐05), fetal bovine serum (FBS, S 001‐01), 0.1% gelatin solution (LS 023‐01), and Dulbecco's PBS (DPBS, LB 001‐02) were purchased from Welgen. Sodium chloride (1.06404.1000), Kanamycin (420311‐25GMCN), and glycine (357002) were obtained from Merck Millipore. 4% paraformaldehyde (PFA, P2031) was obtained from Biosesang. Glutaraldehyde (GA, G0068) and AA (A1132) were purchased from Tokyo chemical industry. Piperazine‐ N,N' ‐bis(2‐ethanesulfonic acid) sodium salt (PIPES, PDB0434) was obtained from Bio basic. Ethylenediaminetetraacetic acid disodium salt (EDTA, E5134), magnesium chloride (M8266), bovine serum albumin (BSA, A9647), SA (408220), sodium borohydride (71321), acrylic acid N‐hydroxysuccinimide ester (NAS, A8060), N,N' ‐methylenebisacrylamide (BA, M7279), N,N,N',N' ‐tetramethylethylenediamine (TEMED, 411019), ammonium persulfate (APS, 215589), tris(hydroxymethyl)aminomethane (Tris), and dimethyl sulfoxide (DMSO, D5879) were purchased from Sigma‐Aldrich. PFA (32%; 15714) was purchased from Electron Microscopy Sciences. Triton X‐100 (0694) and 2‐mercaptoethanol (βME, 97064) were purchased from VWR Life Science. Cell Culture : HeLa cells were obtained from the Korean Cell Line Bank. To prepare cells for fixation and expansion, 0.1% w/v gelatin‐coated coverslips were placed in 6‐well plates. HeLa cells were then seeded into the wells with the density of 1 00 000 cells per well and incubated for 24 h at 37 °C in DMEM containing 10% v/v FBS and 0.01% w/v kanamycin at 37 °C in the presence of 5% CO 2 . eGFP‐centrin‐expressing HeLa cells were prepared by transfection of HeLa cells (2.4 × 10 5 cells on a 60 mm dish) with 2.5 µg of the plasmid (eGFP‐Centrin2, Accession number NM_004344.2 , pLVX‐IRES‐Puro) using Fugene HD (Promega, E2311). One day after transfection, the cells were transferred to a 100 mm dish and treated with 1 mg mL −1 puromycin (Millipor sigma, 540222) for 2–3 weeks and then monoclonal cell lines were established with the dilution cloning method. E. coli 25922 cells were obtained from ATCC. Stocks were prepared by adding 75% glycerol 20 µL to E. coli 80 µL and stored at −80 °C. For experiments, stocked cells were defrosted and 5 µL of the stock was added to 8 mL of cation‐adjusted Mueller Hinton II Broth (BD), then incubated for 16 h under shaking at 37 °C until OD 600 is reached to 0.5. Animals : All experimental protocols were approved by the Seoul National University Institutional Animal Care and Use Committee. All mice were housed in a temperature‐ and a humidity‐controlled room with a reverse 12 h light/dark cycle, with ad libitum access to chow food and water. Both male and female mice at least 6 weeks of age were used. C57BL/6J was obtained from DBL. B6.129P2‐Pvalb tm1(cre)Arbr /J (PV‐Cre; JAX stock No. 017320) and Gt(ROSA)26Sor tm14(CAG‐tdTomato)Hze/J (Ai14 mice; JAX stock No. 007914) mice were obtained from the Jackson Laboratory. B6.Cg‐Tg(Thy1‐YFP)HJrs/J (Thy1‐YFP‐H mice; JAX stock no. 003782) were generously provided by Pilhan Kim (Korea Advanced Institute of Science and Technology). To obtain PV‐tdTomato reporter mice, PV‐Cre mice were crossed with Ai14 mice to reveal expression patterns. Stereotaxic Surgery : PV‐tdTomato reporter mice were anesthetized with 1.5–3.0% isoflurane and placed in a stereotaxic apparatus (David Kopf Instruments) while resting on a heating pad. Following a scalp incision, a small craniotomy was made using a hand drill at the regions of interest. 500 nL of AAV was injected to the primary somatosensory cortex using a pressure injection system (Nanoliter 2000) with a pulled glass capillary at 40–100 nL min −1 . The coordinate was ±0.5 mm antero‐posterior (AP), ±0.5 mm medio‐lateral (ML), −0.5 mm dorso‐ventral (DV) (four injection sites per mouse). The incision was closed using suture and tissue adhesive (Vetbond) and mice were provided with antibiotics and analgesics. Mice were placed in a clean cage on a heating pad to recover from anesthesia, and were kept in their home cage for 3–4 weeks for viral expression and recovery from surgery before transcardial perfusion. Mouse Perfusion : Mice were anesthetized using isoflurane and perfused transcardially with 20 mL of 1 × PBS and 20 mL of fixative solution (4% PFA in PBS or 30% AA and 4% PFA in PBS) at 4 °C. Brains were then harvested and incubated overnight in the same fixative solution at 4 °C with gentle shaking. Brains were sectioned to 50 or 100 µm‐thick coronal slices using a vibrating microtome and stored in 1 × PBS at 4 °C until use. C. elegans Culture : For visualizing touch receptor neurons, the strain CF702 muIs32 [ mec‐7p::GFP + lin‐15(+) ] was obtained from the Caenorhabditis Genetics Center (Strain CF702). Worms were grown at 20 °C on nematode growth media plates with E. coli (OP50) bacteria as a food source and handled with the standard methods. 56 The bleaching technique was used for synchronizing the developmental stages of C. elegans at a young adult stage. Postmortem Human Brain Tissue : Fixed postmortem human brain sections (temporal lobe) were kindly provided by Brain and Body Donation Program. Fixed brain sections were subjected to ZOOM and immunostaining as described. The information of the brain section used in this study is as follows: donor ID #, 869; sex, female; age, 79; race, white; PMI, 3; postmortem sections from PD patient with dementia, Lewy‐body‐positive. NMR Analysis : A monomer solution was prepared with 10% w/v AA, 0.1% w/v APS, and 0.1% w/v TEMED in PBS. Polymerization of the solution was conducted under N 2 atmosphere with mild stirring for 6 h at room temperature (RT). The polymer solution was lyophilized then the obtained solid products were dissolved in basic detergent solution (200 × 10 −3 m sodium dodecyl sulfate (SDS), 50 × 10 −3 m boric acid in DI water, pH titrated to 9.0) for alkaline hydrolysis. After 24 h of incubation at 80 °C, the product solution was then purified with dialysis (2 mL product solution in 3.5 kD dialysis bag) against 2 L of DI water. The dialyzing DI water was changed to fresh ones every 12 h for 7 days. The purified product solution was lyophilized and dissolved in D 2 O, and then 13 C NMR spectra were measured with Agilent 400‐MR DD2 Magnetic Resonance System (400 MHz) at probe temperature in D 2 O. The scan number was 2000 and relaxation delay was 25 s with inverse gated decoupling. Hydrogel Embedding : For embedding cultured cells, cells were fixed for 10 min at RT in a solution containing 3.2% w/v PFA and 0.1% w/v GA either in PEM buffer (0.1 m PIPES, 1 × 10 −3 m EDTA, 1 × 10 −3 m MgCl 2 ) for microtubule experiments, or in PBS buffer for all other experiments. In case of microtubule fixation, cells were pre‐treated with an extraction buffer (0.5% w/v Triton X‐100 in PEM buffer) for 30 s at RT, to wash out tubulin monomers. After the fixation, cells were incubated in 0.1% w/v sodium borohydride solution for 7 min and in PBS buffer containing 100 × 10 −3 m glycine for 10 min, to inactivate glutaraldehyde. The cells were then washed three times for 5 min each with PBS and moved to the anchoring solution (25 × 10 −3 m NAS in 60% v/v DPBS and 40% v/v DMSO). After 60 min of anchoring at RT, the cells were washed three times for 5 min each with PBS. Then the cells were incubated in a monomer solution (30% w/v AA and 0.01% w/v BA in PBS buffer) for 60 min at RT. Finally, the cells were loaded on a coverslip and incubated in 100 µL of monomer solution with initiators (0.5% w/v TEMED and 0.5% w/v APS). The sample was then sandwiched by another coverslip, with polytetrafluoroethylene film (ASF‐110FR, Chukoh) placed in‐between as a spacer. Gelation proceeded at RT for 10 min, followed by brief washing of the gel with PBS buffer. For embedding pre‐fixed brain sections, 50 or 100 µm‐thick fixed tissue samples (including fixed mouse and human brain samples) were incubated in a monomer solution (30% w/v AA, 0.01% w/v BA, 0.65 m sodium chloride, and 4% w/v PFA in PBS; ZOOM solution) with 0.1% w/v TEMED for 3 h at RT. The sample was moved to a wide No. 1.5 coverglass, and freshly prepared ZOOM solution with 0.1% w/v TEMED and 0.1% w/v APS was added on top of the section. The sample was then sandwiched with another coverglass, No. 1 coverglass as a spacer, to obtain flat hydrogel product. Gelation proceeded for 40 min at 25 °C, and the resulting gel was briefly washed with PBS. For embedding mouse tissues and organs, mice were first perfused transcardially with PBS and the ZOOM solution with 0.1% w/v V‐50 azo initiator. Brains were then harvested and incubated in a freshly prepared ZOOM monomer solution at 4 °C for 3 days for post‐fixation and monomer equilibration with gentle shaking. After incubation, tissues were moved to 5 mL of a freshly prepared ZOOM solution with 0.1% w/v V‐50. Gel embedding was performed under nitrogen gas at 45 °C for 40 min with gentle shaking, using Easy‐Gel (LifeCanvas Technologies). The gel‐embedded samples were carefully taken out from a tube, and then the excess gel was manually removed. 300–1000 µm coronal sections were obtained from the embedded gel‐tissue hybrid as needed using a vibrating microtome. For processing C. elegans , worms were first fixed and collagen walls were chemically reduced with the tube fixation protocol without collagenase treatment. 48 Briefly, adult worms were fixed with 4% w/v PFA at 37 °C for 2 h. Worms were then washed in PBS with 0.1% w/v Triton X‐100 (PBST) three times and incubated in a solution containing 5% β‐mercaptoethanol, 1% Triton X‐100, and 0.1 m Tris (pH 7.0) at 37 °C for 12 h with gentle shaking. Following rinsing eight times with PBST, worms were incubated in ZOOM solution with 0.1% w/v TEMED for 12 h at 4 °C with gentle shaking. Worms were then moved to a freshly prepared ZOOM solution with 0.1% w/v TEMED and 0.1% w/v APS. The solution containing worms was dropped on No. 1 coverglass, which was sandwiched with another coverglass with spacers at the edges. Gelation proceeded at 25 °C for 30 min, and the resulting gel was washed with PBS. For embedding E. coli, E. coli 25922 cells were fixed in a Karnovsky's fixative solution for 2 h at 4 °C. After brief washing with PBS, fixed cells were incubated in a lysozyme buffer (940 units mL −1 lysozyme, 20 × 10 −3 m Tris‐HCl, 2 × 10 −3 m EDTA, 1% Triton X‐100) for 15 min at RT for cell wall digestion. Cells were then washed in PBS and gel‐embedded in the same manner as cultured cells. Hydrogel Conversion : Hydrogel‐embedded samples were first incubated in a heated, basic detergent solution (200 × 10 −3 m SDS, 50 × 10 −3 m boric acid in DI water, pH titrated to 9.0) at 95 °C for 15–30 min (depends on sample thickness) for partial denaturation of biomolecules. This was followed by incubation at 80 °C for 0–48 h depending on the desired ZOOM factor. After the conversion, samples were washed four times for 1–2 h each in PBS with gentle shaking. Immunostaining : See Table S1 (Supporting Information) for the list of antibodies used for each experiment. For the immunostaining of cultured cell and E. coli , cells were incubated in blocking buffer (3% w/v BSA in PBST) for 30 min at RT. The cells were then incubated in a primary antibody solution (typically diluted at 1:200 to 1:300 in blocking buffer) for 4 h, and washed three times for 5 min each with a blocking buffer. Cells were then incubated in a secondary antibody solution (typically diluted at 1:300 to 1:500 in blocking buffer) for 2 h and finally washed three times for 5 min each in PBST. For fixed brain sections, free‐floating 50 or 100 µm sections were incubated for 1 h in a blocking buffer (4% NDS in PBST). Sections were incubated with a primary antibody solution at 4 °C for 8–16 h, followed by washing three times for 1 h at RT with PBST. Sections were then incubated with a secondary antibody solution at RT for 3–6 h, followed by washing with PBST for 1–2 h at RT for three times. For ZOOM‐processed samples, samples were first incubated in blocking buffer at 4 °C for 12–24 h. The samples were incubated with a primary antibody solution (typically 1:100 in PBST) at 4 °C for 1–3 days, followed by washing for 1–4 h in PBST at RT for three times. The tissue was then incubated with a secondary antibody solution (typically 1:100 in PBST) at RT for 1–3 days, followed by washing for 1–4 h at RT with PBST for three times. Expansion, Mounting, and Imaging : The stained HeLa cells on a coverslip were mounted on a microscope slide with PBS as a mounting medium. For brain sections, free‐floating sections were mounted on microscope slides with PVA‐DABCO. Confocal images were obtained on a Zeiss LSM 880 laser scanning microscope. SIM images were collected using the DeltaVision OMX SR imaging system (GE Healthcare, Buckinghamshire, UK). ZOOM‐processed samples were moved to a petri dish and the dish was filled with DI water. Water was exchanged every 1 h until the sample expansion reached equilibrium. After the expansion is complete, water was carefully removed from the petri dish. Several No. 1 coverglass or small magnets (D101‐N52, K&J Magnetics) were used to build spacers, and a coverslip was laid on top of the sample. To firmly hold the sample in place, 1% agarose gel was formed in the dish fill the spaces between the petri dish and the coverslip. The entire dish was filled with DI water, and samples were imaged using a Zeiss LSM 880 laser scanning microscope. Expansion Factor Measurement : To evaluate the expansion factor for the experiments shown in Figures 1 c–g and 4i–l, the length of the long axis of the expanded sections was divided by that of unexpanded sections. For these experiments, whole mouse brains were processed with ZOOM as described above and sectioned to 500 µm‐thick coronal sections with a vibrating microtome in the air to prevent expansion in PBS. The original length of the long axis of the section was measured, and then sections were subject to hydrogel conversion for varying amounts of time. Sections were washed with DI water for three times, and the lengths of the long axis of expanded sections were measured. For the experiments shown in Figures 2 a–d and 4 b–g, the expansion factor was calculated as the cube root of the volume ratio between the samples before and after ZOOMing. For the C. elegans experiments, the ratio between the average diameters of developmentally synchronized worms, before and after ZOOMing, was used to estimate the expansion factor. For the experiments shown in Figures 2 f–h and 3 and Figure S7 (Supporting Information), the scaling factor of rigid transformation between the images of samples before and after ZOOMing was taken as the expansion factor (see below “Measurement error quantification” section). Measurement Error Quantification : RMS error was estimated in a similar manner with the previous studies. 10 Briefly, pre‐ and post‐expansion images were converted to 16‐bit grayscale format with Fiji and post‐expansion images were registered to the pre‐expansion images by similarity (rigid) transformation using Elastix software. During the similarity transformation, post‐expansion images were isotropically translocated, rotated, expanded, or contracted to match the corresponding positions of the pre‐expansion images, and the scaling factor was computed through the transformation processing. The resulting, transformed images were again registered to pre‐expansion images by B‐spline (nonrigid) transformation using Elastix to determine the distortion. The output data were then processed using Mathematica scripts provided by a previous report 10 to generate the measurement RMS error plots. In these data, RMS error was calculated from all combinations of random sampled 7000 input points. Line Profile Intensity and FWHM Analysis : To analyze the line intensity profiles, straight lines were drawn perpendicular to the synaptic junction or near the fibers of interest and intensity profiles were obtained. Signals from individual channels in profiles were normalized by Min‐Max scaling. 1D Gaussian distributions were fit to normalized signal intensity and FWHM was measured using Matlab. Neurofilament Tracing : Individual neurons were semi‐automatically traced using filament tool of Imaris software (Bitplane). An image of the mouse cortex was loaded into a 3D view, and the “autopath” calculation was performed by selecting individual cell body as a starting point, and neuronal fibers were designated by selecting endpoints of connected volume. Dendritic spine tracing was performed in a similar manner using autopath calculation. Tissue Shrinkage Test : 4% w/v PFA fixed 1 mm thick brain slices were incubated following monomer solutions without initiators: 30% w/v AA, 10% w/v SA, 0.05% BA, and 1 × PBS (original MAP); 2 m NaCl, 2.5% w/w AA, 8.625% w/w SA, 0.15% w/w BA, and 1 × PBS (ExM); 0.6 m NaCl, 30% w/v AA, 0.01% w/v BA, and 1 × PBS (ZOOM; AA30); 20% w/v AA, 10% w/v SA, 0.01% w/v BA, and 1 × PBS (AA20 SA10); 10% w/v AA, 20% w/v SA, 0.01% w/v BA, and 1 × PBS (AA10 SA20); 30% w/v SA, 0.01% w/v BA, and 1 × PBS (SA30). Relative areas were calculated based on area of coronal section before and after incubation, measured with Fiji. Compressive Strength Measurement : To evaluate the mechanical properties of cylindrical hydrogel disks made of different compositions, Galdabini Quasar 5 universal testing machine was used to measure the strain‐compressive strength relationship. Gel disks were placed between the fixed lower plate and the moving upper plate, which was connected to a load cell (250 N) with a crosshead. The moving plate pressed the hydrogel at the speed of 5 mm min −1 , while plate movement and force on the load cell was recorded. The strain was defined as the relative change in the disk thickness, and the strength was calculated as the pressure, based on measured force and the initial cross‐sectional area of gel disks. Statistics and Reproducibility : All experiments were performed at least three times independently unless indicated otherwise. All data are expressed as the mean ± s.d. n values are stated in figure legends. One‐way analysis of variance (ANOVA) was used as indicated in the figure legends.
Supporting information Supplementary Click here for additional data file. Supplementary Click here for additional data file. Supplementary Click here for additional data file.
📊 Figures
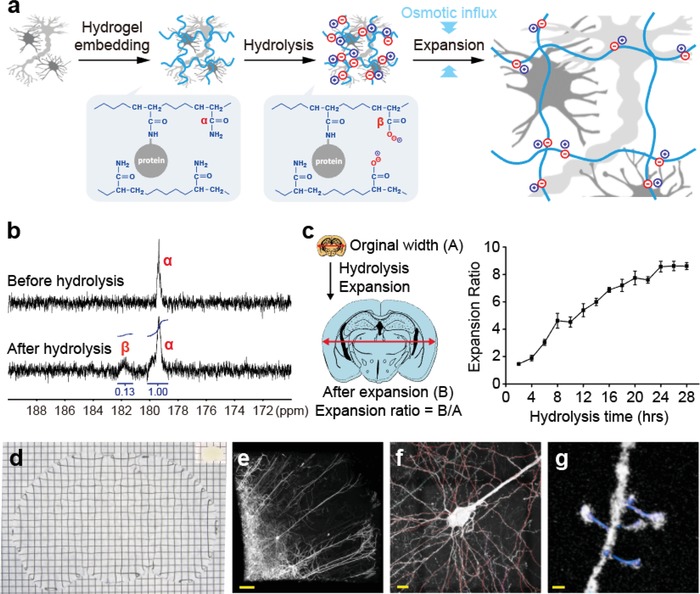
Figure 1
Chemical principles and implementation of ZOOM. a) Schematic illustration of the ZOOM process. A sample is embedded in an electrically neutral acrylamide gel, then undergoes alkaline hydrolysis for th...
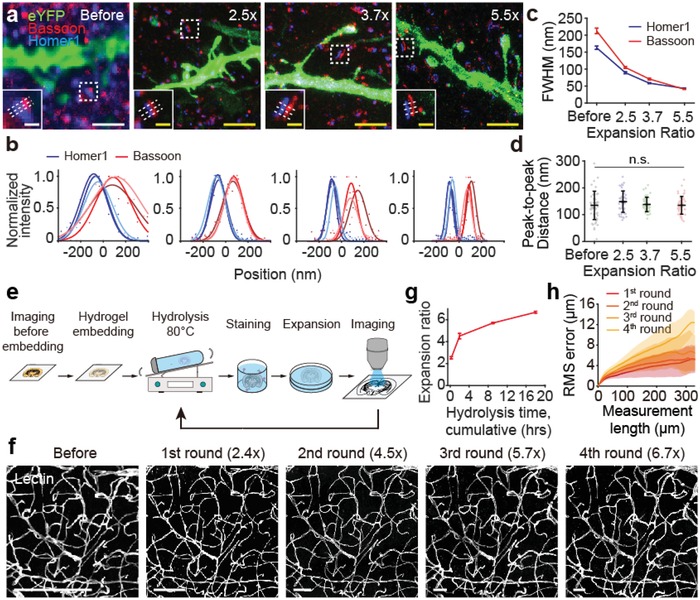
Figure 2
ZOOM enables isotropic expansion while preserving biomolecules for multiu2010round expansion. a) Gelu2010embedded Thy1u2010eYFP mouse brain sections were subject to different hydrolysis times and stai...
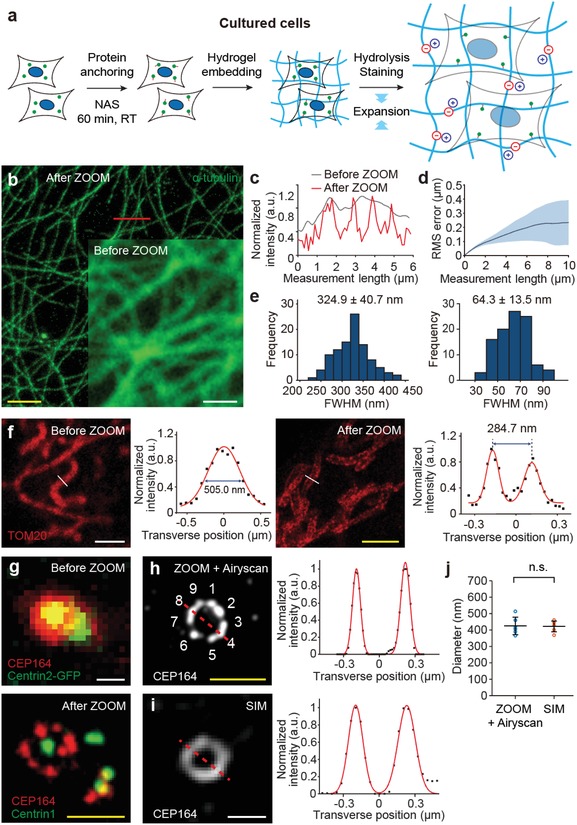
Figure 3
ZOOMing into subcellular structures in cultured cells. a) ZOOM process for cultured cells. b) HeLa cells were stained for u03b1u2010tubulin and imaged before and after ZOOM processing for comparisons....
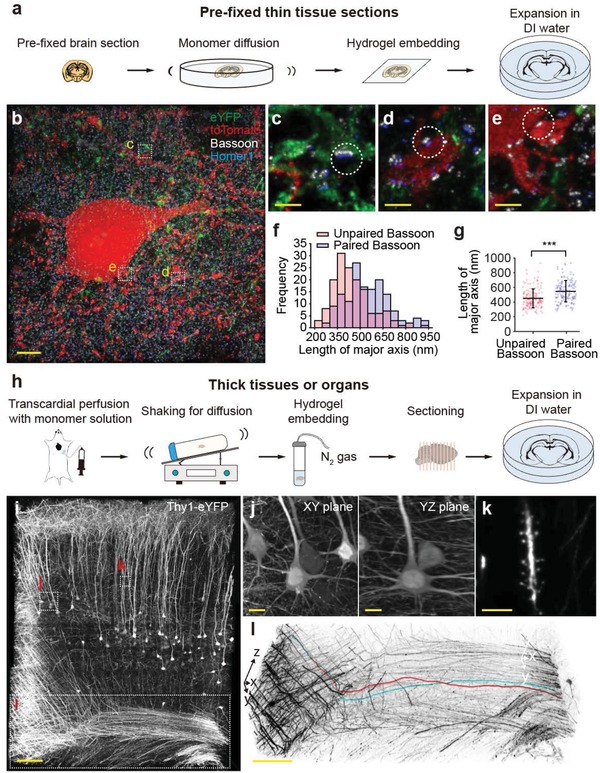
Figure 4
ZOOMing into neural structures in mouse brain tissues. a) ZOOM process for preu2010fixed thin tissue sections. bu2013g) PVu2010tdTomato reporter mice (obtained by breeding PVu2010Cre mice with Ai14 re...
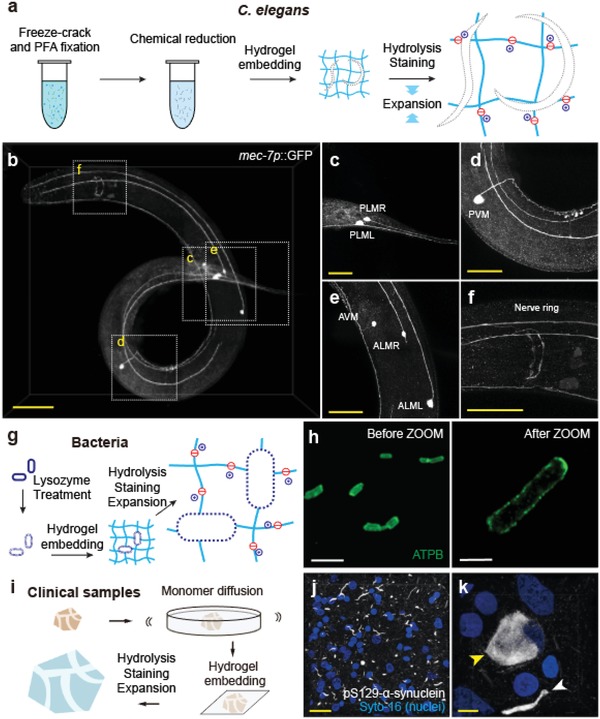
Figure 5
ZOOMing into diverse biological samples. a) Whole transgenic C. elegans ( mecu20107p::GFP ) was expanded with modified ZOOM protocol including PFA fixation and u03b2u2010mercaptoethanol reduction adap...
Figure images are served from the NIH/NLM PubMed Central Open Access Subset or Europe PMC; copyright remains with the publishers and authors.
💬 Discussion
0 commentsNo comments yet. Be the first to start a discussion!
Leave a Comment