Abstract
Abstract Calcium ions are essential to signal transduction in virtually all cells, where they coordinate processes ranging from embryogenesis to neural function. Although optical probes for intracellular calcium imaging have been available for decades, the development of probes for noninvasive detection of intracellular calcium signaling in deep tissue and intact organisms remains a challenge. To address this problem, we synthesized a manganese-based paramagnetic contrast agent, ManICS1-AM, designed to permeate cells, undergo esterase cleavage, and allow intracellular calcium levels to be monitored by magnetic resonance imaging (MRI). Cells loaded with ManICS1-AM show changes in MRI contrast when stimulated with pharmacological agents or optogenetic tools; responses directly parallel the signals obtained using fluorescent calcium indicators. Introduction of ManICS1-AM into rodent brains furthermore permits MRI-based measurement of neural activation in optically inaccessible brain regions. These results thus validate ManICS1-AM as a calcium sensor compatible with the extensive penetration depth and field of view afforded by MRI.
🔬 Techniques
💻 Software
✨ Fluorophores
🧪 Sample Preparation
🔬 Cell Lines
🏭 Microscope Brands
🧪 Reagent Suppliers
💻 Software Details
💾 Data Repositories
🏛️ Research Organizations (ROR)
Affiliated research institutions:
📋 Methods
Synthesis
All information regarding the synthesis and characterization of ManICS1, ManICS1-AM, and related compounds is reported in the Supplementary Methods section. In vitro magnetic resonance imaging MRI data were acquired on a 7 T Bruker Biospec system using a T 1 -weighted 2D gradient echo sequence (echo time, TE = 5 ms, repetition time, TR = 100 ms; flip angle, FA = 65°). Longitudinal relaxivity ( r 1 ) measurements were acquired using a 2D spin echo sequence (TE = 11 ms, TR = 125, 200, 400, 800, 1500, 3000, and 5000 ms), with in-plane resolution of 200 × 200 µm 2 and 2 mm slice thickness. R 1 maps and values were generated using Karl Schmidt’s MRI Analysis Calculator Plugin for ImageJ (National Institutes of Health, Bethesda, MD) or MATLAB scripts (Mathworks, Natick, MA) written in house. Stimulus-dependent R 1 changes in cells were calculated as ∆ R 1 / R 1 = [ R 1 (incubated cells) − R 1 (naive cells)]/ R 1 (naive cells). Statistical comparisons between paired conditions were performed using Student’s t -test, and all error bars denote the standard error of the mean (SEM) from three or more measurements, unless otherwise noted. In vitro characterization of ManICS1 and ManICS1-AM ManICS1, calcium and magnesium chloride stock solutions were all prepared in 25 mM 3-( N -morpholino)propanesulfonic acid (MOPS), pH 7.4, with 100 mM KCl. Titration series were prepared as separate triplicates for each data point in the presence of constant concentrations of ManICS1, confirmed subsequently by inductively coupled plasma optical emission spectroscopy (ICP-OES). Samples were arrayed into microtiter plates and measured by MRI using a Bruker (Billerica, MA) Avance 7 T scanner. Unused wells were filled with buffer, and imaging was performed on a 2-mm slice through the sample. K d values were calculated by fitting a standard ligand-depleting binding equation to R 1 data. Error represents the standard error values for fitted parameters in a least squares fit to the data. Calcium affinity of manganese-free ManICS1 (10 µM) was determined by fitting a nondepleting binding model to spectroscopic absorbance data obtained at 230 nm, in the presence of buffered free calcium concentrations ranging from 0 to 1.5 µM. Titration data are shown with least squares curve fits. To measure stability against transmetallation, ManICS1-AM (40 µM) in Bis-Tris (50% EtOH, pH 7.4, 50 mM) was treated with solutions of CuCl 2 (50 µM) and ZnCl 2 (50 µM) in Bis-Tris (50% EtOH, pH 7.4, 50 mM) and stirred at room temperature for 5 h before recording of optical absorbance spectra.
Show full methods section
Synthesis
All information regarding the synthesis and characterization of ManICS1, ManICS1-AM, and related compounds is reported in the Supplementary Methods section. In vitro magnetic resonance imaging MRI data were acquired on a 7 T Bruker Biospec system using a T 1 -weighted 2D gradient echo sequence (echo time, TE = 5 ms, repetition time, TR = 100 ms; flip angle, FA = 65°). Longitudinal relaxivity ( r 1 ) measurements were acquired using a 2D spin echo sequence (TE = 11 ms, TR = 125, 200, 400, 800, 1500, 3000, and 5000 ms), with in-plane resolution of 200 × 200 µm 2 and 2 mm slice thickness. R 1 maps and values were generated using Karl Schmidt’s MRI Analysis Calculator Plugin for ImageJ (National Institutes of Health, Bethesda, MD) or MATLAB scripts (Mathworks, Natick, MA) written in house. Stimulus-dependent R 1 changes in cells were calculated as ∆ R 1 / R 1 = [ R 1 (incubated cells) − R 1 (naive cells)]/ R 1 (naive cells). Statistical comparisons between paired conditions were performed using Student’s t -test, and all error bars denote the standard error of the mean (SEM) from three or more measurements, unless otherwise noted. In vitro characterization of ManICS1 and ManICS1-AM ManICS1, calcium and magnesium chloride stock solutions were all prepared in 25 mM 3-( N -morpholino)propanesulfonic acid (MOPS), pH 7.4, with 100 mM KCl. Titration series were prepared as separate triplicates for each data point in the presence of constant concentrations of ManICS1, confirmed subsequently by inductively coupled plasma optical emission spectroscopy (ICP-OES). Samples were arrayed into microtiter plates and measured by MRI using a Bruker (Billerica, MA) Avance 7 T scanner. Unused wells were filled with buffer, and imaging was performed on a 2-mm slice through the sample. K d values were calculated by fitting a standard ligand-depleting binding equation to R 1 data. Error represents the standard error values for fitted parameters in a least squares fit to the data. Calcium affinity of manganese-free ManICS1 (10 µM) was determined by fitting a nondepleting binding model to spectroscopic absorbance data obtained at 230 nm, in the presence of buffered free calcium concentrations ranging from 0 to 1.5 µM. Titration data are shown with least squares curve fits. To measure stability against transmetallation, ManICS1-AM (40 µM) in Bis-Tris (50% EtOH, pH 7.4, 50 mM) was treated with solutions of CuCl 2 (50 µM) and ZnCl 2 (50 µM) in Bis-Tris (50% EtOH, pH 7.4, 50 mM) and stirred at room temperature for 5 h before recording of optical absorbance spectra.
Cell labeling with ManICS1-AM
HEK293 cells (Freestyle 293-F, Thermo Fisher Scientific, Waltham, MA) were cultured and prepared for relaxometry using a previously established method 19 . To assess uptake, cells were exposed to contrast agents in media for 30 min or 2 h then centrifuged at 750 × g for 5 min, washed with Hank’s buffered saline solution and repelleted. At this point, for time course experiments, washed cells were incubated in media again for varying time intervals and centrifuged again. In the final stage of preparation, cells were resuspended in media at 10 7 cells per 100 µl, and at this point drugs were added for pharmacological stimulation experiments. The suspended cells were finally plated into wells of a 384-well plate and then immediately pelleted by 1 min centrifugation at 750 × g for imaging. Subcellular fractionation analysis of ManICS1-AM-labeled cells was conducted by addition of 0.05% saponin and pelleting the cells at 750 × g to recover cytosolic fraction, resuspending the cells in low salt buffer and lysing the cells with 50 passes through a dounce homogenizer and a final centrifugation at 10,000 × g with the supernatant collected as the nucleosolic/organellular fraction and the pellet collected as the membrane fraction. Each cell fraction was aliquated into a crucible, incubated at 70 °C overnight to dessicate, then at 250 °C overnight to incinerate all organic molecules. The residual ash was resuspended in 200 µl 70% nitric acid and incubated at 70 °C overnight to soublize the metal oxides. The final residue was suspended into 2% nitric acid for analysis with ICP-OES.
Cellular toxicity and viability assays
HEK293 cells were incubated in 100 µM ManICS1-AM in media containing 5% DMSO for 30 min and then washed in media. Control cells were either untreated (naive), treated with saponin, or treated with DMSO vehicle only. To assess acute toxicity and membrane disruption, a subset of cells was incubated with 4 µM Ethidium Homodimer III (Biotium, Fremont, CA) and assayed for fluorescence at 530 and 620 nm. Higher fluorescence ratio (530/620) indicates increased cell penetrance and intercalation into DNA, indicative of toxicity. To assess long-term viability, an MTT assay (Life Technologies, Carlsbad, CA) was performed. Cells were incubated in the MTT reagent for 4 h at 37 °C to generate formazan crystals, which were then solubilized in sodium dodecylsulfate solution for 2 h at 37 °C and assayed for optical density at 570 nm. Higher absorption indicates higher NAD(P)H-dependent enzymatic activity, indicative of cell health.
Measurement of intracellular calcium responses
For stimulation experiments, cells were incubated with 10 µM ManICS1-AM for 2 h to allow for effective labeling and AM ester cleavage. Pharmacological stimulation was conducted by adding 5 µM thapsigargin, 25 µM carbochol, 5 µM calcimycin, or 30 µM arachidonic acid (Sigma-Aldrich, St. Louis, MO). Chemical agents were added while cells were in suspension to allow for mixing, then samples were gently pelleted the samples and collected R 1 relaxometry data. For comparison stimulation measurements performed with Fura-2FF-AM (BioVision, Exton, PA), adherent HEK293 cells (Life Technologies) were seeded onto a 96-well plate at 5000 cells/well and grown for two days until 90% confluent. Cells were then incubated for 45 min in 5 µM Fura-2FF-AM and then washed with media. Stimulants (10 µM thapsigargin, 100 µM charbocol, 5 µM calcimycin, or 30 µM arachidonic acid) were quickly added to multiple wells via multipipettor and fluorescence output was measured at 340 and 380 nm using a Spectramax plate reader. Measurements were repeated every 5 min for 40 min to chart the time course of calcium concentration changes at room temperature. Mean responses reported in Fig. 4d were reported as fold changes in the ratio of fluorescence emission at 340 and 380 nm pre- vs. post stimulation. Optogenetics BACCS2-IRES-Orai (Addgene 67627) was transiently transfected into 293freestyle cells using 293fectin (Life Technologies) and given 48 h to express. BACCS2-expressing and control cells were incubated in 40 µM ManICS1-AM for 2 h or 5 µM X-Rhodamine-1 (Life Technologies) for 30 min then washed with complete media without phenol red (Life Technologies). Cells were then pelleted cooled on ice and suspended in 0.5× volumes of Matrigel (Corning). The liquid Matrigel/cell slurry was then aliquoted onto a plate adapted to accommodate a fiber optic input, placing the cell directly in the lightpath but 2 mm from the fiber light source, to prevent possible heating artefacts. A 480-nm laser interfaced to the fiber was controlled via an Arduino microcontroller, using a custom written pulse sequence. Data were processed in ImageJ and analyzed using custom MATLAB scripts for high/low pass filtering, detrending using a polynomial fit to the pre-stimulus baseline and the last data point, with averaging across multiple experiments. Time course images were binned into 2 min averages centered around the peak response.
Animal use Male
Sprague-Dawley rats (250–300 g) were purchased from Charles River Laboratories (Wilmington, MA) and used for all in vivo experiments. Animals were housed and maintained on a 12 h light/dark cycle and permitted ad libitum access to food and water. All procedures were performed in strict compliance with US Federal guidelines, with oversight by the MIT Committee on Animal Care. In vivo validation experiments A 4-mM stock of ManICS-AM or control agent in DMSO was diluted to 200 mM in aCSF (125 mM NaCl, 2.5 mM KCl, 1.4 mM CaCl 2 , 1 mM MgCl 2 , 1.25 mM NaH 2 PO 4 , 25 mM NaHCO 3 ). Prior to intracranial infusion, animals were anesthetized with ~2% isoflurane, shaved, and mounted in a rodent stereotaxic device (David Kopf Instruments), while vital signs were monitored by pulse oximeter (Nonin Medical). The scalp over bregma was retracted and 28G holes were drilled into the skull 0.7 mm anterior and 3 mm lateral to bregma for access to the caudate nucleus based on a standard rat brain atlas 32 . 28G cannula guides that projected 2 mm below the surface of the skull, preassembled with 33G metal injection cannulae that projected 5 mm below the skull (Plastics One) were lowered to the appropriate depth through the holes and the guides were affixed in place using SEcure light curing dental cement (Parkell, Inc.) Intra-cranial infusions were performed using an injection rate of 0.12 µl min −1 for 2 h with control vs. test sides alternated for each experiment to negate potential artifacts or bias. Metal cannulae were then removed and the animal was transferred to a custom MRI rat imaging cradle. 33G plastic cannulae (Plastics One) loaded with aCSF or stimulatory agent were then lowered bilaterally through the guide cannulae to the contrast agent delivery sites, and fixed in place with a locking cap (Plastics One). Neural stimulation was induced with isotonically KCl-supplemented aCSF (125 mM KCl, 2.5 mM NaCl, 1.4 mM CaCl 2 , 1 mM MgCl 2 , 1.25 mM NaH 2 PO 4 , 25 mM NaHCO 3 ), infused at a rate of 0.2 µl min −1 for 5 min. In vivo imaging experiments were conducted on a 9.4 T Biospec MRI scanner (Bruker) using a cross coil volume transmitter and surface receiver configuration. Functional imaging scans were acquired using a T 1 -weighted gradient echo sequence (TE = 5.5 ms, TR = 150 ms, FA = 45°). These images had 48 × 32 matrix size with 400 µm in-plane resolution and 1 mm slice thickness, and were acquired with an acquisition rate of 4.6 s/image. Each experiment consisted of a 5 min pre-stimulation period, followed by 5 min of stimulation and 10 min of rest. Anatomical images used in Fig. 5 were obtained using a T 1 -weighted rapid acquisition with refocused echoes (RARE) pulse sequence (TE = 8 ms, TR = 300 ms, FA = 160°, RARE factor = 4, number of averages = 20), with an in-plane resolution of 100 µm and a matrix size of 192 × 128 per slice. Distribution of agent was determined by identifying the cannula tip and defining all contiguous pixels within 10% of image intensity at the tip as detected agent. The mean radius was determined for each resulting region of interest (ROI) and the volume occupied by the contrast agent was estimated as the volume of a sphere with this radius. Mean MRI signal within these ROIs were compared at multiple time points for analysis of contrast loss over time. The average tissue ManICS concentration was estimated from the contrast agent-dependent percent signal increase observed in T 1 -weighted anatomical scans, using the fact that T 1 -weighted MRI signal is proportional to 1 – exp{– R 1 ∙TR}; R 1 in the absence of ManICS1 is taken as 0.31 s −1 33 and the Δ R 1 due to contrast agent addition is the effective [ManICS1] times its in vitro calcium-free r 1 = 3.6 mM −1 s −1 . For analysis of dynamic signal changes during stimulation, MRI intensity was integrated over ROIs defined by a 1.2 × 1.2 mm square area adjacent to the cannula tip and centered on the point of peak signal change during stimulation period. Signal traces were filtered, normalized, and averaged using the same algorithm used for analysis of the optogenetic experiments. Percent signal changes were computed with respect to a baseline defined by the first 5 min of imaging and the last time point. Mean signal change amplitudes reported in Fig. 5e were defined by the average signal change during the final 1 min of infusion. The map of percent signal change in Fig. 5d was generated by averaging percent signal change maps from five animals aligned to their respective cannula tips and plotting the result overlaid on a representative anatomical image. Sample sizes ( n ≥ 5) used for each in vivo functional experiment were appropriate for providing a statistical power of 0.8 for detection of a ≥4% signal change over a standard deviation of 2%.
Code availability
Scripts used for data analysis are available upon reasonable request. Reporting Summary Further information on experimental design is available in the Nature Research Reporting Summary linked to this article.
Supplementary information Supplementary Information Peer Review File Reporting Summary
Electronic supplementary material Supplementary Information accompanies this paper at 10.1038/s41467-019-08558-7.
📊 Figures
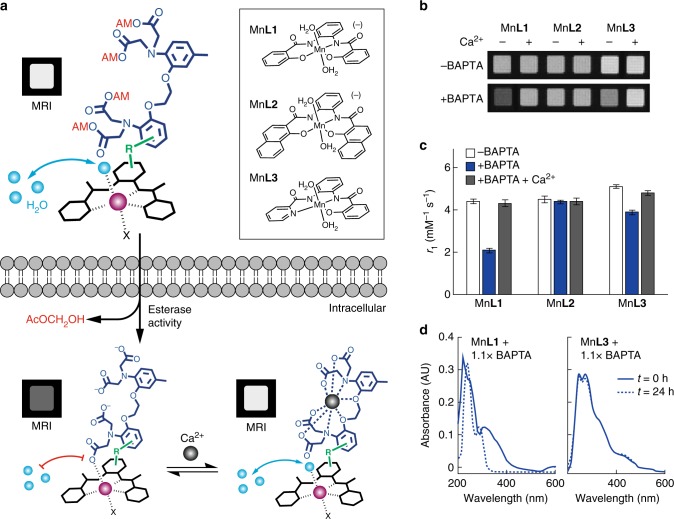
Fig. 1
Design of cell permeable sensors for calcium-dependent molecular fMRI. a The design consists of a cell permeable paramagnetic platform (black complex, Mn-PDA candidate complexes shown at top right), a...
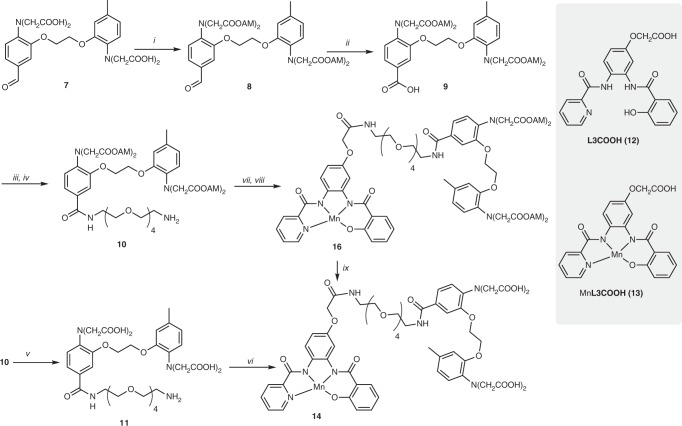
Fig. 2
Synthesis of ManICS1 and ManICS1-AM. i ) AcOCH 2 Br, DIEA (67%); ii ) NaH 2 PO 4 , NaClO 2 (95% yield); iii ) PyBOP, DIEA, NH 2 -PEG 4 -NHBoc (63%); iv ) TFA, DCM (98%); v) NaOH (6 eq), H 2 O (77%); v...
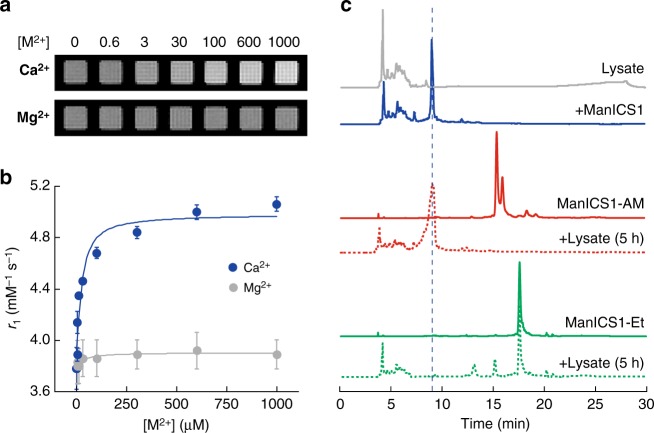
Fig. 3
ManICS1 reports calcium-dependent MRI signal changes in buffer and MnICS1-AM undergoes enzymatic hydrolysis. a T 1 -weighted images of 40 u00b5M ManICS1 with addition of varying micromolar concentrati...
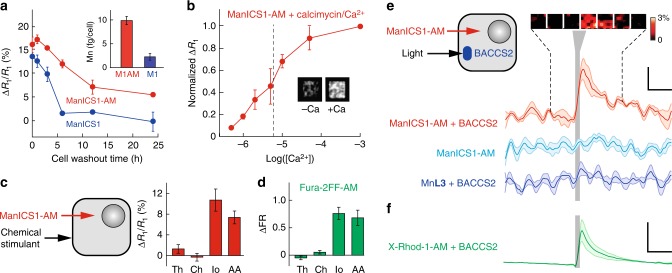
Fig. 4
ManICS1 reports calcium-dependent MRI signal changes in cells. a Washout time course of u0394 R 1 / R 1 vs. time for HEK293 cells preincubated with 10u2009u00b5M ManICS1-AM (red) or ManICS1 acid form ...
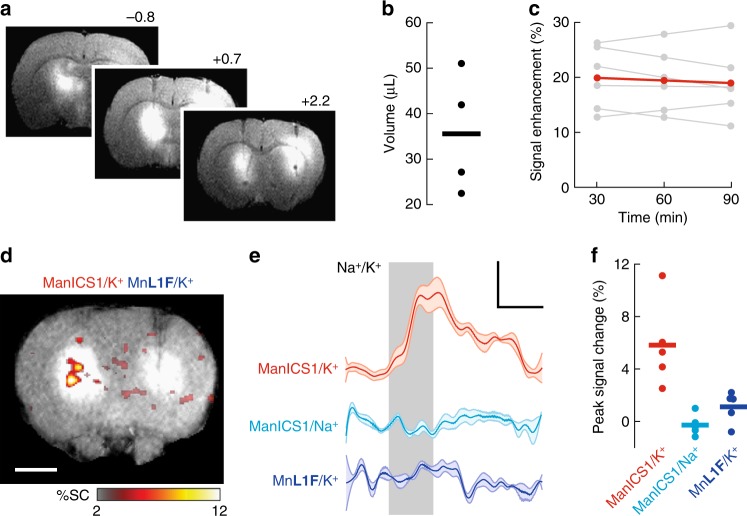
Fig. 5
ManICS1-AM enables detection of neural activation in rat brain. a T 1 -weighted MRI showing broad contrast enhancement following infusion of 15 u00b5L ManICS-1 (left) or calcium-insensitive control ag...
Figure images are served from the NIH/NLM PubMed Central Open Access Subset or Europe PMC; copyright remains with the publishers and authors.
💬 Discussion
0 commentsNo comments yet. Be the first to start a discussion!
Leave a Comment