Abstract
Limb-specific Shh expression is regulated by the (∼1 Mb distant) ZRS enhancer. In the mouse, limb bud-restricted spatiotemporal Shh expression occurs from ∼E10 to E11.5 at the distal posterior margin and is essential for correct autopod formation. Here, we have analysed the higher-order chromatin conformation of Shh in expressing and non-expressing tissues, both by fluorescence in situ hybridisation (FISH) and by chromosome conformation capture (5C). Conventional and super-resolution light microscopy identified significantly elevated frequencies of Shh/ZRS colocalisation only in the Shh-expressing regions of the limb bud, in a conformation consistent with enhancer-promoter loop formation. However, in all tissues and at all developmental stages analysed, Shh-ZRS spatial distances were still consistently shorter than those to a neural enhancer located between Shh and ZRS in the genome. 5C identified a topologically associating domain (TAD) over the Shh/ZRS genomic region and enriched interactions between Shh and ZRS throughout E11.5 embryos. Shh/ZRS colocalisation, therefore, correlates with the spatiotemporal domain of limb bud-specific Shh expression, but close Shh and ZRS proximity in the nucleus occurs regardless of whether the gene or enhancer is active. We suggest that this constrained chromatin configuration optimises the opportunity for the active enhancer to locate and instigate the expression of Shh.
🔬 Techniques
🔭 Microscopes
💻 Software
✨ Fluorophores
🧪 Sample Preparation
🔬 Cell Lines
🏭 Microscope Brands
🧪 Reagent Suppliers
📷 Detectors
💻 Software Details
💾 Data Repositories
🏛️ Research Organizations (ROR)
Affiliated research institutions:
📋 Methods
Fish For 3D-FISH, E10.5, E11.5 and E14.5 embryos from CD1 mice were collected, fixed, embedded, sectioned and processed as previously described ( Morey et al., 2007 ), except that sections were cut at 6 μm. Fosmid clones ( Fig. 1 A; Table S1 ) were prepared and labelled as previously described ( Morey et al., 2007 ). Between 160 and 240 ng of biotin- and digoxigenin-labelled fosmid probes were used per slide, with 16-24 μg of mouse Cot-1 DNA (Invitrogen) and 10 μg salmon sperm DNA. Image analysis For 3D analysis of tissue sections by conventional microscopy, slides were imaged with a Hamamatsu Orca AG CCD camera (Hamamatsu Photonics), Zeiss Axioplan II fluorescence microscope with Plan-neofluar or Plan apochromat objectives, a Lumen 200 W metal halide light source (Prior Scientific Instruments) and Chroma #89014ET single excitation and emission filters (Chroma Technology Corporation) with the excitation and emission filters installed in Prior motorised filter wheels. A piezoelectrically driven objective mount (PIFOC model P-721, Physik Instrumente & Co, Karlsruhe) was used to control movement in the z dimension. Hardware control, image capture and analysis were performed using Volocity (PerkinElmer). Images were deconvolved using a calculated point spread function with the constrained iterative algorithm of Volocity (PerkinElmer). Image analysis was carried out using the Quantitation module of Volocity (PerkinElmer).
SIM imaging
Images were acquired using structured illumination microscopy (SIM) performed on an Eclipse Ti inverted microscope equipped with a Nikon Plan Apo TIRF objective (NA 1.49, oil immersion) and an Andor DU-897X-5254 camera. Laser lines at 405, 488 and 561 nm were used. Step size for z -stacks was set to 0.120 μm, which is well within the Nyquist criterion. For each focal plane, 15 images (five phases, three angles) were captured with the NIS-Elements software. SIM image processing and reconstruction were carried out using the N-SIM module of the NIS-Element Advanced Research software. Image analysis was carried out using the Quantitation module of Volocity (PerkinElmer) with x and y binning resolution of 32 nm.
Show full methods section
Fish For 3D-FISH, E10.5, E11.5 and E14.5 embryos from CD1 mice were collected, fixed, embedded, sectioned and processed as previously described ( Morey et al., 2007 ), except that sections were cut at 6 μm. Fosmid clones ( Fig. 1 A; Table S1 ) were prepared and labelled as previously described ( Morey et al., 2007 ). Between 160 and 240 ng of biotin- and digoxigenin-labelled fosmid probes were used per slide, with 16-24 μg of mouse Cot-1 DNA (Invitrogen) and 10 μg salmon sperm DNA. Image analysis For 3D analysis of tissue sections by conventional microscopy, slides were imaged with a Hamamatsu Orca AG CCD camera (Hamamatsu Photonics), Zeiss Axioplan II fluorescence microscope with Plan-neofluar or Plan apochromat objectives, a Lumen 200 W metal halide light source (Prior Scientific Instruments) and Chroma #89014ET single excitation and emission filters (Chroma Technology Corporation) with the excitation and emission filters installed in Prior motorised filter wheels. A piezoelectrically driven objective mount (PIFOC model P-721, Physik Instrumente & Co, Karlsruhe) was used to control movement in the z dimension. Hardware control, image capture and analysis were performed using Volocity (PerkinElmer). Images were deconvolved using a calculated point spread function with the constrained iterative algorithm of Volocity (PerkinElmer). Image analysis was carried out using the Quantitation module of Volocity (PerkinElmer).
SIM imaging
Images were acquired using structured illumination microscopy (SIM) performed on an Eclipse Ti inverted microscope equipped with a Nikon Plan Apo TIRF objective (NA 1.49, oil immersion) and an Andor DU-897X-5254 camera. Laser lines at 405, 488 and 561 nm were used. Step size for z -stacks was set to 0.120 μm, which is well within the Nyquist criterion. For each focal plane, 15 images (five phases, three angles) were captured with the NIS-Elements software. SIM image processing and reconstruction were carried out using the N-SIM module of the NIS-Element Advanced Research software. Image analysis was carried out using the Quantitation module of Volocity (PerkinElmer) with x and y binning resolution of 32 nm.
3C library preparation
Limbs from ∼70 E11.5 embryos, three E11.5 embryos with the limbs and heads removed, and the heads of three E11.5 embryos were collected in 15 ml tubes with enough PBS to cover them and to dissociate the cells by repeated pipetting with enlarged tip ends. Cells were fixed with 1% formaldehyde for 10 min at room temperature (r.t.). Crosslinking was stopped with 125 mM glycine, for 5 min at r.t. followed by 15 min on ice. Cells were centrifuged at 400 g for 10 min at 4°C, supernatants removed and cell pellets flash frozen on dry ice. Cell pellets were treated as previously described ( Dostie and Dekker, 2007 ; Ferraiuolo et al., 2010 ; Williamson et al., 2014 ). Hin dIII-HF (NEB) was the restriction enzyme used to digest the crosslinked DNA. 5C primer and library design 5C primers covering the Usp22 (mm9, chr11: 60,917,307-61,003,268) and Shh (mm9, chr5: 28,317,087-30,005,000) regions were designed using ‘my5C.primer’ ( Lajoie et al., 2009 ) and the following parameters: optimal primer length of 30 nt, optimal TM of 65°C, default primer quality parameters (mer:800, U-blast:3, S-blasr:50). Primers were not designed for large (>20 kb) and small (1 genomic target. The Usp22 region was used to assess the success of each 5C experiment but was not used for further data normalisation or quantification. The universal A-key [CCATCTCATCCCTGCGTGTCTCCGACTCAG-(5C-specific)] and the P1-key tails [(5C-specific)-ATCACCGACTGCCCATAGAGAGG] were added to the forward and reverse 5C primers, respectively. Reverse 5C primers were phosphorylated at their 5′ ends. An alternating design consisting of 365 primers in the Shh region (182 forward and 183 reverse primers) was used. Primer sequences are listed in Table S6 . 5C library preparation 5C libraries were prepared and amplified with the A-key and P1-key primers as previously described ( Fraser et al., 2012 ). Briefly, 3C libraries were first titrated by PCR for quality control (single band, absence of primer dimers, etc.), and to verify that contacts were amplified at frequencies similar to those usually obtained from comparable libraries (same DNA amount from the same species and karyotype) ( Dostie and Dekker, 2007 ; Dostie, et al., 2007 ; Fraser, et al., 2010 ). We used 1-10 μg of 3C library per 5C ligation reaction. 5C primer stocks (20 μM) were diluted individually in water on ice, and mixed to a final concentration of 2 nM. Mixed diluted primers (1.7 μl) were combined with 1 μl of annealing buffer (10× NEBuffer 4, New England Biolabs) on ice in reaction tubes. To each tube 1.5 μg salmon testis DNA was added, followed by the 3C libraries and water to a final volume of 10 μl. Samples were denatured at 95°C for 5 min, and annealed at 55°C for 16 h. Ligation with Taq DNA ligase (10 U) was performed at 55°C for one hour. One tenth (3 μl) of each ligation was then PCR amplified individually with primers against the A-key and P1-key primer tails. We used 26 cycles based on dilution series showing linear PCR amplification within that cycle range. The products from three to five PCR reactions were pooled before purifying the DNA on MinElute columns (Qiagen). 5C libraries were quantified by bioanalyser (Agilent) and diluted to 26 pmol (for Ion PGM Sequencing 200 Kit v2.0). One microlitre of diluted 5C library was used for sequencing with an Ion PGM Sequencer. Samples were sequenced onto Ion 316 Chips following the Ion PGM Sequencing 200 Kit v2.0 protocols as recommended by the manufacturer (Life Technologies).
5C data analysis
Analysis of the 5C sequencing data was performed as previously described ( Berlivet et al., 2013 ). Sequencing data were processed through a Torrent 5C data transformation pipeline on Galaxy ( https://main.g2.bx.psu.edu/ ). Data were normalised by dividing the number of reads of each 5C contact by the total number of reads from the corresponding sequence run. All scales shown correspond to this ratio multiplied by 10 3 . For each experiment, the number of total reads, and of used reads, is provided in Table S7 . The unprocessed heat maps of the normalised 5C datasets can be found in Fig. S4 .
📊 Figures
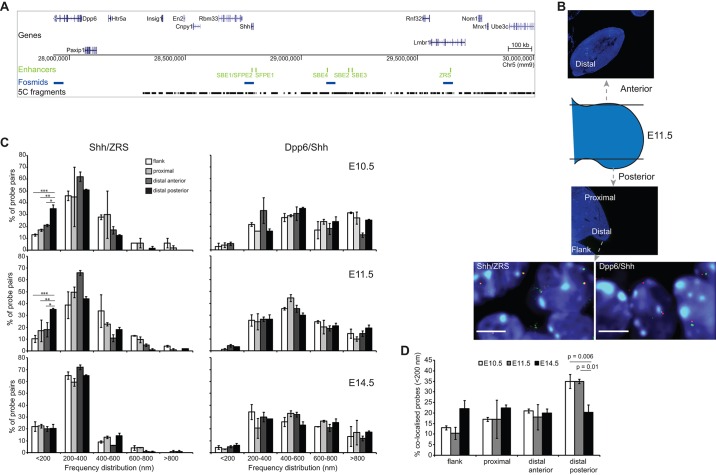
Fig. 1.
ZRS- Shh proximity in the ZPA at E10.5 and E11.5. (A) Location of genes over a 2u2005Mb murine genomic locus containing Shh , with the position of tissue-specific Shh enhancers shown below in green. T...
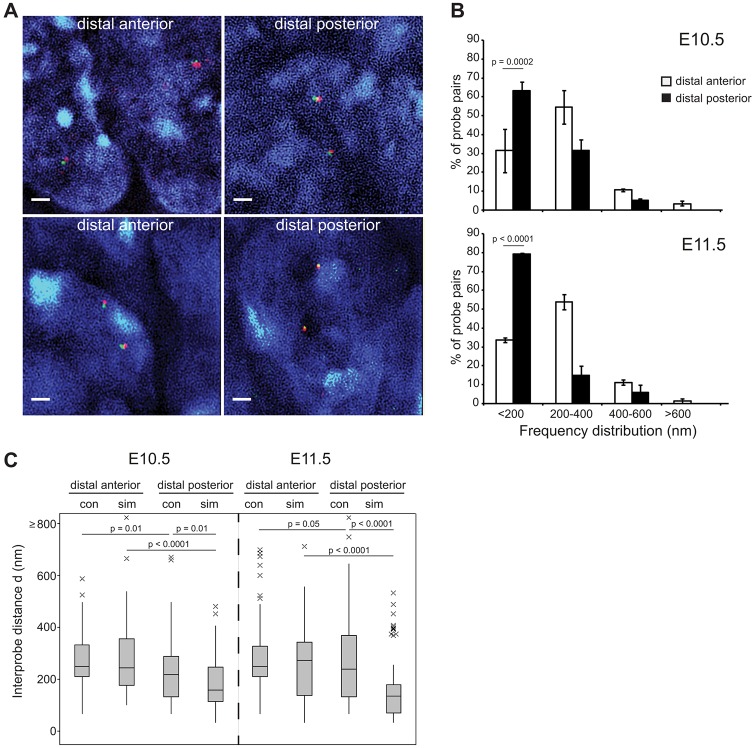
Fig. 2.
Super-resolution imaging identifies the majority of Shh -ZRS probes as colocalised in ZPA tissue. (A) Nuclei captured by super-resolution SIM imaging from the distal forelimb of E10.5 (top row) and E1...
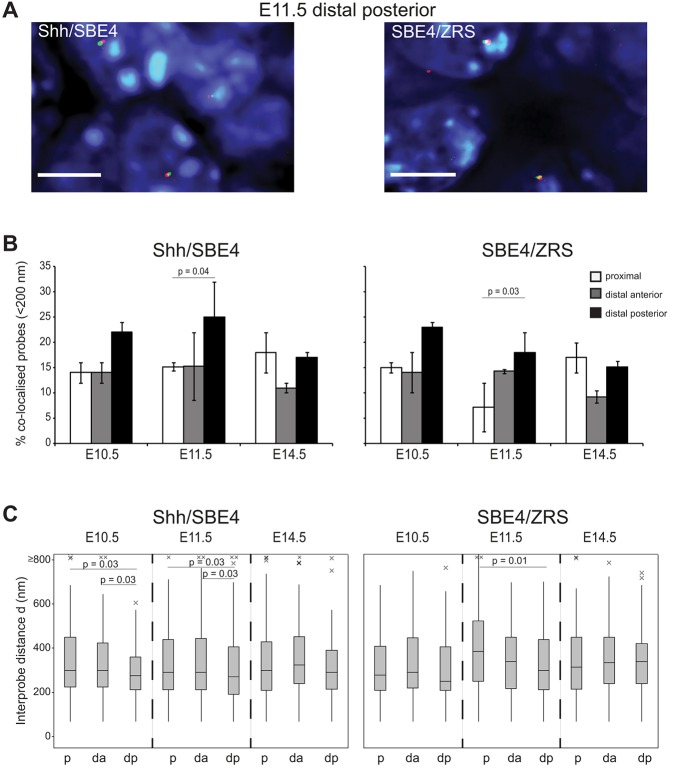
Fig. 3.
The Shh -ZRS regulatory domain is maintained in a compact chromatin conformation in expressing and non-expressing tissue. (A) Images of representative nuclei from E11.5 ZPA tissue showing FISH signals...
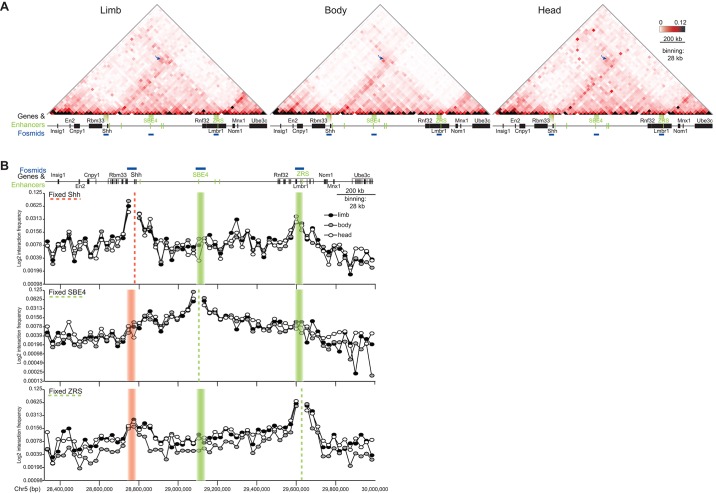
Fig. 4.
5C-seq identifies enriched interactions between Shh and ZRS in E11.5 embryos. (A) Heat maps showing 5C data from cells of the limbs, bodies and heads of E11.5 embryos, across the 1.7-Mb Shh region sho...
Figure images are served from the NIH/NLM PubMed Central Open Access Subset or Europe PMC; copyright remains with the publishers and authors.
💬 Discussion
0 commentsNo comments yet. Be the first to start a discussion!
Leave a Comment