Abstract
3D STORM is one of the leading methods for super-resolution imaging, with resolution down to 10 nm in the lateral direction, and 30-50 nm in the axial direction. However, there is one important requirement to perform this type of imaging: making dye molecules blink. This usually relies on the utilization of complex buffers, containing different chemicals and sensitive enzymatic systems, limiting the reproducibility of the method. We report here that the commercial mounting medium Vectashield can be used for STORM of Alexa-647, and yields images comparable or superior to those obtained with more complex buffers, especially for 3D imaging. We expect that this advance will promote the versatile utilization of 3D STORM by removing one of its entry barriers, as well as provide a more reproducible way to compare optical setups and data processing algorithms.
🔬 Techniques
✨ Fluorophores
🧪 Sample Preparation
🔬 Cell Lines
🏭 Microscope Brands
🧪 Reagent Suppliers
🔴 Lasers
📷 Detectors
🔎 Objectives
🎨 Filters
💻 Software Details
🏛️ Research Organizations (ROR)
Affiliated research institutions:
📋 Methods
2.1.
Optical setup
Imaging was performed on a modified Olympus IX71 inverted microscope. Lasers at 641 nm (Coherent, CUBE 640–100C) 488 nm (Coherent Sapphire), and 561 nm (Coherent Sapphire) were reflected by a multiband dichroic (89100bs, Chroma) onto the back aperture of a 100x 1.3 NA oil objective (Olympus, UplanFL) mounted on a piezo objective scanner (P-725 PIFOC, Physik Instrumente). The collected fluorescence from the sample was filtered using a bandpass emission filter (ET700/75, ET600/75 and ET525/50, all Chroma), for far-red dyes, red dyes and green dyes respectively) and imaged onto an EMCCD camera (IxonEM+, Andor) with a 100 nm pixel size and using the conventional CCD amplifier at a frame rate of 25 frames per second. Laser intensity on the sample was ≈ 1–2 kW.cm −2 and 10,000–20,000 frames were typically recorded for a total imaging time of ≈ 6–12 minutes. For 3D imaging, a cylindrical lens (f = 1000 mm, Thorlabs LJ1516RM-A) was added to the imaging path to enable the z-localization of fluorophores via astigmatic shaping of the point spread function [ 17 ], using one arm of an Optosplit system (CAIRN) and placing the cylindrical lens at the position typically occupied by the fluorescence filter, which is close to the Fourier plane. 2.2.
Sample preparation African green monkey kidney cells
COS-7 were cultured in DMEM supplemented with 10% FBS (Sigma-Aldrich Aldrich) in a cell culture incubator (37°C and 5% CO2) and plated at low confluency on cleaned 25 mm size 1 cover-glass (Menzell). Prior to fixation, all solutions were pre-warmed at 37°C: 24 hours after plating, cells were pre-extracted for 10 s in 0.5% Triton X-100 (Triton) in BRB80 (80 mM PIPES, 1 mM MgCl 2 , 1 mM EGTA, adjusted to pH 6.8 with KOH) supplemented with 4 mM EGTA, washed in PBS, fixed for 10 min in − 20°C-Methanol (Sigma-Aldrich), and washed again in PBS. The samples were then blocked 30 minutes in 5% BSA, before being incubated for 1.5h at room temperature with 1:1000 mouse alpha-tubulin antibodies (Sigma-Aldrich, T5168) in PBS - 1% BSA - 0.2% Triton (PBST), followed by 3 washes with PBS-0.2% Triton, and then incubated for 45min in PBST with 1:1000 goat anti-mouse Alexa-647 F(ab)2 secondary antibody fragments (Life Technologies, A-21237). For the dye screening, the same protocol was used except the Alexa Fluor 647 secondary antibody was replaced by: Alexa-488 (Life Technologies, A-10684), Alexa-532 (Life Technologies, A-11002), Alexa-555 (Life Technologies, A-21425), Alexa-546 (Life Technologies, A-11018), Alexa-568 (Life Technologies, A-11019), Alexa-700 (Life Technologies, A-21036), Cy3 (Jackson ImmunoResearch, 115-165-146), Cy3.5 (Abcam, 97036), Cy5 (Life Technologies, M35011 ), CF-488 (Biotium, 20011), CF-647 (Biotium, 20281), Rhodamine-6G (ActiveMotif, 15075), Flip-565 (Abberior, 2-0002-202-4), and Atto-655 (Sigma-Aldrich-Aldrich 50283). For Cy3B (GE, PA06310) we directly conjugated the dye to a primary antibody (Sigma-Aldrich, T5168). Dy-647 was tested on cells transiently expressing SNAP-EB3, and incubated after fixation with BG-Dy647 (NEB S9137S). For CEP-152 imaging, U2OS cells (European Collection for Cell Cultures) were maintained in McCoy’s 5A GlutaMAX medium (Life Technologies) supplemented with 10% FBS in a cell culture incubator (37°C and 5% CO 2 ) and plated at low confluency on cleaned 25 mm size 1 cover-glass (Menzell). Fixation and immunostaining was performed similarly as for tubulin, except that the primary antibody used was anti-CEP152 produced in rabbit (Sigma-Aldrich, HPA039408) at 1:2000 in PBST, and the secondary antibody was Goat anti-rabbit Cy3 (Jackson ImmunoResearch, 111-165-144) at 1:1000 in PBST. Imaging was performed by placing the 25 mm coverslip into a holder, then pipetting 30 μ L of Vectashield (Vectorlab, H-1000) on top of it and adding a clean 18 mm coverslip to spread the Vectashield evenly. Alternatively, we used a mixture of Vectashield and 95% Glycerol - 50 mM TRIS pH8 (referred to hereafter as TRIS-Glycerol) obtained by adding 5% v/v TRIS 1 M pH 8 in Glycerol), or more complex buffers described bellow. After imaging, coverslips were briefly washed in PBS to remove residual Vectashield and kept in PBS containing antibiotics at 4°C until further imaging. Propyl Gallate (NPG) (Sigma-Aldrich, P3130) was prepared as a stock solution of Glycerol-NPG using 5% w/v NPG in 90% Glycerol, 10% v/v TRIS, pH 8. DABCO (Sigma-Aldrich, D27802 ) was prepared as a 1 M solution in TRIS and used to create a stock solution of Glycerol-DABCO (100 mM in 90% Glycerol, 10% TRIS, pH 8). alpha-Lipoic Acid ( α LA) (Sigma-Aldrich, 62320) was prepared as a 1M stock solution in TRIS 10% Ethanol (v/v) and then diluted to create a stock solution of Glycerol- α LA (100 mM in 90% Glycerol, 10% TRIS, pH 8). Thiodiglycol (2,2-thiodiethanol or TDE, Alfa Aesar, A17002) was mixed v/v with pure Vectashield. Vectashield absorption and emission spectra were measured on a fluorescence spectrometer (Jasco FP-8500) using ≈ 1 mL of pure Vectashield in a 10 mm fluorescence cuvette. Absorption was first measured from 300 nm to 700 nm, and emission was measured at 3 wavelengths close to the imaging wavelengths used: 405 nm, 560 nm and 630 nm, all with a 5 nm spectral width. 2.3. Data analysis 2.3.1.
Show full methods section
2.1.
Optical setup
Imaging was performed on a modified Olympus IX71 inverted microscope. Lasers at 641 nm (Coherent, CUBE 640–100C) 488 nm (Coherent Sapphire), and 561 nm (Coherent Sapphire) were reflected by a multiband dichroic (89100bs, Chroma) onto the back aperture of a 100x 1.3 NA oil objective (Olympus, UplanFL) mounted on a piezo objective scanner (P-725 PIFOC, Physik Instrumente). The collected fluorescence from the sample was filtered using a bandpass emission filter (ET700/75, ET600/75 and ET525/50, all Chroma), for far-red dyes, red dyes and green dyes respectively) and imaged onto an EMCCD camera (IxonEM+, Andor) with a 100 nm pixel size and using the conventional CCD amplifier at a frame rate of 25 frames per second. Laser intensity on the sample was ≈ 1–2 kW.cm −2 and 10,000–20,000 frames were typically recorded for a total imaging time of ≈ 6–12 minutes. For 3D imaging, a cylindrical lens (f = 1000 mm, Thorlabs LJ1516RM-A) was added to the imaging path to enable the z-localization of fluorophores via astigmatic shaping of the point spread function [ 17 ], using one arm of an Optosplit system (CAIRN) and placing the cylindrical lens at the position typically occupied by the fluorescence filter, which is close to the Fourier plane. 2.2.
Sample preparation African green monkey kidney cells
COS-7 were cultured in DMEM supplemented with 10% FBS (Sigma-Aldrich Aldrich) in a cell culture incubator (37°C and 5% CO2) and plated at low confluency on cleaned 25 mm size 1 cover-glass (Menzell). Prior to fixation, all solutions were pre-warmed at 37°C: 24 hours after plating, cells were pre-extracted for 10 s in 0.5% Triton X-100 (Triton) in BRB80 (80 mM PIPES, 1 mM MgCl 2 , 1 mM EGTA, adjusted to pH 6.8 with KOH) supplemented with 4 mM EGTA, washed in PBS, fixed for 10 min in − 20°C-Methanol (Sigma-Aldrich), and washed again in PBS. The samples were then blocked 30 minutes in 5% BSA, before being incubated for 1.5h at room temperature with 1:1000 mouse alpha-tubulin antibodies (Sigma-Aldrich, T5168) in PBS - 1% BSA - 0.2% Triton (PBST), followed by 3 washes with PBS-0.2% Triton, and then incubated for 45min in PBST with 1:1000 goat anti-mouse Alexa-647 F(ab)2 secondary antibody fragments (Life Technologies, A-21237). For the dye screening, the same protocol was used except the Alexa Fluor 647 secondary antibody was replaced by: Alexa-488 (Life Technologies, A-10684), Alexa-532 (Life Technologies, A-11002), Alexa-555 (Life Technologies, A-21425), Alexa-546 (Life Technologies, A-11018), Alexa-568 (Life Technologies, A-11019), Alexa-700 (Life Technologies, A-21036), Cy3 (Jackson ImmunoResearch, 115-165-146), Cy3.5 (Abcam, 97036), Cy5 (Life Technologies, M35011 ), CF-488 (Biotium, 20011), CF-647 (Biotium, 20281), Rhodamine-6G (ActiveMotif, 15075), Flip-565 (Abberior, 2-0002-202-4), and Atto-655 (Sigma-Aldrich-Aldrich 50283). For Cy3B (GE, PA06310) we directly conjugated the dye to a primary antibody (Sigma-Aldrich, T5168). Dy-647 was tested on cells transiently expressing SNAP-EB3, and incubated after fixation with BG-Dy647 (NEB S9137S). For CEP-152 imaging, U2OS cells (European Collection for Cell Cultures) were maintained in McCoy’s 5A GlutaMAX medium (Life Technologies) supplemented with 10% FBS in a cell culture incubator (37°C and 5% CO 2 ) and plated at low confluency on cleaned 25 mm size 1 cover-glass (Menzell). Fixation and immunostaining was performed similarly as for tubulin, except that the primary antibody used was anti-CEP152 produced in rabbit (Sigma-Aldrich, HPA039408) at 1:2000 in PBST, and the secondary antibody was Goat anti-rabbit Cy3 (Jackson ImmunoResearch, 111-165-144) at 1:1000 in PBST. Imaging was performed by placing the 25 mm coverslip into a holder, then pipetting 30 μ L of Vectashield (Vectorlab, H-1000) on top of it and adding a clean 18 mm coverslip to spread the Vectashield evenly. Alternatively, we used a mixture of Vectashield and 95% Glycerol - 50 mM TRIS pH8 (referred to hereafter as TRIS-Glycerol) obtained by adding 5% v/v TRIS 1 M pH 8 in Glycerol), or more complex buffers described bellow. After imaging, coverslips were briefly washed in PBS to remove residual Vectashield and kept in PBS containing antibiotics at 4°C until further imaging. Propyl Gallate (NPG) (Sigma-Aldrich, P3130) was prepared as a stock solution of Glycerol-NPG using 5% w/v NPG in 90% Glycerol, 10% v/v TRIS, pH 8. DABCO (Sigma-Aldrich, D27802 ) was prepared as a 1 M solution in TRIS and used to create a stock solution of Glycerol-DABCO (100 mM in 90% Glycerol, 10% TRIS, pH 8). alpha-Lipoic Acid ( α LA) (Sigma-Aldrich, 62320) was prepared as a 1M stock solution in TRIS 10% Ethanol (v/v) and then diluted to create a stock solution of Glycerol- α LA (100 mM in 90% Glycerol, 10% TRIS, pH 8). Thiodiglycol (2,2-thiodiethanol or TDE, Alfa Aesar, A17002) was mixed v/v with pure Vectashield. Vectashield absorption and emission spectra were measured on a fluorescence spectrometer (Jasco FP-8500) using ≈ 1 mL of pure Vectashield in a 10 mm fluorescence cuvette. Absorption was first measured from 300 nm to 700 nm, and emission was measured at 3 wavelengths close to the imaging wavelengths used: 405 nm, 560 nm and 630 nm, all with a 5 nm spectral width. 2.3. Data analysis 2.3.1.
2D imaging
Each peak with a high enough signal-to-noise ratio was fitted to a Gaussian function by nonlinear least-square fitting, and positions as well as photon counts were extracted from the fitted peaks for rendering and quantification purposes (Peakselector, courtesy of H. Hess). Peaks detected for more than 15 consecutive frames, as well as peaks localized with fewer than 1500 photons for Alexa 647, or 500 photons for the other dyes tested were removed from the analysis. Peaks detected in successive frames at a distance of less than 40 nm were considered as originating from a single molecule and grouped (see paragraph below for grouping details). Grouping of localizations in successive frames was performed using Matlab. Localized peaks were tracked in 2d (x–y) using a single particle tracking algorithm ( http://physics.georgetown.edu/matlab/index.html ) with a search radius of 40 – 50 nm, and all localizations in a single track were averaged to give a final molecular localization, and summed to give a molecular number of photons. The standard deviations of the x, y, (and z) positions were also calculated for each track containing between 5 and 15 points and used as a measure of localization precision. Molecules displaying unusually large standard deviations in z (typically, bigger than 40 nm) were discarded from the analysis. Drift correction was performed using Peakselector by measuring the mean vertical (resp horizontal) position of a straight horizontal (resp vertical) segment of microtubules as a function of frame number, performing a moving average over this function (moving average over 1000 frames), and subtracting the fitted function from the vertical (resp horizontal) coordinates of all the peaks. The data was rendered using Matlab (’hist3’ function) to bin the localizations in a 10 nm per pixel grid, and then a Gaussian blur of σ = 5 nm was added to obtain a smoother rendering using ImageJ ( rsb.info.nih.gov/ij/ ). 2.3.2. 3D imaging For 3D STORM, the width and height of the image of a single emitter as a function of depth was calibrated using fluorescent beads, according to [ 17 , 18 ]. Briefly, images of ≈ 10 beads were recorded at intervals of 20 nm using the objective piezo scanner, and fitted with an elliptical Gaussian function using Peakselector. The width vs. depth and height vs. depth of each bead was then fitted with a model function [ 17 ] ( Eq. (1) with w 0 , A, B, c and d as free parameters) using Matlab’s ”fit” function and the fit parameters for the different beads were averaged to give a calibration curve. (1) w x ( z ) = w 0 * 1 + ( ( x − c ) / d ) 2 + A ( ( x − c ) / d ) 3 + B ( ( x − c ) / d ) 4 Using this calibration data, we then created a z-position look-up-table relating width and height to z position for every combination of width ( w x i ) and height ( w y j ) in a given range ([ wx min : dw : wx max ], [ wy min : dw : wy max ]) by minimizing in z the distance M ( z ) i, j between each height-width couple ( w x i , w y j ) and the calibration data ( w x ( z ), w y ( z )) according to Eq. (2) [ 17 ] with Matlab’s ”fminsearch” function. The resulting minimum value M min was then used as a goodness of fit and saved in another look-up-table. (2) M ( z ) = ( w x m − w x ( z ) ) 2 + ( w y m − w y ( z ) ) 2 Finally, this z-position look-up-table was used to convert the measured width and height parameters from the fitted peaks into a z-coordinate. Peaks localized with a goodness of fit higher than a user-defined threshold (the lower the threshold, the higher the localization precision, but the lower the density) were discarded from the analysis (for the 3D image shown in section 3.2, around 10% of the localized peaks were discarded in this step). The data was then grouped using Matlab, and the final localizations were rendered using Peakselector, with the depth color-coded. Total processing time was ≈ 10 minutes per image.
📊 Figures
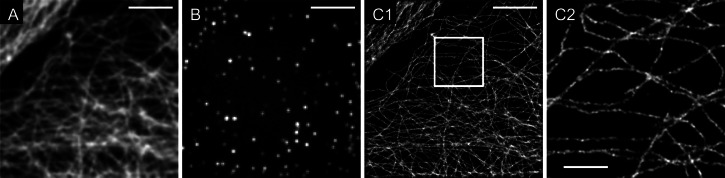
Fig. 1
STORM imaging of microtubules (see section 2.2 for more details) in Vectashield. (A): Widefield image (B): Single frame, (C1): Reconstructed STORM image, with blow-up on the ROI in (C2). scale-bar = 5...
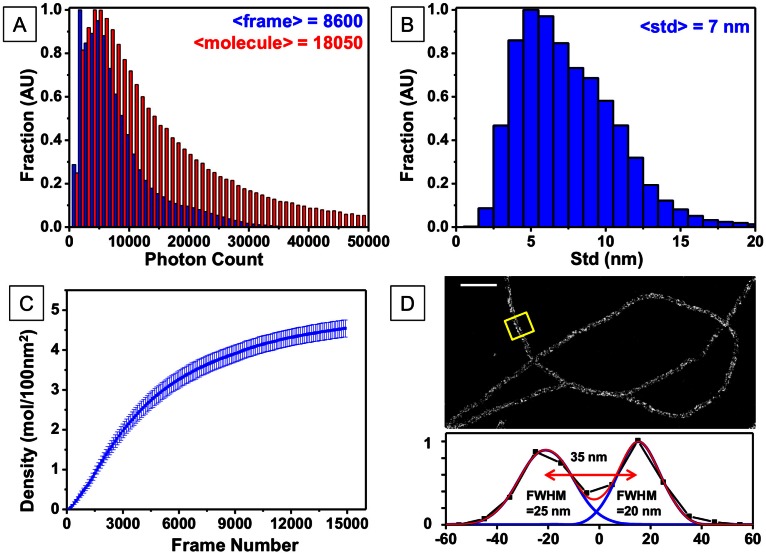
Fig. 2
Quantifying the quality of Vectashield as a STORM buffer for Alexa-647: (A) photon count distribution per frame (blue) and per molecule (red), obtained by grouping consecutive frame localizations and ...
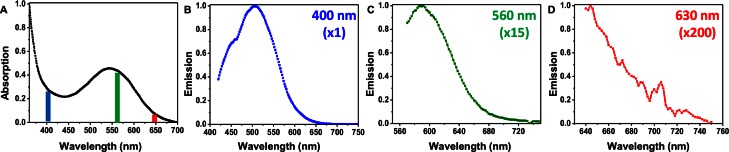
Fig. 3
(A) Absorption spectrum of Vectashield, as well as normalized emission spectra measured at 3 different wavelengths: 400 nm (B), 560 nm (C) and 630 nm (D) with normalization factor indicated in the top...
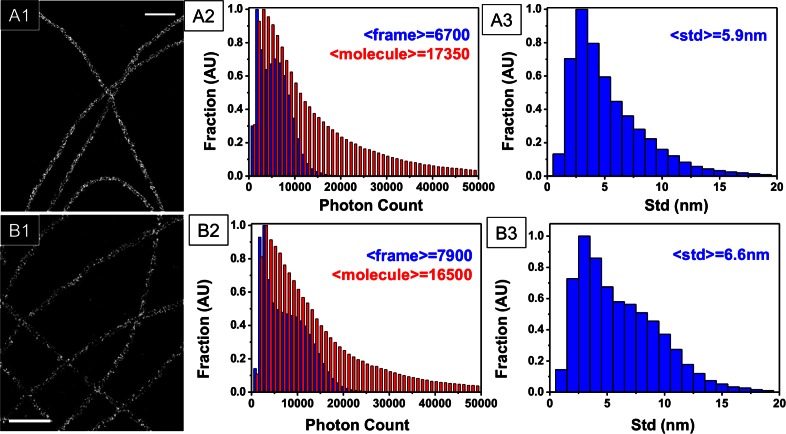
Fig. 4
STORM imaging of Alexa-647 stained microtubules in a Vectashield/TRIS-Glycerol mixture: (A) 50% Vectashield and (B) 25% Vectashield. The different panels represent: (1) STORM image reconstructed from ...
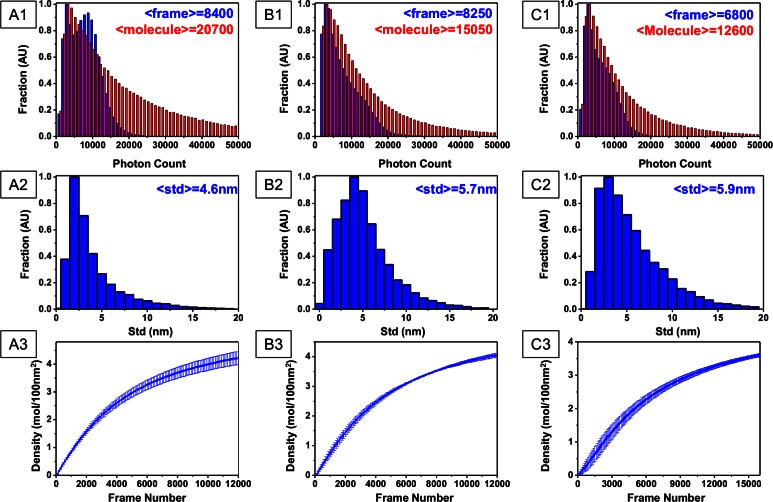
Fig. 5
Statistics on STORM imaging performed in 25% Vectashield - 75% TRIS-Glycerol in which were added 1% NPG (w/v) (A), 20 mM DABCO (B), and 10 mM Lipoic Acid (C). The different panels represent: (1) photo...
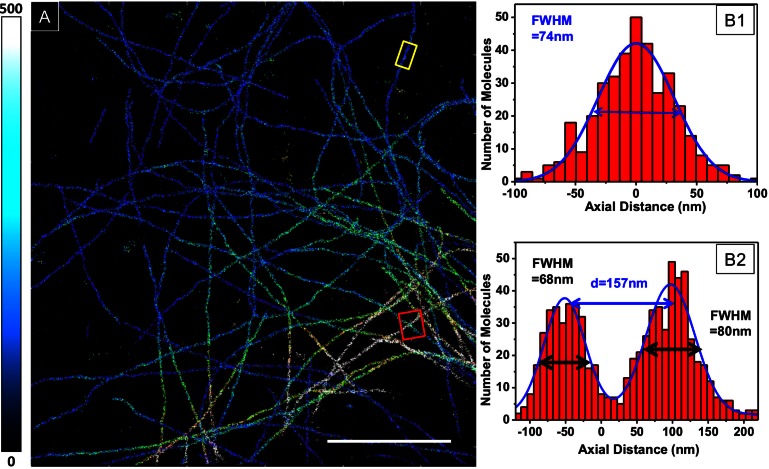
Fig. 6
3D STORM of Alexa-647-labeled microtubules in Vectashield: (A) Imaging performed in 25% Vectashield-75 % TRIS-Glycerol, scale-bar = 5 u03bc m. (B1&2): axial profile taken from the two regions delimite...
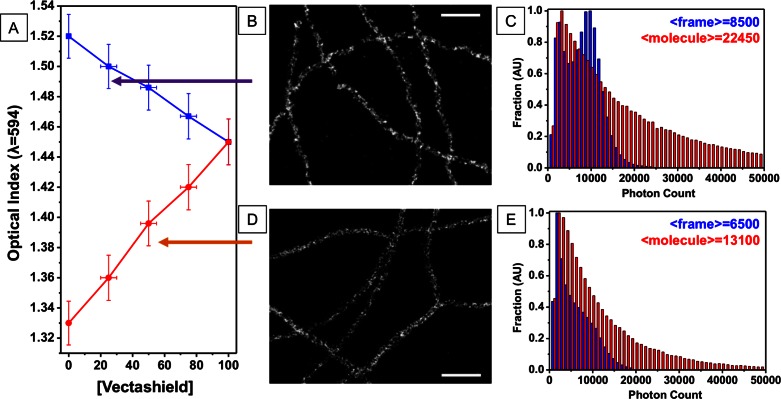
Fig. 7
(A) Index matching with Vectashield: Optical index as a function of Vectashield concentration starting from PBS (red) or TDE (blue), and imaging performed at n = 1.5 (adapted to oil objectives) and n=...
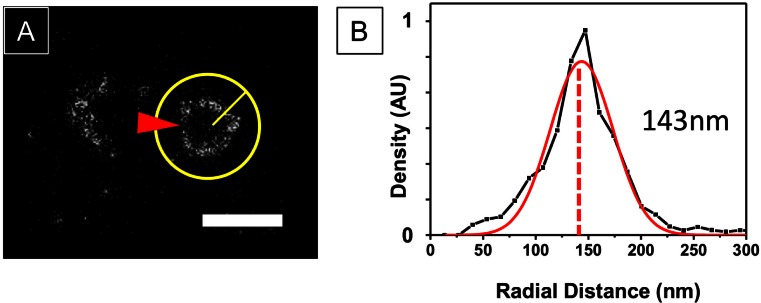
Fig. 8
(A) STORM image of CEP-152 stained with Cy3 using a buffer 40% Vectashield + 1% NPG + 20 mM DABCO, which improves the quality of Cy3 blinking. Scale-bar = 500 nm (B) Radial intensity distribution meas...
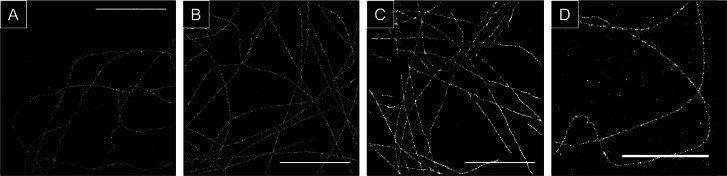
Fig. 9
STORM images obtained with the other working dyes (A) Alexa-555 in 20% Vectashield-80% TRIS-Glycerol (B) Cy-5 (C) CF-647 (D) Alexa-700, all in pure Vec-tashield. scale-bar = 5 u03bc m.
Figure images are served from the NIH/NLM PubMed Central Open Access Subset or Europe PMC; copyright remains with the publishers and authors.
💬 Discussion
0 commentsNo comments yet. Be the first to start a discussion!
Leave a Comment