Abstract
AbstractThe ubiquitous sliding clamp facilitates processivity of the replicative polymerase and acts as a platform to recruit proteins involved in replication, recombination and repair. While the dynamics of the E. coli β2-sliding clamp have been characterized in vitro, its in vivo stoichiometry and dynamics remain unclear. To probe both β2-clamp dynamics and stoichiometry in live E. coli cells, we use custom-built microfluidics in combination with single-molecule fluorescence microscopy and photoactivated fluorescence microscopy. We quantify the recruitment, binding and turnover of β2-sliding clamps on DNA during replication. These quantitative in vivo results demonstrate that numerous β2-clamps in E. coli remain on the DNA behind the replication fork for a protracted period of time, allowing them to form a docking platform for other enzymes involved in DNA metabolism.
🔬 Techniques
🧬 Organisms
💻 Software
✨ Fluorophores
🧪 Sample Preparation
🔬 Cell Lines
🏭 Microscope Brands
🧪 Reagent Suppliers
🔴 Lasers
📷 Detectors
🎨 Filters
💻 Software Details
🏛️ Research Organizations (ROR)
Affiliated research institutions:
📋 Methods
Strains and strain construction
All strains are derivatives of E. coli K12 AB1157. Strains were constructed either by P1 transduction 62 or by λ-Red recombination 63 . The Ypet – dnaN : tetR–mCerulean was constructed using P1 transduction by transducing the YPet–dnaN fusion 26 together with the adjacent kanR gene into a strain that contains a tetO array (50 kb clockwise from the dif-site), as well as the chromosomal integrated chimeric gene tetR–mCerulean 46 . The presence of the YPet–dnaN gene fusion was verified using the oligonucleotides: 5′- CGTTGGCACCTACCAGAAAG -3′ and 5′- ATGCCTGCCGTAAGATCGAG -3′. The sequence of the YPet–dnaN fusion was confirmed by DNA sequencing. A chromosomal fusion of the gene encoding for the photoactivatable fluorescent protein (PAmCherry1) 51 to the N terminus of the dnaN gene was created using λ-Red recombination 63 . The gene encoding for PAmCherry1 was amplified by PCR. The forward primer used contains an XmaI restriction site (5′- GCGGGCCCCGGGATGGTGAGCAAGGGCGAGGAG -3′). The reverse primer used contains a sequence coding for an 11 amino-acid linker and a SacI site (5′- CGATCGGAGCTCCGCGCTGCCAGAACCAGCGGCGGAGCCTGCCGACTTGTACAGCTCGTCCATGCC -3′). The PCR product was cloned into the backbone of pROD44 (ref. 26 ) containing a kanamycin-resistance cassette, flanked by frt sites, resulting in the template plasmid PAmCherry1. This plasmid was then used as a template plasmid for generating the insert sequence used during λ-Red recombination to create the PAmCherry–dnaN strain. The primer sequences used were: forward 5′- ACGATATCAAAGAAGATTTTTCAAATTTAATCAGAACATTGTCATCGTAACTGTAGGCTGGAGCTGCTTC -3′; reverse 5′- ACCTGTTGTAGCGGTTTTAATAAATGCTCACGTTCTACGGTAAATTTCATCGCGCTGCCAGAACCAGCGG -3′. The DNA fragment was gel purified and ~700 ng of the linear DNA was used for electroporation of AB1157 cells overexpressing λ-Red proteins from pKD46 (ref. 63 ). The correct insertion of the fragment into the chromosome of the resulting strain was assayed by PCR. The oligonucleotides used were 5′- CGTTGGCACCTACCAGAAAG -3′ and 5′- ATGCCTGCCGTAAGATCGAG -3′. The sequence of the fusion gene in this strain was confirmed by DNA sequencing. Construction of the mCherry–dnaN strain. The mCherry gene was amplified by PCR. The forward primer used for this contains an XmaI restriction site (5′- TAGGCTCCCGGGATGAGCAAGGGCGAGGAGGATAAC -3′). The reverse primer used contains a SacI site and sequence coding for an 11 amino-acid linker (5′- AAGGAGCTCGCGCTGCCAGAACCAGCGGCGGAGCCTGCCGACTTGTACAGCTCGTCCATGCC -3′). The Frt -flanked kanamycin-resistant gene was amplified using the following primers: forward 5′- TTACCCGGGCATATGAATATCCTCCTTAG -3′; reverse 5′- TTAGGATCCTGTAGGCTGGAGCTGCTTCG -3′. The resulting fragment was digested with XmaI and BamHI . The mCherry fragment and the kanamycin fragment were cloned into pUC18 between SacI and BamHI sites. The λ-Red recombination was performed as mentioned in the previous section using the primers: forward 5′- TATCAAAGAAGATTTTTCAAATTTAATCAGAACATTGTCATCGTAAACCTGTAGGCTGGAGCTGCTTCG -3′; reverse 5′- ACCTGTTGTAGCGGTTTTAATAAATGCTCACGTTCTACGGTAAATTTCATCGCGCTGCCAGAACCAGC -3′. The presence of the gene fusion was verified using oligonucleotides 5′- CGTTGGCACCTACCAGAAAG -3′ and 5′- ATGCCTGCCGTAAGATCGAG -3′. The sequence of the fusion gene in this strain was confirmed by DNA sequencing. The dnaX( τ )–YPet : mCherry–dnaN strain was constructed using P1 transduction by transducing the dnaX–YPet fusion 26 together with the adjacent kanR gene into a strain that contains the mCherry–dnaN gene fusion. The presence of the dnaX–YPet gene fusion after transduction was verified using the oligonucleotides: 5′- GAGCCTGCCAATGAGTTATC -3′ and 5′- GGCTTGCTTCATCAGGTTAC -3′ and similarly the mCherry–dnaN fusion using 5′- CGTTGGCACCTACCAGAAAG -3′ and 5′- ATGCCTGCCGTAAGATCGAG -3′. The sequences of the fusions in this strain were confirmed by DNA sequencing. Supplementary Tables 2 and 3 provide an overview of the plasmids used, as well as a summary of the different strains. The cell morphology and the doubling times of the fusion strains in LB and M9-glycerol growth medium were compared with AB1157 wild type. No significant differences were observed ( Supplementary Table 1 and Supplementary Fig. 1a ). The doubling times of the cells in the microfluidic device were similar (slightly faster) compared with cells grown in a shake flask ( Supplementary Fig. 2 ). We also confirmed that in the absence of IPTG (the experimental condition used during long time-lapse microscopy), no DNA-bound foci were detected for the YPet–dnaN : tetR–mCerulean strain ( Supplementary Fig. 1b ). M9 growth medium used in experiments The M9 growth medium used in experiments is as follows. One litre of M9 growth medium contains 10.5 g l −1 of autoclaved M9 broth (Sigma-Aldrich); 0.1 mM of autoclaved CaCl 2 (Sigma-Aldrich); 0.1 mM of autoclaved MgSO 4 (J.T.Baker); 0.3% of filter-sterilized glycerol (Sigma-Aldrich) as carbon source; 0.1 g l −1 of filter-sterilized five amino acids, namely L -threonine, L -leucine, L -proline, L -histidine and L -arginine (all from Sigma-Aldrich) and 10 μl of 0.5% filter-sterilized thiamine (Sigma-Aldrich).
Show full methods section
Strains and strain construction
All strains are derivatives of E. coli K12 AB1157. Strains were constructed either by P1 transduction 62 or by λ-Red recombination 63 . The Ypet – dnaN : tetR–mCerulean was constructed using P1 transduction by transducing the YPet–dnaN fusion 26 together with the adjacent kanR gene into a strain that contains a tetO array (50 kb clockwise from the dif-site), as well as the chromosomal integrated chimeric gene tetR–mCerulean 46 . The presence of the YPet–dnaN gene fusion was verified using the oligonucleotides: 5′- CGTTGGCACCTACCAGAAAG -3′ and 5′- ATGCCTGCCGTAAGATCGAG -3′. The sequence of the YPet–dnaN fusion was confirmed by DNA sequencing. A chromosomal fusion of the gene encoding for the photoactivatable fluorescent protein (PAmCherry1) 51 to the N terminus of the dnaN gene was created using λ-Red recombination 63 . The gene encoding for PAmCherry1 was amplified by PCR. The forward primer used contains an XmaI restriction site (5′- GCGGGCCCCGGGATGGTGAGCAAGGGCGAGGAG -3′). The reverse primer used contains a sequence coding for an 11 amino-acid linker and a SacI site (5′- CGATCGGAGCTCCGCGCTGCCAGAACCAGCGGCGGAGCCTGCCGACTTGTACAGCTCGTCCATGCC -3′). The PCR product was cloned into the backbone of pROD44 (ref. 26 ) containing a kanamycin-resistance cassette, flanked by frt sites, resulting in the template plasmid PAmCherry1. This plasmid was then used as a template plasmid for generating the insert sequence used during λ-Red recombination to create the PAmCherry–dnaN strain. The primer sequences used were: forward 5′- ACGATATCAAAGAAGATTTTTCAAATTTAATCAGAACATTGTCATCGTAACTGTAGGCTGGAGCTGCTTC -3′; reverse 5′- ACCTGTTGTAGCGGTTTTAATAAATGCTCACGTTCTACGGTAAATTTCATCGCGCTGCCAGAACCAGCGG -3′. The DNA fragment was gel purified and ~700 ng of the linear DNA was used for electroporation of AB1157 cells overexpressing λ-Red proteins from pKD46 (ref. 63 ). The correct insertion of the fragment into the chromosome of the resulting strain was assayed by PCR. The oligonucleotides used were 5′- CGTTGGCACCTACCAGAAAG -3′ and 5′- ATGCCTGCCGTAAGATCGAG -3′. The sequence of the fusion gene in this strain was confirmed by DNA sequencing. Construction of the mCherry–dnaN strain. The mCherry gene was amplified by PCR. The forward primer used for this contains an XmaI restriction site (5′- TAGGCTCCCGGGATGAGCAAGGGCGAGGAGGATAAC -3′). The reverse primer used contains a SacI site and sequence coding for an 11 amino-acid linker (5′- AAGGAGCTCGCGCTGCCAGAACCAGCGGCGGAGCCTGCCGACTTGTACAGCTCGTCCATGCC -3′). The Frt -flanked kanamycin-resistant gene was amplified using the following primers: forward 5′- TTACCCGGGCATATGAATATCCTCCTTAG -3′; reverse 5′- TTAGGATCCTGTAGGCTGGAGCTGCTTCG -3′. The resulting fragment was digested with XmaI and BamHI . The mCherry fragment and the kanamycin fragment were cloned into pUC18 between SacI and BamHI sites. The λ-Red recombination was performed as mentioned in the previous section using the primers: forward 5′- TATCAAAGAAGATTTTTCAAATTTAATCAGAACATTGTCATCGTAAACCTGTAGGCTGGAGCTGCTTCG -3′; reverse 5′- ACCTGTTGTAGCGGTTTTAATAAATGCTCACGTTCTACGGTAAATTTCATCGCGCTGCCAGAACCAGC -3′. The presence of the gene fusion was verified using oligonucleotides 5′- CGTTGGCACCTACCAGAAAG -3′ and 5′- ATGCCTGCCGTAAGATCGAG -3′. The sequence of the fusion gene in this strain was confirmed by DNA sequencing. The dnaX( τ )–YPet : mCherry–dnaN strain was constructed using P1 transduction by transducing the dnaX–YPet fusion 26 together with the adjacent kanR gene into a strain that contains the mCherry–dnaN gene fusion. The presence of the dnaX–YPet gene fusion after transduction was verified using the oligonucleotides: 5′- GAGCCTGCCAATGAGTTATC -3′ and 5′- GGCTTGCTTCATCAGGTTAC -3′ and similarly the mCherry–dnaN fusion using 5′- CGTTGGCACCTACCAGAAAG -3′ and 5′- ATGCCTGCCGTAAGATCGAG -3′. The sequences of the fusions in this strain were confirmed by DNA sequencing. Supplementary Tables 2 and 3 provide an overview of the plasmids used, as well as a summary of the different strains. The cell morphology and the doubling times of the fusion strains in LB and M9-glycerol growth medium were compared with AB1157 wild type. No significant differences were observed ( Supplementary Table 1 and Supplementary Fig. 1a ). The doubling times of the cells in the microfluidic device were similar (slightly faster) compared with cells grown in a shake flask ( Supplementary Fig. 2 ). We also confirmed that in the absence of IPTG (the experimental condition used during long time-lapse microscopy), no DNA-bound foci were detected for the YPet–dnaN : tetR–mCerulean strain ( Supplementary Fig. 1b ). M9 growth medium used in experiments The M9 growth medium used in experiments is as follows. One litre of M9 growth medium contains 10.5 g l −1 of autoclaved M9 broth (Sigma-Aldrich); 0.1 mM of autoclaved CaCl 2 (Sigma-Aldrich); 0.1 mM of autoclaved MgSO 4 (J.T.Baker); 0.3% of filter-sterilized glycerol (Sigma-Aldrich) as carbon source; 0.1 g l −1 of filter-sterilized five amino acids, namely L -threonine, L -leucine, L -proline, L -histidine and L -arginine (all from Sigma-Aldrich) and 10 μl of 0.5% filter-sterilized thiamine (Sigma-Aldrich).
Microfluidics for extended time-lapse microscopy
We use our own design 43 of the previously published microfluidic device known as the mother machine 44 for cell immobilization during long time-lapse experiments. The reader is referred to Moolman et al . 43 for a detailed description of the complete fabrication process. Here, we only briefly outline the main steps involved. First, we use electron-beam lithography in combination with dry etching techniques to create the structure in silicon. Next, we make a negative mould of this structure in polydimethylsiloxane (PDMS). The PDMS mould is then used to fabricate the positive structure in PDMS, which is subsequently used for experiments.
Preparation of cells for microscopy
Cells were streaked on Luria-Bertani (LB) plates containing the appropriate antibiotic. Single colonies from these plates where inoculated overnight at 37 °C with shaking in M9 medium supplemented with 0.3% glycerol (Gly), essential nutrients together with the appropriate antibiotics. The subsequent day, the overnight culture was subcultured into the same medium and grown at 37 °C with shaking until an OD 600 ~0.2 was reached. Cells were concentrated by centrifugation for 2 min at 16,100 g . The subsequent steps are dependent on the type of microscopy experiment performed as outlined next. For agarose pad experiments, the supernatant was decanted and the pellet was resuspended in 100 μl M9-Gly supplemented with essential nutrients. The resuspended cells were subsequently vortexed for 2 s and immobilized on an M9-Gly 1.5% agarose pad between two coverslips. (The coverslips were ultrasonically cleaned in acetone and isopropyl alcohol and burned by a flame to minimize the fluorescent background before use). For microfluidic device experiments, the supernatant was decanted and the pellet was resuspended in 50 μl M9-Gly with essential nutrients and injected into the microfluidic device. After injection into the device, the device was centrifuged for 10 min at 2,500 g (Eppendorf 5810R) so as to load the cells into the growth channels. Following centrifugation, the device was mounted on the microscope with tubing attached and incubated for ~45 min at 37 °C. After incubation, fresh M9-Gly with essential nutrients and the appropriate antibiotics are flushed through the device. The syringe containing the medium is then attached to an automated syringe pump to continuously infuse fresh M9-Gly, essential nutrients and 0.2 mg ml −1 bovine serum albumin (BSA) through the device at a rate of 0.5 ml h −1 .
Microscope setup
All the images were acquired on a commercial Nikon Ti microscope equipped with a Nikon CFI Apo TIRF × 100, 1.49NA oil immersion objective and an Andor iXon 897 Electron Multiplying Charge Coupled Device (EMCCD) camera operated by a personal computer (PC) running Nikon NIS-elements software. Cell outlines were imaged using the standard Nikon brightfield halogen lamp and condenser components. The fluorescence excitation was performed using custom-built laser illumination. A Cobolt Fandango 515 nm continuous wave diode-pumped solid-state laser was used to excite YPet; Cobolt Jive 561 nm continuous wave diode-pumped solid-state laser was used to excite mCherry and PAmCherry, respectively. PAmCherry was activated by a Votran Stradus 405 nm. All the three laser beams were combined using dichroic mirrors (Chroma ZT405sp-xxr, 575dcspxr) and subsequently coupled into a single-mode optical fibre (KineFLEX). The output of the fibre was expanded and focused onto the back focal plane of the objective mounted on the microscope. Notch filters (Semrock NF03-405E, NF03-514E, NF03-561E) were used to eliminate any laser light leaking onto the camera. The emission of the different fluorescent proteins was projected onto the central part of the EMCCD camera using custom filter sets: Chroma z561, ET605/52m, zt561rdc (mCherry), Chroma z514, ET540/30m, zt514rd (YPet), Chroma zet405, ET480/40m, zt405rdc (CFP). A custom design commercial temperature control housing (Okolabs) enclosing the microscope body maintained the temperature at 37 °C. Sample position was controlled with a Nikon stage (TI-S-ER Motorized Stage Encoded, MEC56100) together with the Nikon Perfect Focus System to eliminate Z-drift during image acquisition.
Cell lysate preparation for intensity calibration
The cell lysate used for single-molecule intensity calibration was prepared as follows. Cells were grown overnight at 37 °C with shaking in M9 medium supplemented with 0.3% glycerol (Gly), essential nutrients together with the appropriate antibiotics. The subsequent day, the overnight culture was subcultured into the same medium and grown at 37 °C with shaking until an OD 600 ~0.5 was reached. The cells were collected by centrifugation at 6,000 g (Beckman JLA 9.1000 rotor) for 15 min. Cells were subsequently resuspended in 5 ml M9-Gly and essential nutrients. The cell suspension was French pressed (Constant Systems) twice at 20,000 p.s.i. The cell lysate was then spun down at 30,000 g (Beckman JA-17 rotor ) for 35 min. The supernatant was shock-frozen using liquid nitrogen and kept at 37 °C until needed.
Data acquisition
All data acquisition was performed on the same microscope setup. Image acquisition was performed with Nikon NIS-elements software. The acquisition protocol was dependent on the type of experiment performed as outlined next. Long time-lapse experiments were conducted as follows. The cell outlines were imaged using standard brightfield illumination. Subsequently, the sample was excited by laser excitation (515 nm) with an intensity of ~5 W cm −2 as calculated according to Grünwald et al . 64 The exposure time was set to 80 ms. The camera gain was set to 100. Brightfield and fluorescence images were acquired every 2.5 min. Data spanning ~10 h of measurement were acquired overnight. We conducted two types of PALM experiments. First, we determined the bleaching characteristic of PAmCherry under our experimental conditions, and second, we measured the unloading time of a single β 2 -clamp. PALM images were acquired as follows. First, the cell outlines were imaged by taking a single phase-contrast (PH) image using a commercial Nikon external phase ring configuration. The sample was then excited for a single frame (400 ms exposure time) by a 561 nm laser with an intensity of ~5 W cm −2 , calculated according to Grünwald et al . 64 This image was used to determine the auto-fluorescence level due to the sample before activation. Photoactivation of PAmCherry was done with a single pulse (5 s) of 405 nm with an intensity of ~2.5 W cm −2 , calculated according to Grünwald et al . 64 Subsequently, a post-activation time-lapse of images were acquired using the 561 nm laser at the same intensity at a frame rate of either ~700 ms (bleaching experiments) or 5 s (unloading experiments) with an exposure time of 400 ms per frame. Camera gain was set to 100.
Image analysis of long time-lapse experiments
Images were analysed with custom-written MATLAB software (MathWorks). Before any analysis, we subtract the uneven background using a rolling-ball filter 65 and subsequently corrected for illumination heterogeneity by using the previously measured laser beam profile 66 . We also align the brightfield and fluorescence signals with respect to each other with 1-pixel accuracy. X–Y drift is corrected in both the fluorescence and brightfield images by tracking a fiducial marker in the PDMS to within 1 pixel. Each drift-corrected region of interest, consisting out of a single growth channel, is analysed individually. The brightfield images are used to determine the cell poles of all the cells in a given frame. For the fluorescence signal, a kymograph of the fluorescence signal is constructed by summation of the pixel intensities per image perpendicular to the channel direction for each frame. This results in summed intensity information as a function of time per growth channel ( Fig. 2c ). We make use of the generated kymographs to determine individual replication and division cycles per cell ( Fig. 2d ). A post-processing step is subsequently performed to eliminate cells that did not match the following selection criteria: correct cell length, sufficient growth characteristics, observation of a complete cell cycle, clear fluorescence signal that both starts and ends in a diffuse state ( Fig. 2d ). The fluorescence images of the detected individual cells that pass the above selection criteria are analysed further. We base our fluorescence analysis on an image of an individual bacterium with its long axis aligned with the horizontal direction of the image. The width of the image is equal to the length of the bacterium. We fix the height of the image such that a sufficient area above and below the bacterium is included that is indicative of the auto-fluorescence of the sample. We analyse the fluorescent intensity counts of a single bacterium using the individual fluorescence kymographs of each cell (summed line-profiles) by calculating three types of image content for a specific bacterium, namely ‘background’, ‘foci’ and ‘cytoplasm’ ( Supplementary Fig. 3a ). In brief, we first estimate the background fluorescence from the sample using the signal outside the bacterium. We did not have to take into account auto-fluorescence from the bacterium itself, as we conducted our experiments using minimal medium, which results in negligible levels of cellular auto-fluorescence ( Supplementary Fig. 3b ). The intensity outside the bacterium is used for a threshold with the remaining pixels intensities being representative of the total bacterium fluorescent counts. We subsequently separate ‘cytoplasm’ and ‘foci’ signals by determining the median of the summed line profiles. The signal significantly above this value is attributed to foci, whereas the remainder (lower values) are treated as the fluorescence signal from the cytoplasm ( Supplementary Fig. 3a ). This results in an integrated intensity value for the foci and also for the cytoplasm.
Image analysis of PALM experiments
PALM data was analysed using custom-written MATLAB software (MathWorks) in combination with the freely available MicrobeTracker software 67 . Before any spot analysis, the fluorescence images are subjected to illumination correction and to alignment with respect to the phase-contrast (PH) images. The resulting corrected and aligned fluorescence images are then used during further analysis. Using the PH image, the different cells are detected in the field of view and their respective outlines are determined using MicrobeTracker. Subsequently, using the spot detection algorithm as described in Olivo-Marin 68 , the spots in each individual image of the fluorescence time-lapse series are detected, and the integrated intensity is determined by summing the pixel values of each spot 69 . The integrated intensities of the spots are followed as function of time. This results in individual time-lapse integrated intensity traces of single molecules ( Fig. 3c ). The cell outlines as determined previously are overlaid with the fluorescence images. Any foci that are not situated in a bacterial cell (false positives) are rejected from further analysis. Only cells that had a clear fluorescence intensity focus were analysed. This focus is indicative of DNA-bound clamps and thus DNA replication. Foci that exhibit multiple steps in fluorescence intensity are also rejected. For the remainder of the foci, the time it takes from the start of the data acquisition until spot disappearance is recorded ( Fig. 3c ). These calculated time differences are indicative of molecule unloading (or bleaching, depending on the time of acquisition) and analysed further as described in the following section. Monte Carlo simulation of β 2 -loading and unloading dynamics For illustrative purposes, we perform Monte Carlo simulations ( Fig. 5 ) starting with no clamps loaded and no primers formed ( ), and assuming the loading rate to be much faster than the rate of primer formation ( N p ≈0). In each small time-step dt , we let with probability dt and with probability dt . This is repeated until the replication time is reached, upon which the primer formation rate is set to zero.
Supplementary Material Supplementary Information Supplementary Figures 1-10, Supplementary Table 1-3, Supplementary Notes 1-10 and Supplementary References
📊 Figures
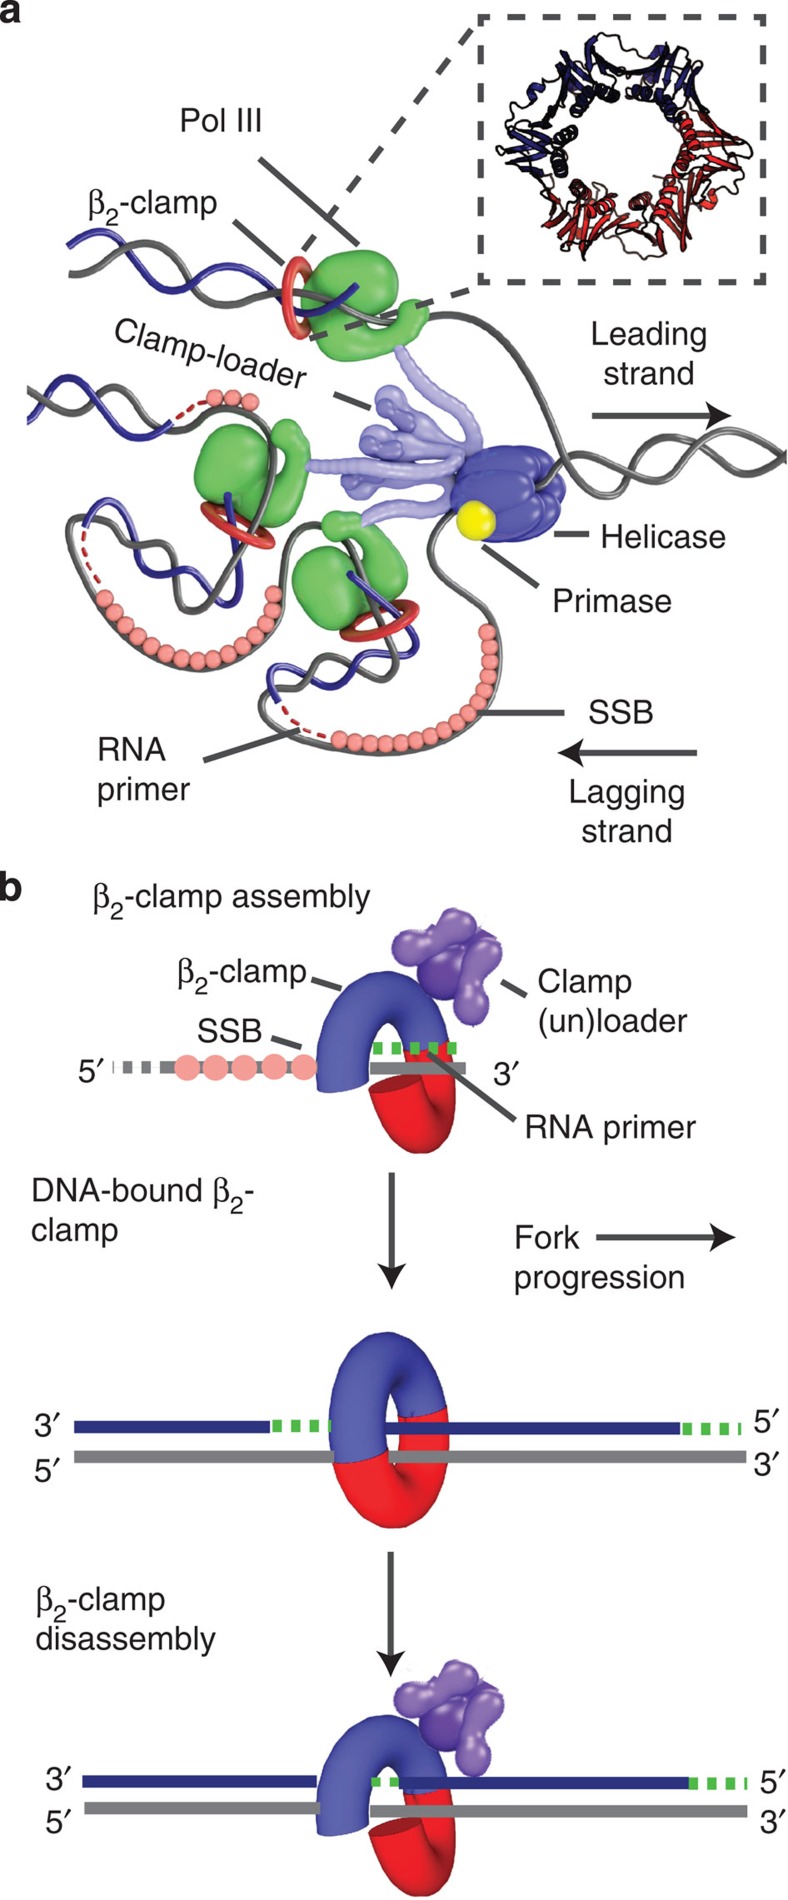
Figure 1
The E. coli replisome and u03b2 2 -clamp assembly during replication.
( a ) The position of the u03b2 2 -sliding clamp within the E. coli replisome complex. The helicase (DnaB) unwinds dsDNA ahead of the replicative polymerase (DNA Pol III), which subsequently duplicate...
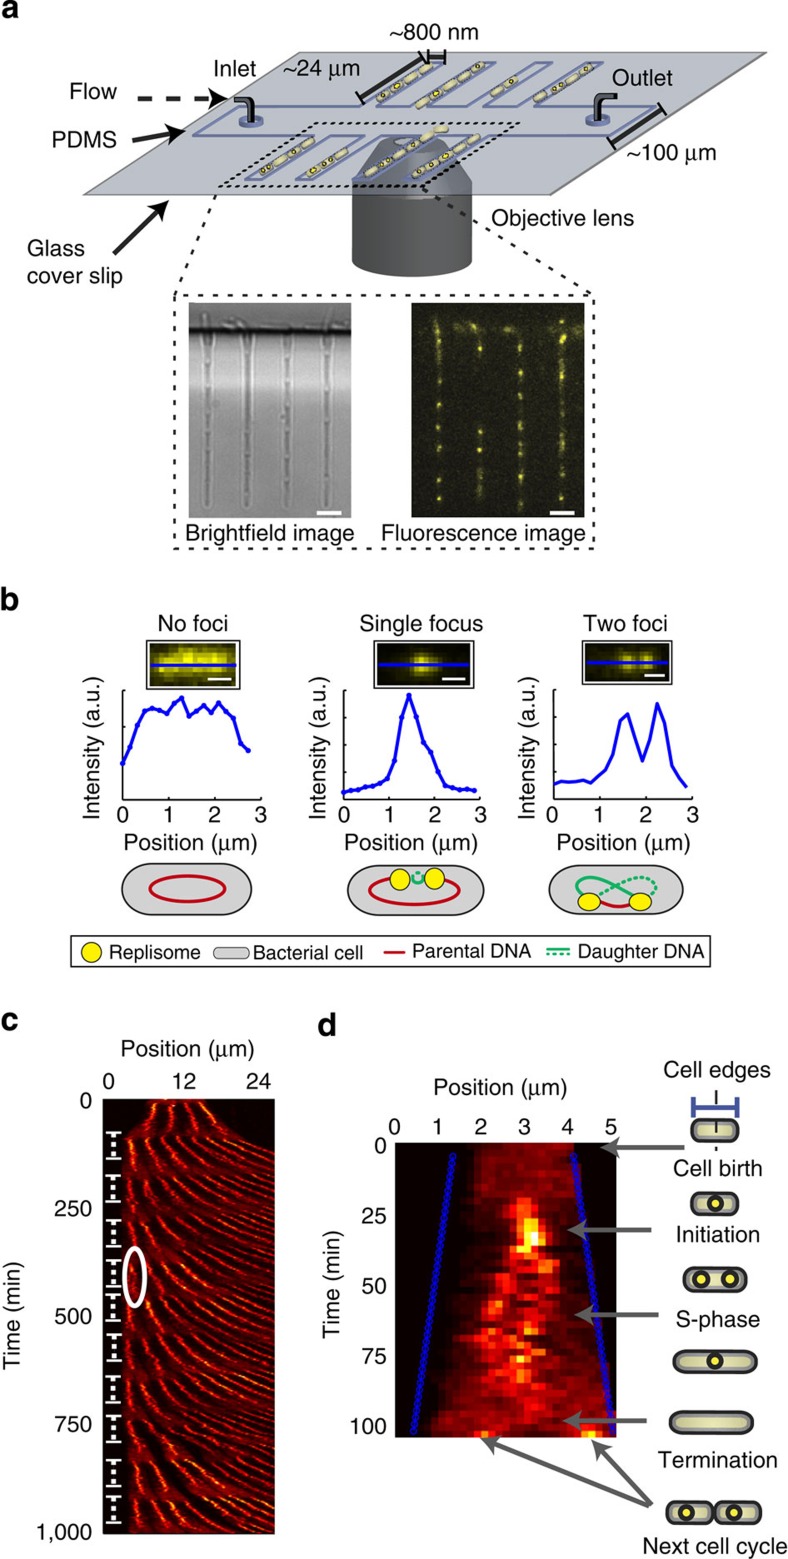
Figure 2
Long time-lapse fluorescence microscopy of the u03b2 2 -sliding clamp at the single-cell level utilizing microfluidics.
( a ) The microfluidic device used for performing long time-lapse fluorescence microscopy. E. coli cells are immobilized in growth channels perpendicular to a main trench through which growth medium i...
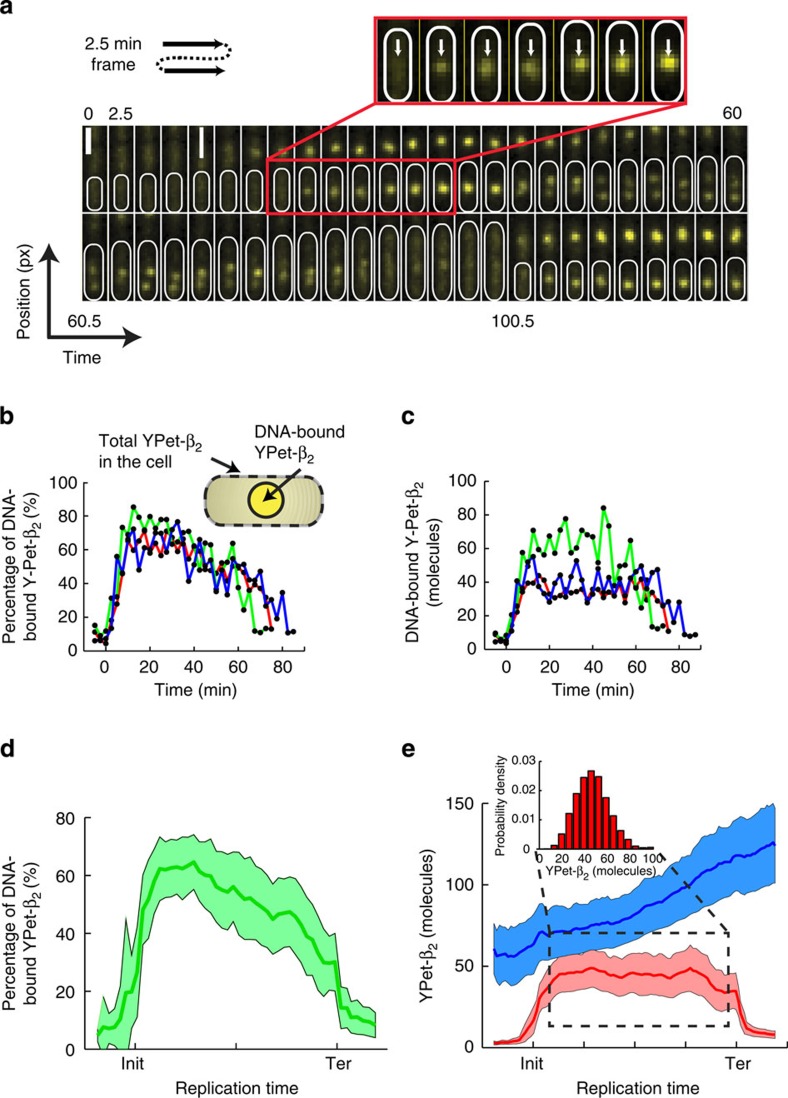
Figure 3
Quantification of the in vivo u03b2 2 -sliding clamp stoichiometry during replication.
( a ) A representative temporal montage of the YPetu2013 u03b2 2 fluorescence signal from before initiation until after cell division. A clear intensity increase is observed at the focus formation fol...
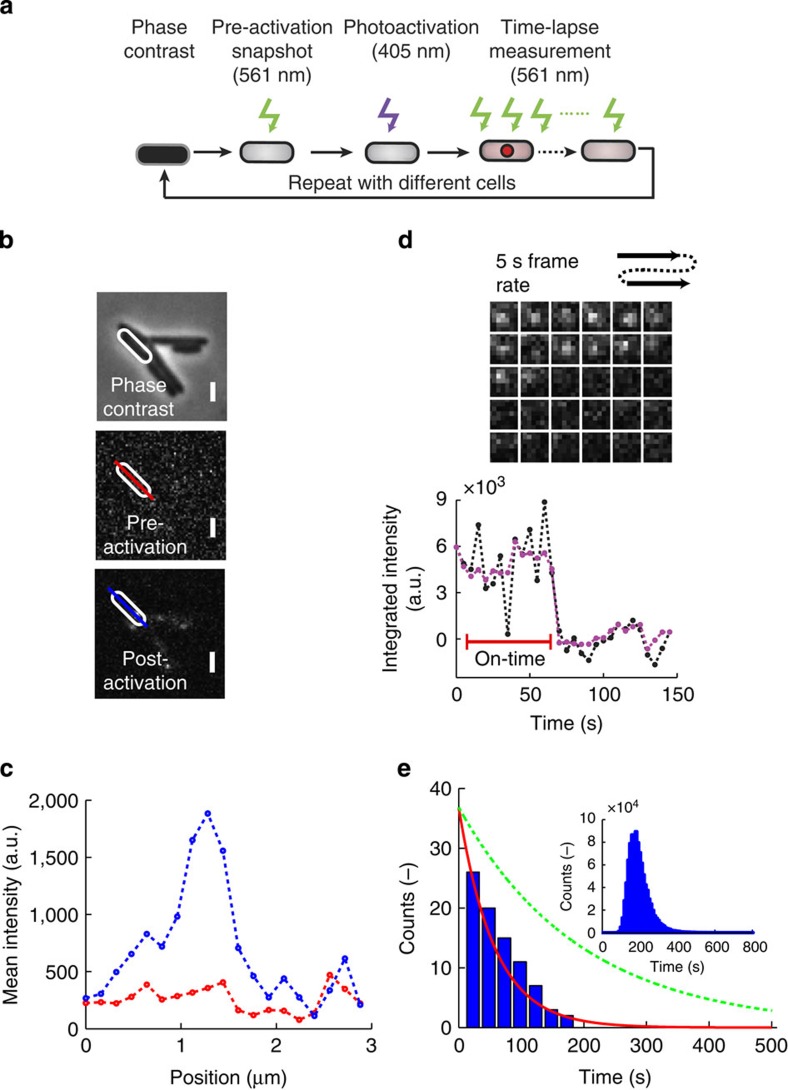
Figure 4
Direct measurement of the in vivo unloading time of the u03b2 2 -sliding clamp during replication.
( a ) Illustration of the measurement sequence to image a single u03b2 2 -clamp unloading event. First a phase-contrast (PH) and pre-activation snapshot are taken, after which molecules are activated ...
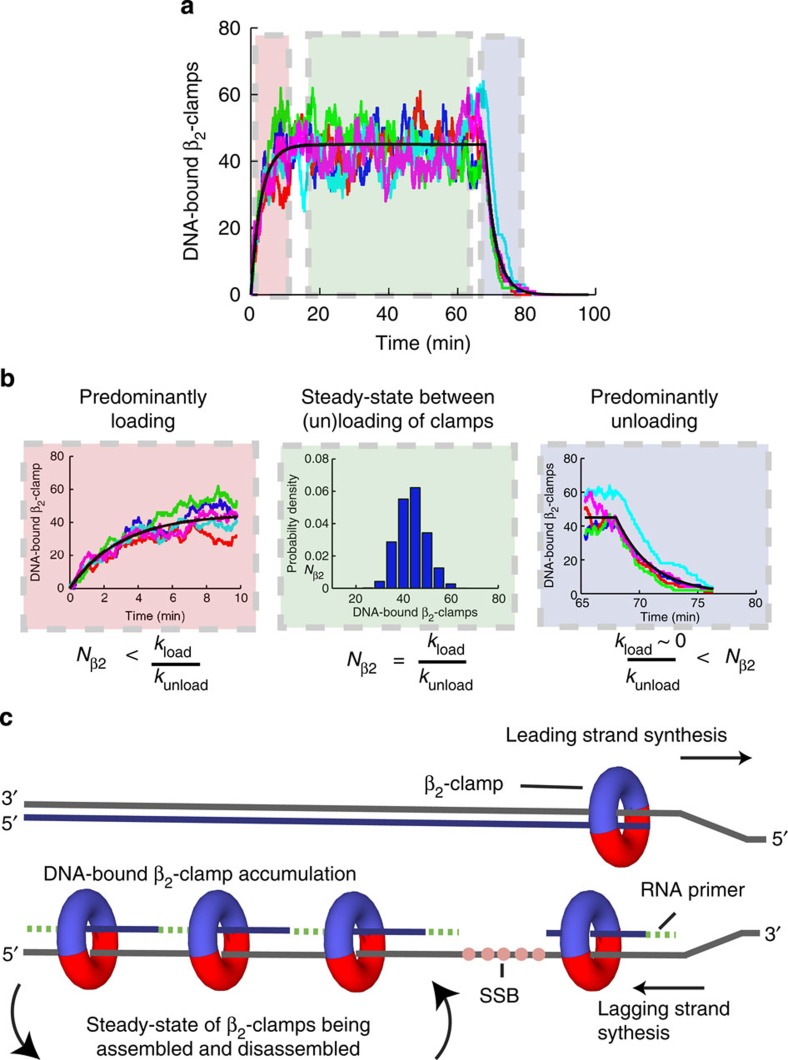
Figure 5
Describing the u03b2 2 -sliding clamp recycling process during replication.
( a ) A Monte Carlo simulation of the u03b2 2 -clamp assembly and disassembly reaction. For illustrative purposes, we perform a Monte Carlo simulation of the proposed model, utilizing the experimental...
Figure images are served from the NIH/NLM PubMed Central Open Access Subset or Europe PMC; copyright remains with the publishers and authors.
💬 Discussion
0 commentsNo comments yet. Be the first to start a discussion!
Leave a Comment