Abstract
Abstract Using real-time TIRF microscopy imaging, we identify sites of clathrin and dynamin-independent CLIC/GEEC (CG) endocytic vesicle formation. This allows spatio-temporal localisation of known molecules affecting CG endocytosis; GBF1 (a GEF for ARF1), ARF1 and CDC42 which appear sequentially over 60 s, preceding scission. In an RNAi screen for BAR domain proteins affecting CG endocytosis, IRSp53 and PICK1, known interactors of CDC42 and ARF1, respectively, were selected. Removal of IRSp53, a negative curvature sensing protein, abolishes CG endocytosis. Furthermore, the identification of ARP2/3 complex at CG endocytic sites, maintained in an inactive state reveals a function for PICK1, an ARP2/3 inhibitor. The spatio-temporal sequence of the arrival and disappearance of the molecules suggest a mechanism for a clathrin and dynamin-independent endocytic process. Coincident with the loss of PICK1 by GBF1-activated ARF1, CDC42 recruitment leads to the activation of IRSp53 and the ARP2/3 complex, resulting in a burst of F-actin polymerisation potentially powering scission.
🔬 Techniques
🧬 Organisms
💻 Software
✨ Fluorophores
🧪 Sample Preparation
🏭 Microscope Brands
🧪 Reagent Suppliers
📷 Detectors
💻 Software Details
💾 Data Repositories
🏛️ Research Organizations (ROR)
Affiliated research institutions:
📋 Methods
Cell culture, reagents, and plasmids See Supplementary Information. pH pulsing assay pH pulsing assay was adapted for Nikon TE 2000 TIRF microscope (for the details of the microscope, see microscope section in S.I.) from a similar assay as described previously 4 . Briefly, FR-AGS cells were plated on custom-designed coverslip bottom dishes and were transfected with SecGFP-GPI and X-FP constructs 12–14 h before the assay. The dishes were then fitted with a custom-designed holder to place inlet and outlet tubing. Tubing from a pH 7.4 (HEPES) and pH 5.5 (MES) buffers kept in a water bath at 38 °C went through a peristaltic flow controller (Bioscience Tools) into the cell chamber. The temperature of the cells in the dish was maintained at 30 °C by maintaining the buffers, the objective and the microscope (using a chamber) at appropriately high temperatures. Imaging at 30 °C slows the endocytic process to match the time resolution achieved by the flow setup (3 s). Images were captured using a script written in open source imaging software, Micromanager, to control the time of flow and imaging. Typically, buffers are exchanged every 3 s and three images are collected sequentially before the end of 3 s in two channels, GFP and RFP, using camera exposure of 100 ms. The chamber around the microscope was built with the help of NCBS Mechanical Workshop, AC department and Dr Manoj Matthew (NCBS-CIFF).
Endocytic assay
Mammalian endocytic assays: All population-based endocytic assays were performed as described 14 . For endocytic assays in mammalian cells, 2-day plated cells on poly-D-Lysine-coated dishes were used. The assays were performed in the water bath maintained at 37 °C. The media was removed and replaced with media containing fluorescently labelled probes at appropriate dilutions for the required time (TMR-Dextran was used at 1 mg/ml, α-GFP was used at 20 µg/ml, Cy3-Mov18 was used at 5 µg/ml and Tf was used at 10 µg/ml). The cells were then transferred to ice and washed with ice-cold medium 1 buffer (140 mM NaCl, 20 mM HEPES, 1 mM CaCl 2 , 1 mM MgCl 2 , 5 mM KCl, pH 7.4). The cells were then stripped for surface-bound Tf with ascorbate buffer (160 mM sodium ascorbate, 40 mM ascorbic acid, 1 mM MgCl 2 , 1 mM CaCl 2 , pH 4.5). In the case of GPI-AP (GFP-GPI and FR-GPI) uptake, the surface was removed using PI-PLC which cleaves GPI anchor 14 . Cells were treated with PI-PLC (50 µg/ml) for 1 h on ice. The cells were fixed with 2.5% paraformaldehyde and stained for surface TfR. BAR domain screen: RNAi screen for BDPs in Drosophila genome was done on S2R + cells stably expressing TfR 15 . Briefly, the cells were plated in a 12-well plate (0.5 million cells/well) for 1 h. The media was then replaced with 600 µl of serum-free media supplemented with appropriate dsRNA at (final amount, 10 µg) for 1 h, post which 600 µl of serum containing media was added. After 4 days of depletion, the cells were assayed for endocytosis. On the 4th day, cells were deadhered from the well by manual pipetting and plated on coverslip bottom dishes. Cells were pulsed with TMR-dextran diluted in serum containing media for 5 min. The cells were subsequently transferred to ice and washed with ice-cold medium 1 buffer (supplemented with 1 mg/ml BSA and glucose). The cells were then fixed using 2% paraformaldehyde (5 min on ice and 15 min at room temperature). dsRNA was prepared from the Drosophila Open Biosystems library v1 15 . HRP uptake and electron microscopy: WT and IRSp53−/− MEFs were serum starved for 45 min in the presence or absence of 10 μM LG186 compound. Cells were treated for 2 or 5 min at 37 °C with 10 mg/ml HRP in serum-free medium, rapidly washed with complete medium on ice and subsequently fixed with 2.5% glutaraldehyde in PBS. Peroxidase development and further processing were performed as described previously 23 . Cells were sectioned parallel to the substratum and viewed unstained on a Jeol 1011 (Tokyo, Japan) transmission electron microscope equipped with a Morada Soft Imaging camera (Olympus) at two-fold binning. Quantitation was performed as follows: for 5-min HRP uptake, images were captured at random across the monolayer by moving a defined distance across the grid to avoid user bias. For 2-min uptake, whole cells positive for HRP were imaged and montaged to generate a high-resolution image encompassing the entire cell. Five cells were imaged and montaged for each replicate. HRP-labelled elements per image or per cell profile were classified using the following criteria; vesicular elements including clathrin-coated vesicles and caveolae—circular profiles 200 nm in diameter; CLIC/GEEC–other profiles including tubules and small ring-shaped structures
Show full methods section
Cell culture, reagents, and plasmids See Supplementary Information. pH pulsing assay pH pulsing assay was adapted for Nikon TE 2000 TIRF microscope (for the details of the microscope, see microscope section in S.I.) from a similar assay as described previously 4 . Briefly, FR-AGS cells were plated on custom-designed coverslip bottom dishes and were transfected with SecGFP-GPI and X-FP constructs 12–14 h before the assay. The dishes were then fitted with a custom-designed holder to place inlet and outlet tubing. Tubing from a pH 7.4 (HEPES) and pH 5.5 (MES) buffers kept in a water bath at 38 °C went through a peristaltic flow controller (Bioscience Tools) into the cell chamber. The temperature of the cells in the dish was maintained at 30 °C by maintaining the buffers, the objective and the microscope (using a chamber) at appropriately high temperatures. Imaging at 30 °C slows the endocytic process to match the time resolution achieved by the flow setup (3 s). Images were captured using a script written in open source imaging software, Micromanager, to control the time of flow and imaging. Typically, buffers are exchanged every 3 s and three images are collected sequentially before the end of 3 s in two channels, GFP and RFP, using camera exposure of 100 ms. The chamber around the microscope was built with the help of NCBS Mechanical Workshop, AC department and Dr Manoj Matthew (NCBS-CIFF).
Endocytic assay
Mammalian endocytic assays: All population-based endocytic assays were performed as described 14 . For endocytic assays in mammalian cells, 2-day plated cells on poly-D-Lysine-coated dishes were used. The assays were performed in the water bath maintained at 37 °C. The media was removed and replaced with media containing fluorescently labelled probes at appropriate dilutions for the required time (TMR-Dextran was used at 1 mg/ml, α-GFP was used at 20 µg/ml, Cy3-Mov18 was used at 5 µg/ml and Tf was used at 10 µg/ml). The cells were then transferred to ice and washed with ice-cold medium 1 buffer (140 mM NaCl, 20 mM HEPES, 1 mM CaCl 2 , 1 mM MgCl 2 , 5 mM KCl, pH 7.4). The cells were then stripped for surface-bound Tf with ascorbate buffer (160 mM sodium ascorbate, 40 mM ascorbic acid, 1 mM MgCl 2 , 1 mM CaCl 2 , pH 4.5). In the case of GPI-AP (GFP-GPI and FR-GPI) uptake, the surface was removed using PI-PLC which cleaves GPI anchor 14 . Cells were treated with PI-PLC (50 µg/ml) for 1 h on ice. The cells were fixed with 2.5% paraformaldehyde and stained for surface TfR. BAR domain screen: RNAi screen for BDPs in Drosophila genome was done on S2R + cells stably expressing TfR 15 . Briefly, the cells were plated in a 12-well plate (0.5 million cells/well) for 1 h. The media was then replaced with 600 µl of serum-free media supplemented with appropriate dsRNA at (final amount, 10 µg) for 1 h, post which 600 µl of serum containing media was added. After 4 days of depletion, the cells were assayed for endocytosis. On the 4th day, cells were deadhered from the well by manual pipetting and plated on coverslip bottom dishes. Cells were pulsed with TMR-dextran diluted in serum containing media for 5 min. The cells were subsequently transferred to ice and washed with ice-cold medium 1 buffer (supplemented with 1 mg/ml BSA and glucose). The cells were then fixed using 2% paraformaldehyde (5 min on ice and 15 min at room temperature). dsRNA was prepared from the Drosophila Open Biosystems library v1 15 . HRP uptake and electron microscopy: WT and IRSp53−/− MEFs were serum starved for 45 min in the presence or absence of 10 μM LG186 compound. Cells were treated for 2 or 5 min at 37 °C with 10 mg/ml HRP in serum-free medium, rapidly washed with complete medium on ice and subsequently fixed with 2.5% glutaraldehyde in PBS. Peroxidase development and further processing were performed as described previously 23 . Cells were sectioned parallel to the substratum and viewed unstained on a Jeol 1011 (Tokyo, Japan) transmission electron microscope equipped with a Morada Soft Imaging camera (Olympus) at two-fold binning. Quantitation was performed as follows: for 5-min HRP uptake, images were captured at random across the monolayer by moving a defined distance across the grid to avoid user bias. For 2-min uptake, whole cells positive for HRP were imaged and montaged to generate a high-resolution image encompassing the entire cell. Five cells were imaged and montaged for each replicate. HRP-labelled elements per image or per cell profile were classified using the following criteria; vesicular elements including clathrin-coated vesicles and caveolae—circular profiles 200 nm in diameter; CLIC/GEEC–other profiles including tubules and small ring-shaped structures
📊 Figures
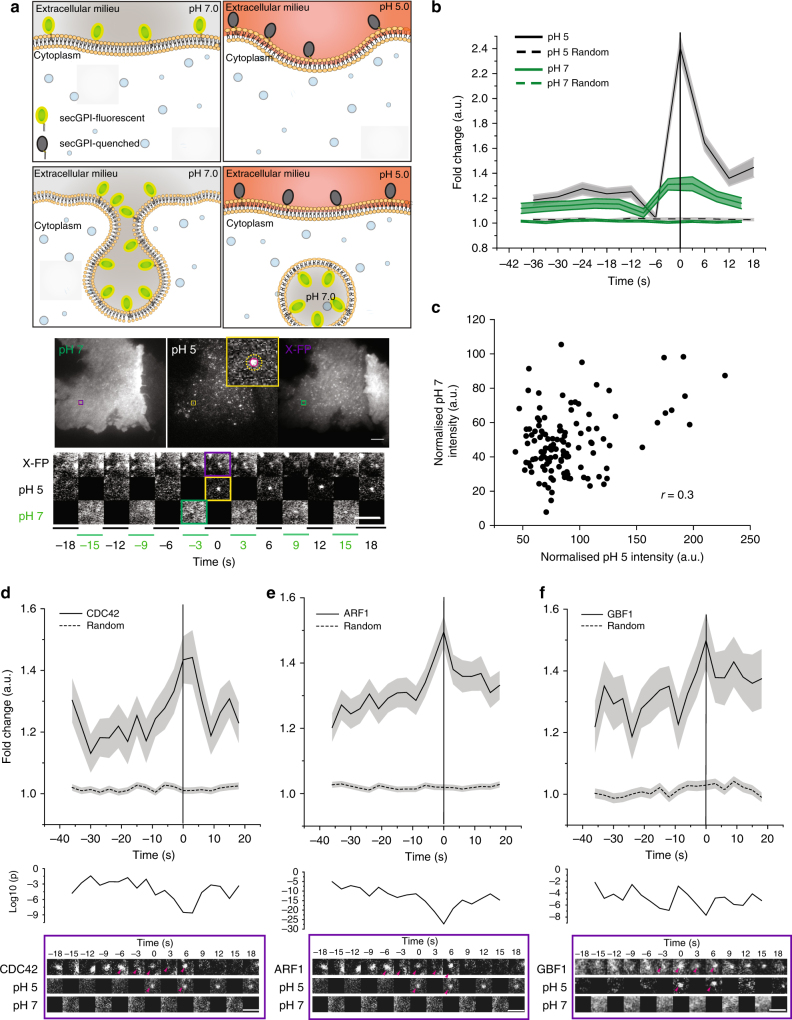
Fig. 1
Identification of newly formed SecGFP-GPI endocytic vesicles using a pH pulsing assay. a Schematic (top panel) of the pH pulsing assay depicting the effect of pH on SecGFP-GPI fluorescence during endo...
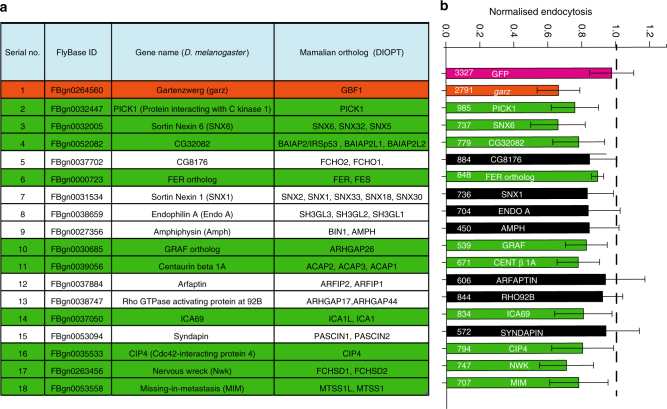
Fig. 2
RNAi screen reveals BAR domain proteins involved in CG endocytosis. a List of Drosophila proteins in the PFAM database that contained one of the following BAR domains, PFAM IDsu2014PF06456, PF09325, P...
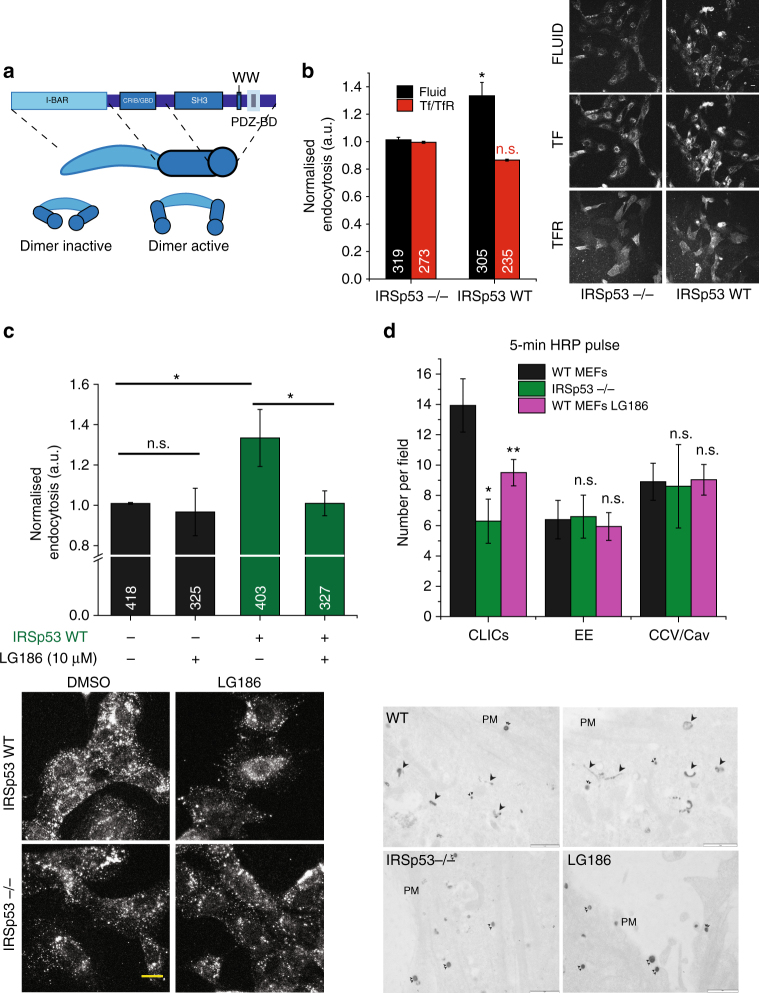
Fig. 3
IRSp53 is involved in CG endocytosis. a Schematic depicting the domain organisation of IRSp53. IRSp53 exists in an inactive dimer state, which upon binding to GTP-CDC42 is activated, allowing SH3 doma...
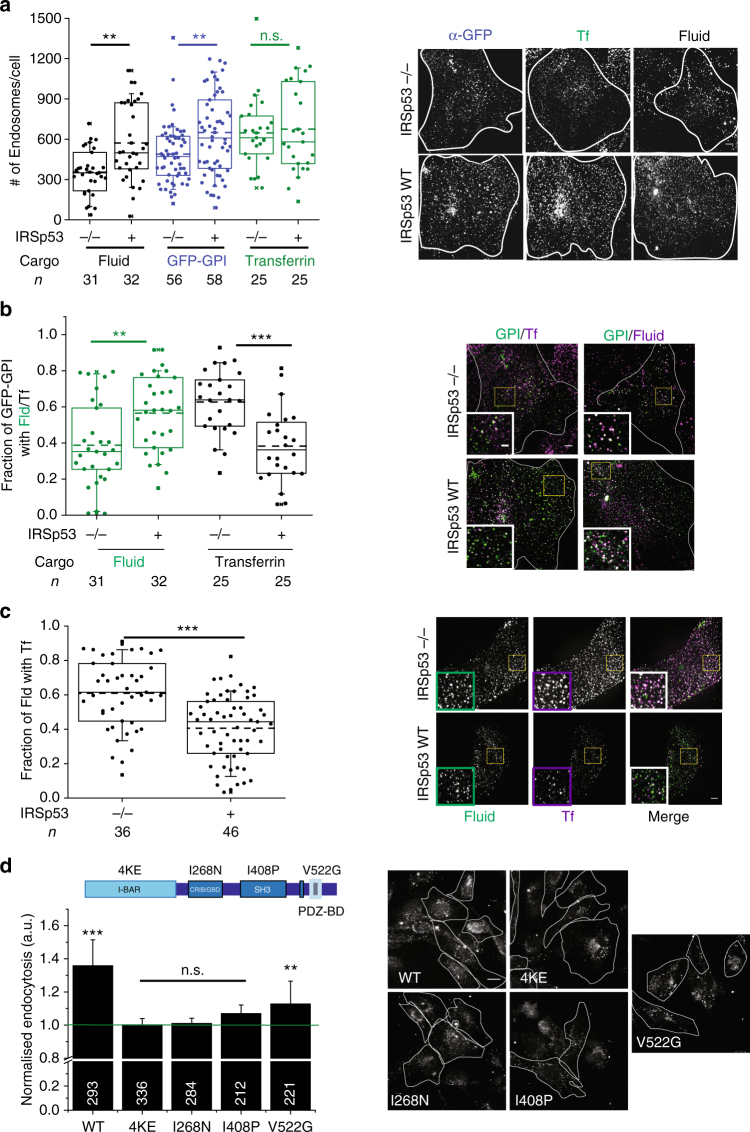
Fig. 4
CG pathway is abolished in the absence of IRSp53. a The box plot shows the number of endosomes per cells (left) for endocytosed GFP-GPI (u03b1-GFP Fab), fluid phase and TfR in IRSp53u2212/u2212 and IR...
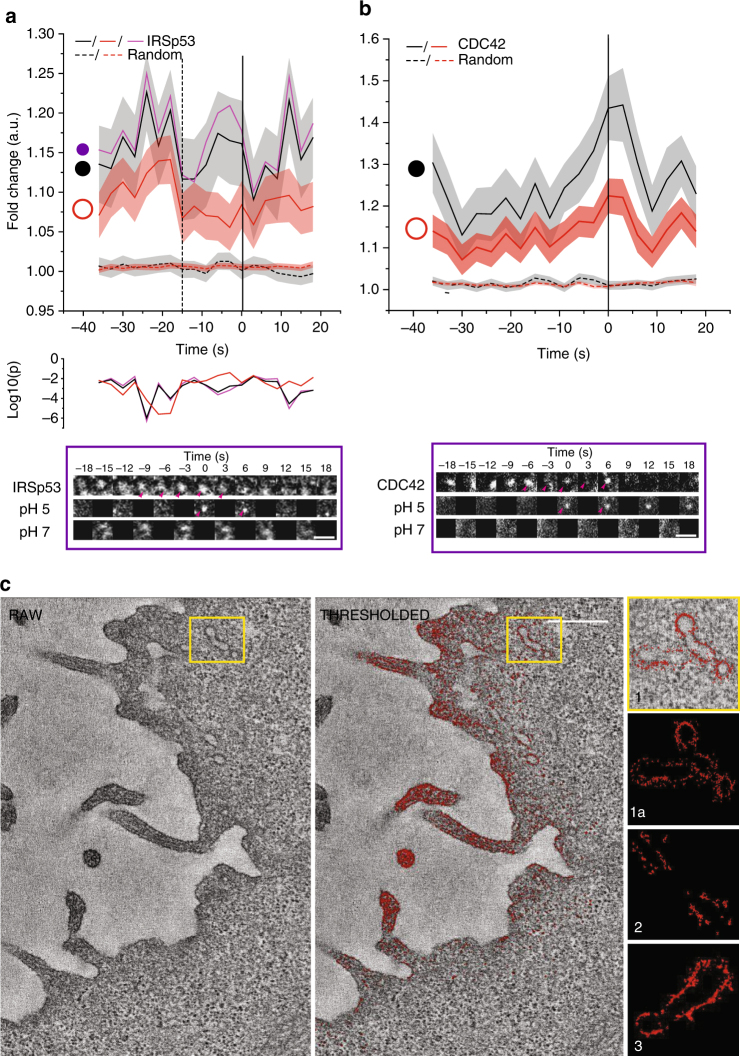
Fig. 5
IRSp53 is recruited to forming CG endosomes. a Graphs show the average normalised fluorescence intensity vs. time traces for the recruitment of three different regions [circles, violet, r =u2009170u20...
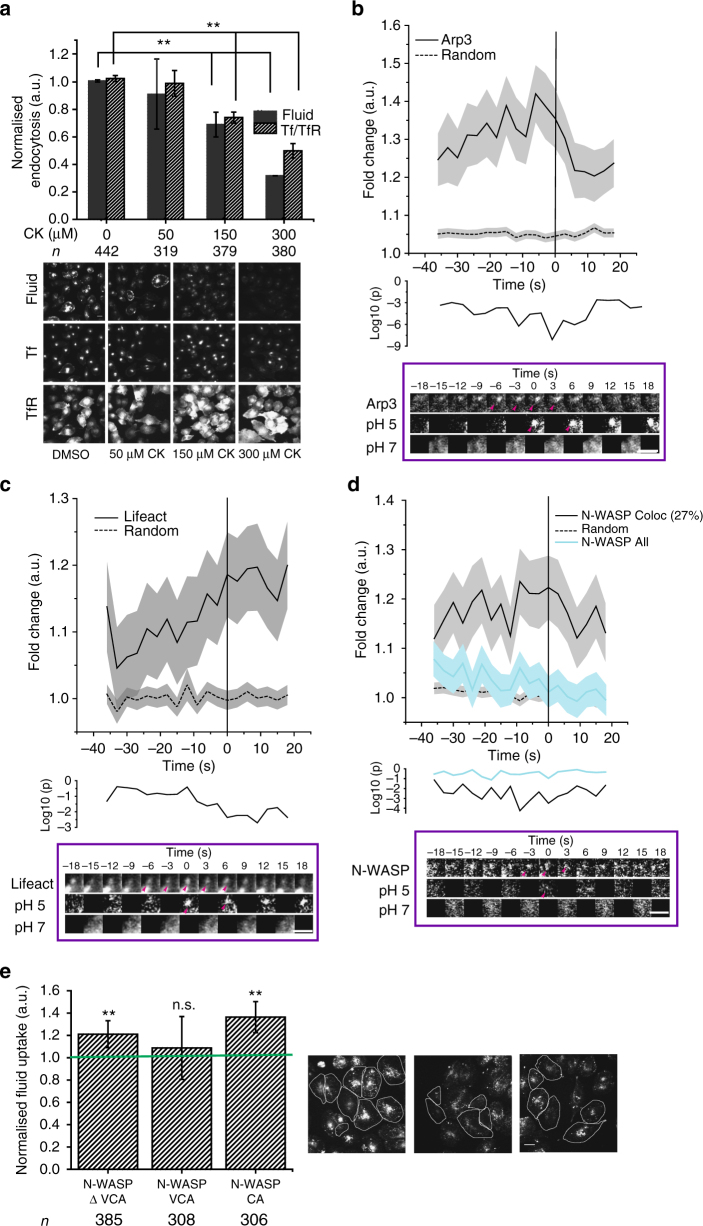
Fig. 6
Arp2/3-based actin machinery is required for CG endocytosis. a Histograms (top) show quantification of fluid phase and TfR uptake in AGS cells treated with DMSO alone (0u2009u00b5M) or the indicated c...
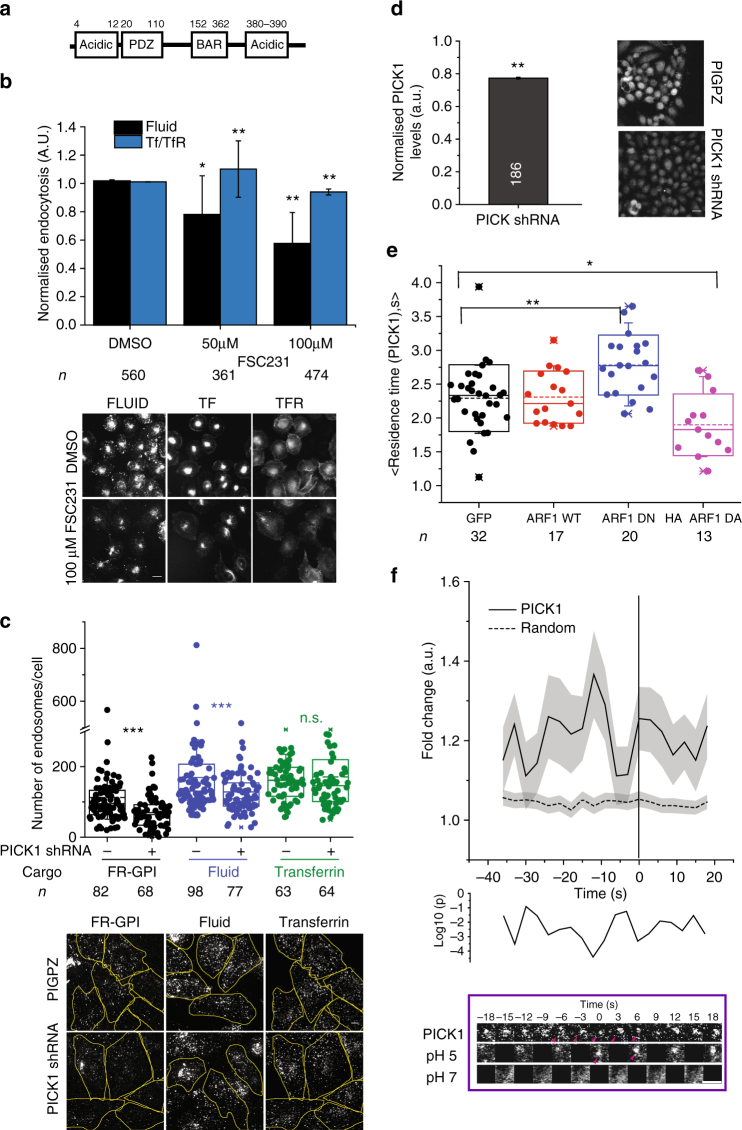
Fig. 7
PICK1 is involved in CG endocytosis and is negatively regulated by ARF1. a Schematic depicts domain organisation of PICK1. b Histograms (top) show quantification of fluid-phase and TfR uptake in AGS c...
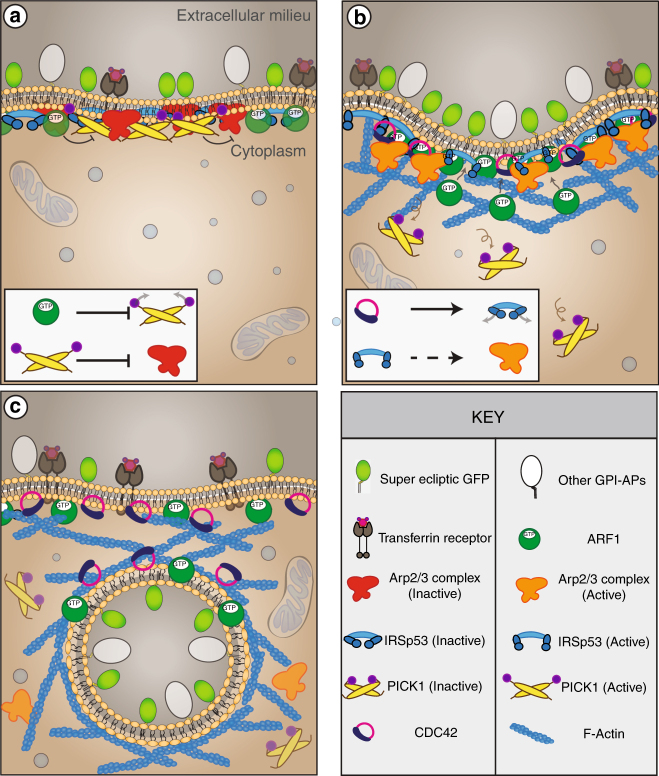
Fig. 8
Schematic depicting the proposed biphasic mechanism for CG endocytic vesicle formation. a Phase u0399: Characterised by theu00a0recruitment of ARF1/GBF1, PICK1, ARP2/3 and IRSp53 but not the buildup o...
Figure images are served from the NIH/NLM PubMed Central Open Access Subset or Europe PMC; copyright remains with the publishers and authors.
💬 Discussion
0 commentsNo comments yet. Be the first to start a discussion!
Leave a Comment