Abstract
Imaging and chromatin capture techniques have provided important insights into our understanding of nuclear organization. A limitation of these techniques is the inability to resolve allele-specific spatiotemporal properties of genomic loci in living cells. Here, we describe an allele-specific CRISPR live-cell DNA imaging technique (SNP-CLING) to provide the first comprehensive insights into allelic positioning across space and time in mouse embryonic stem cells and fibroblasts. With 3D imaging, we studied alleles on different chromosomes in relation to one another and relative to nuclear substructures such as the nucleolus. We find that alleles maintain similar positions relative to each other and the nucleolus; however, loci occupy unique positions. To monitor spatiotemporal dynamics by SNP-CLING, we performed 4D imaging and determined that alleles are either stably positioned or fluctuating during cell state transitions, such as apoptosis. SNP-CLING is a universally applicable technique that enables the dissection of allele-specific spatiotemporal genome organization in live cells.
🔬 Techniques
🔭 Microscopes
💻 Software
✨ Fluorophores
🧪 Sample Preparation
🔬 Cell Lines
🏭 Microscope Brands
🧪 Reagent Suppliers
📷 Detectors
🔎 Objectives
💻 Software Details
💾 Data Repositories
🏛️ Research Organizations (ROR)
Affiliated research institutions:
📋 Methods
Cell lines hTERT
RPE-1 cells (ATCC) 26 , C28/I2 chondrocytes 27 , 129S1-SvImJ x CAST-EiJ hybrid 2-3 mESCs 47 , or 129S1/CAST MEFs were PCR-tested for mycoplasma contamination (LookOut, SigmaAldrich). MEFs were isolated with standard procedures from 129S1-SvImJ x CAST-EiJ mouse strains. Animals were handled according to the Harvard University IACUC guidelines (protocol AEP 11-13). SNP selections in human or mouse PAM motifs We downloaded hg19 and mm10 assemblies and masked repetitive elements using repeat mask ( http://www.repeatmasker.org ). We looked for all instances where a SNP annotated in dbSNP database (versions 147 for human and 142 for mouse) disrupted the PAM sequence 5′-NRG-3′ either in sense or antisense orientation in the corresponding assembly. sgRNA design for CLING and SNP-CLING Non-repetitive genomic regions several kilobases upstream or downstream of the target genes to avoid interference with transcription were selected in hg19 or mm10 UCSC Genome Browser. These regions served as input to design sgRNAs ( http://www.broadinstitute.org/rnai/public/analysis-tools/sgrna-design-v1 ), 48 . Four highly specific sgRNAs with sgRNA scores around 1 and low off-target scores were chosen and aligned back to the reference genome using BLAT (UCSC) to determine specificity. Flanking BbsI restriction sites were used to ligate sgRNAs with a backbone expressing either three MS2, or three PP7, or six Puf1 motifs (Addgene #68426, #68424), 19 . mCherry or mVenus fluorescent proteins were expressed as fusion proteins with either MS2 or PP7 binding proteins (Addgene #68420), independent of dCas9 (Addgene #68416). All combinations of three of the four sgRNAs were pooled after endotoxin-free MAXI preparations to test off-target binding in confocal microscopy ( Figure S5 ). The sgRNA pools with the most specific signals and reduced off-target binding effects were used for super-resolution microscopy. Three sgRNAs, each with three RNA stem-loops for the RNA-binding proteins bound fluorescent protein dimers, resulting in a specific CLING-signal derived from 18 molecules ( Figure 4c , Table S1 ). For SNP-CLING, genomic regions were selected in MGI browser ( http://www.informatics.jax.org ) and heterozygous SNPs were extracted for the 129S1-SvImJ x CAST-EiJ hybrid cells. The SNP-CLING selection was made based on heterozygous SNPs at the 2 nd or 3 rd position of the PAM sequence (5′-NRG-3′). Substitutions from ‘R’ to ‘C’ or ‘T’ concerning the 2 nd PAM-nucleotide or substitutions from ‘G’ to ‘A’ or ‘C’ or ‘T’ for the 3 rd PAM-nucleotide were selected either for the 129S1-SvImJ or the CAST-EiJ allele. The heterozygous state of the SNPs was validated by Sanger-sequencing. A list of sgRNA sequences can be found in Table S1 . mESC culture Male 129S1-SvImJ × CAST-EiJ hybrid 2-3 mESCs 47 , were grown on 0.2% gelatinized petri-dish in 2i media [125 ml DMEM-F12 (ThermoFisher Scientific, #11330-032), 125 ml Neurobasal Medium (ThermoFisher Scientific, #21103-049), 1.25 ml NDiff Neuro-2 Medium Supplement 200x (Millipore, #SCM012), 83.5 μl 7.5 % BSA Fraction V (ThermoFisher Scientific, #15260-037), 2.5 ml B-27 Supplement 50x minus vitamin A (ThermoFisher Scientific, #12587-010), 1 μl B β-mercaptoethanol, 25 μl PD0325901 (Stemgent, #04-0006), 75 μl CHIR99021 (Stemgent, #04-0004), 25 μl LIF ESGRO (10 7 units LIF/ml stock) (Chemicon, #ESG1106), 1 % penicillin-streptomycin (ThermoFisher Scientific, #15140-163), 1 % non-essential amino acids (ThermoFisher Scientific, #11140-076), and 1 % L-glutamine (ThermoFisher Scientific, #25030-164)]. Media was changed daily. Cells were grown at 37 °C at 5 % CO 2 and passaged every 3-4 days with TrypLE (Thermo Fisher Scientific, #12604039). Transient transfections 0.6×10 5 hTERT RPE-1 cells were seeded 48 h 26 , or 1.5×10 5 C28/I2 chondrocytes 27 , were seeded 12 h prior to 48 h transfections into each well of a 2-well LabTek chamber slide (ThermoFisher Scientific, #155380) in DMEM-F12 (1:1, ThermoFisher Scientific, # 10565-018) with 10% FBS and 1 × penicillin-streptomycin supplements. 1.25×10 5 hybrid 129S1/CAST MEFs were seeded 48 h before 48 h transfections in ATCC's DMEM with 10 % FBS, 1 × L-glutamine, and 1 × penicillin-streptomycin supplements. Per reaction, 1.5 μl Lipofectamine 3000 reagent (ThermoFisher Scientific, # L3000008) were mixed with 23.5 μl Opti-MEM® I Reduced Serum Medium (ThermoFisher Scientific, # 31985-062). A total of 25 μl Opti-MEM® I Reduced Serum Medium with 375 ng pooled gRNAs, 500 ng fluorescent protein, 625 ng dCas9 (Adggene) and 4.75 μl P3000 reagent were incubated with the Lipofectamine mix for 5 min at room temperature. For serum starvation experiments to induce mitosis or apoptosis, MEFs were seeded in complete medium, transfected under serum-free conditions, and re-adapted to ATCC's DMEM with 20 % FBS, 2 × L-glutamine, and 1 × penicillin-streptomycin supplements 14 - 22 hours prior to imaging. 3×10 5 hybrid 129S1/CAST mESCs were seeded per well of a 0.2 % gelatinized μ-Slide 2-well ibiTreat plate (Ibidi, #80286) 24 h prior to 48 h transfections. 1.25×10 5 hybrid 129S1/CAST MEFs were seeded per well of a LabTek chamber slide. Transient transfections were performed with Lipofectamine 3000 according to manufacturer's protocol using 4 μl of Lipofectamine 3000 reagent per 2150 ng DNA. For CLING-imaging, a transfection mix containing 400 ng of dCas9, 500 ng of each fluorescent protein, and 375 ng of the sgRNA pool was used. Media was changed 24 h post transfection and cells were imaged 48 hours post transfection. Prior to imaging, the medium was changed to FluoroBrite™ DMEM Media ThermoFisher Scientific, # A1896701), and 1 drop NucBlue® Live ReadyProbes® Reagent (ThermoFisher Scientific # R37605 ) was added to stain the nuclei. A 1:2500 dilution of the CytoPainter Nucleolar Staining Kit (Abcam, # ab139475) according to the manufacturer instructions was used to stain the nucleoli. After a 10 minute incubation at 37°C, 5 % CO 2 , the cells were washed twice with PBS and prepared for imaging as described above. None of the studied loci were observed inside the nucleoli. Confocal super-resolution microscopy (Airyscan) The LSM880 with Airyscan (Zeiss) and the incubation module at 37°C and 5% CO 2 were used to visualize all experiments in this project. A 32-channel gallium arsenide phosphide photomultiplier tube (GaAsP-PMT) area detector (Airyscan) collects a pinhole-plane image at every scan position. The Airyscan detector system enhances sensitivity 4-8 times and resolution beyond the diffraction limit of light of up to 1.7 times (~130 nm) compared to standard confocal microscopy 49 . For all acquisitions, ∼5-10× less laser power was used when compared to standard confocal microscopy. The ZEN black edition software version 2 (Zeiss) was used for acquisition. All shown images were acquired in super-resolution (SR) mode with 16 bit, 0.17 μm z-slices, and fitted zoom level, whereas quantification experiments were done in resolution- vs. -sensitivity (R-S) mode with 8 bit and 0.25 – 0.3 μm z-slices to increase imaging speed. The oil immersion objective Plan-Apochromat 63×/1.4 oil DIC M27 was used for all acquisitions. If the edges of foci were closer than
Show full methods section
Cell lines hTERT
RPE-1 cells (ATCC) 26 , C28/I2 chondrocytes 27 , 129S1-SvImJ x CAST-EiJ hybrid 2-3 mESCs 47 , or 129S1/CAST MEFs were PCR-tested for mycoplasma contamination (LookOut, SigmaAldrich). MEFs were isolated with standard procedures from 129S1-SvImJ x CAST-EiJ mouse strains. Animals were handled according to the Harvard University IACUC guidelines (protocol AEP 11-13). SNP selections in human or mouse PAM motifs We downloaded hg19 and mm10 assemblies and masked repetitive elements using repeat mask ( http://www.repeatmasker.org ). We looked for all instances where a SNP annotated in dbSNP database (versions 147 for human and 142 for mouse) disrupted the PAM sequence 5′-NRG-3′ either in sense or antisense orientation in the corresponding assembly. sgRNA design for CLING and SNP-CLING Non-repetitive genomic regions several kilobases upstream or downstream of the target genes to avoid interference with transcription were selected in hg19 or mm10 UCSC Genome Browser. These regions served as input to design sgRNAs ( http://www.broadinstitute.org/rnai/public/analysis-tools/sgrna-design-v1 ), 48 . Four highly specific sgRNAs with sgRNA scores around 1 and low off-target scores were chosen and aligned back to the reference genome using BLAT (UCSC) to determine specificity. Flanking BbsI restriction sites were used to ligate sgRNAs with a backbone expressing either three MS2, or three PP7, or six Puf1 motifs (Addgene #68426, #68424), 19 . mCherry or mVenus fluorescent proteins were expressed as fusion proteins with either MS2 or PP7 binding proteins (Addgene #68420), independent of dCas9 (Addgene #68416). All combinations of three of the four sgRNAs were pooled after endotoxin-free MAXI preparations to test off-target binding in confocal microscopy ( Figure S5 ). The sgRNA pools with the most specific signals and reduced off-target binding effects were used for super-resolution microscopy. Three sgRNAs, each with three RNA stem-loops for the RNA-binding proteins bound fluorescent protein dimers, resulting in a specific CLING-signal derived from 18 molecules ( Figure 4c , Table S1 ). For SNP-CLING, genomic regions were selected in MGI browser ( http://www.informatics.jax.org ) and heterozygous SNPs were extracted for the 129S1-SvImJ x CAST-EiJ hybrid cells. The SNP-CLING selection was made based on heterozygous SNPs at the 2 nd or 3 rd position of the PAM sequence (5′-NRG-3′). Substitutions from ‘R’ to ‘C’ or ‘T’ concerning the 2 nd PAM-nucleotide or substitutions from ‘G’ to ‘A’ or ‘C’ or ‘T’ for the 3 rd PAM-nucleotide were selected either for the 129S1-SvImJ or the CAST-EiJ allele. The heterozygous state of the SNPs was validated by Sanger-sequencing. A list of sgRNA sequences can be found in Table S1 . mESC culture Male 129S1-SvImJ × CAST-EiJ hybrid 2-3 mESCs 47 , were grown on 0.2% gelatinized petri-dish in 2i media [125 ml DMEM-F12 (ThermoFisher Scientific, #11330-032), 125 ml Neurobasal Medium (ThermoFisher Scientific, #21103-049), 1.25 ml NDiff Neuro-2 Medium Supplement 200x (Millipore, #SCM012), 83.5 μl 7.5 % BSA Fraction V (ThermoFisher Scientific, #15260-037), 2.5 ml B-27 Supplement 50x minus vitamin A (ThermoFisher Scientific, #12587-010), 1 μl B β-mercaptoethanol, 25 μl PD0325901 (Stemgent, #04-0006), 75 μl CHIR99021 (Stemgent, #04-0004), 25 μl LIF ESGRO (10 7 units LIF/ml stock) (Chemicon, #ESG1106), 1 % penicillin-streptomycin (ThermoFisher Scientific, #15140-163), 1 % non-essential amino acids (ThermoFisher Scientific, #11140-076), and 1 % L-glutamine (ThermoFisher Scientific, #25030-164)]. Media was changed daily. Cells were grown at 37 °C at 5 % CO 2 and passaged every 3-4 days with TrypLE (Thermo Fisher Scientific, #12604039). Transient transfections 0.6×10 5 hTERT RPE-1 cells were seeded 48 h 26 , or 1.5×10 5 C28/I2 chondrocytes 27 , were seeded 12 h prior to 48 h transfections into each well of a 2-well LabTek chamber slide (ThermoFisher Scientific, #155380) in DMEM-F12 (1:1, ThermoFisher Scientific, # 10565-018) with 10% FBS and 1 × penicillin-streptomycin supplements. 1.25×10 5 hybrid 129S1/CAST MEFs were seeded 48 h before 48 h transfections in ATCC's DMEM with 10 % FBS, 1 × L-glutamine, and 1 × penicillin-streptomycin supplements. Per reaction, 1.5 μl Lipofectamine 3000 reagent (ThermoFisher Scientific, # L3000008) were mixed with 23.5 μl Opti-MEM® I Reduced Serum Medium (ThermoFisher Scientific, # 31985-062). A total of 25 μl Opti-MEM® I Reduced Serum Medium with 375 ng pooled gRNAs, 500 ng fluorescent protein, 625 ng dCas9 (Adggene) and 4.75 μl P3000 reagent were incubated with the Lipofectamine mix for 5 min at room temperature. For serum starvation experiments to induce mitosis or apoptosis, MEFs were seeded in complete medium, transfected under serum-free conditions, and re-adapted to ATCC's DMEM with 20 % FBS, 2 × L-glutamine, and 1 × penicillin-streptomycin supplements 14 - 22 hours prior to imaging. 3×10 5 hybrid 129S1/CAST mESCs were seeded per well of a 0.2 % gelatinized μ-Slide 2-well ibiTreat plate (Ibidi, #80286) 24 h prior to 48 h transfections. 1.25×10 5 hybrid 129S1/CAST MEFs were seeded per well of a LabTek chamber slide. Transient transfections were performed with Lipofectamine 3000 according to manufacturer's protocol using 4 μl of Lipofectamine 3000 reagent per 2150 ng DNA. For CLING-imaging, a transfection mix containing 400 ng of dCas9, 500 ng of each fluorescent protein, and 375 ng of the sgRNA pool was used. Media was changed 24 h post transfection and cells were imaged 48 hours post transfection. Prior to imaging, the medium was changed to FluoroBrite™ DMEM Media ThermoFisher Scientific, # A1896701), and 1 drop NucBlue® Live ReadyProbes® Reagent (ThermoFisher Scientific # R37605 ) was added to stain the nuclei. A 1:2500 dilution of the CytoPainter Nucleolar Staining Kit (Abcam, # ab139475) according to the manufacturer instructions was used to stain the nucleoli. After a 10 minute incubation at 37°C, 5 % CO 2 , the cells were washed twice with PBS and prepared for imaging as described above. None of the studied loci were observed inside the nucleoli. Confocal super-resolution microscopy (Airyscan) The LSM880 with Airyscan (Zeiss) and the incubation module at 37°C and 5% CO 2 were used to visualize all experiments in this project. A 32-channel gallium arsenide phosphide photomultiplier tube (GaAsP-PMT) area detector (Airyscan) collects a pinhole-plane image at every scan position. The Airyscan detector system enhances sensitivity 4-8 times and resolution beyond the diffraction limit of light of up to 1.7 times (~130 nm) compared to standard confocal microscopy 49 . For all acquisitions, ∼5-10× less laser power was used when compared to standard confocal microscopy. The ZEN black edition software version 2 (Zeiss) was used for acquisition. All shown images were acquired in super-resolution (SR) mode with 16 bit, 0.17 μm z-slices, and fitted zoom level, whereas quantification experiments were done in resolution- vs. -sensitivity (R-S) mode with 8 bit and 0.25 – 0.3 μm z-slices to increase imaging speed. The oil immersion objective Plan-Apochromat 63×/1.4 oil DIC M27 was used for all acquisitions. If the edges of foci were closer than
📊 Figures
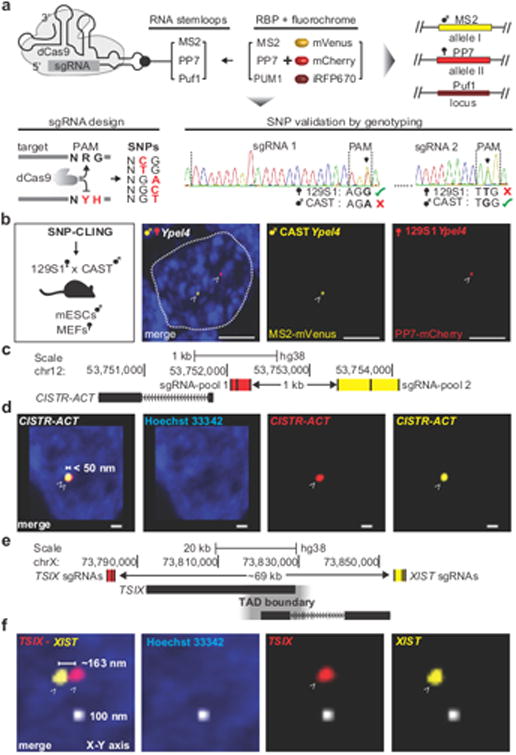
Figure 1
SNP-CLING or CLING labeling in live cells
(a) sgRNAs harboring internal protein-binding RNA-motifs (MS2, or PP7, or Puf1) direct non-catalytic dCas9 to each targeted locus. The corresponding RNA-binding proteins (RBP) MS2, or PP7, or PUM1, ar...
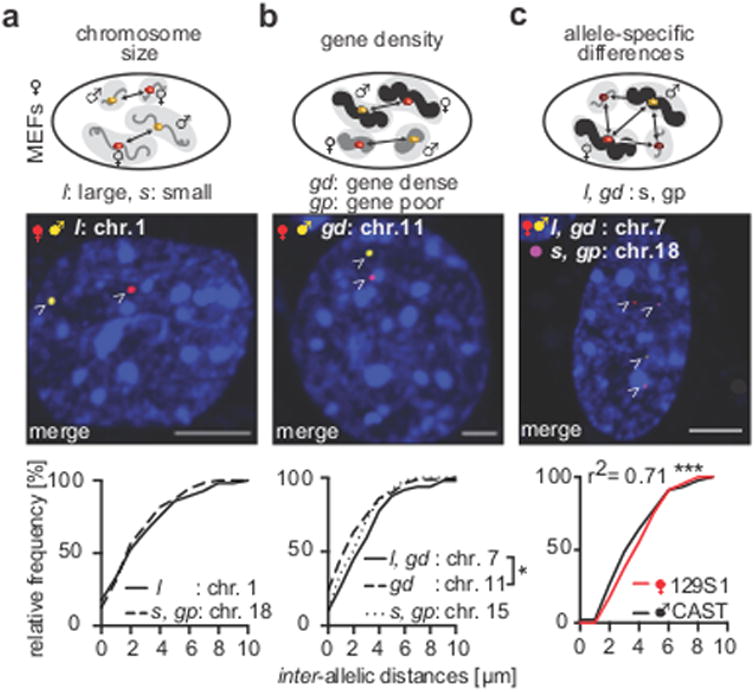
Figure 2
Inter -allelic distances
(a) Inter -allelic distances of Hdac4 [CI = 2.31-3.59] on largest chromosome 1 compared to a locus on small chromosome 18 (44.21 Mb, [CI = 2.14-3.19 u03bcm]) in female 129S1/CAST MEFs were similar (ea...
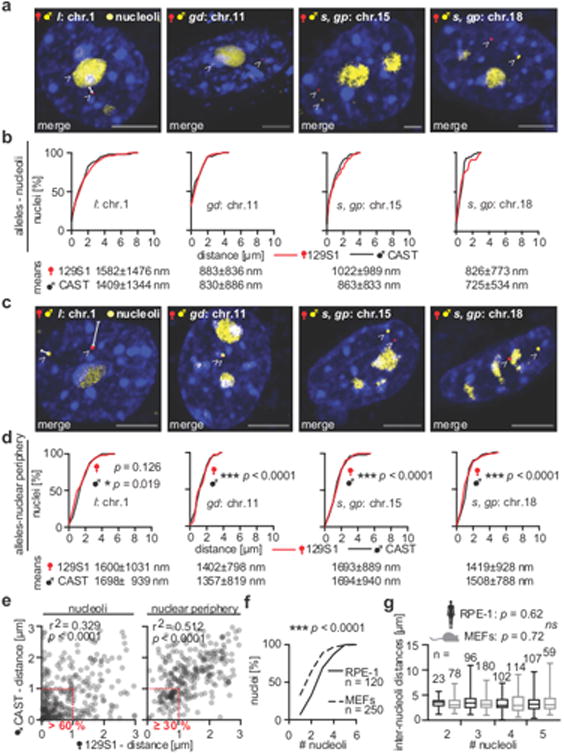
Figure 3
Allelic distances to the nucleoli or to the nuclear periphery
(a) Examples of merged images demonstrate positioning of the studied alleles (arrowheads: red = PP7-mCherry, yellow = MS2-mVenus), and the nucleoli (rRNA-GFP) in 129S1/CAST MEFs (scale bars = 5 u03bcm...
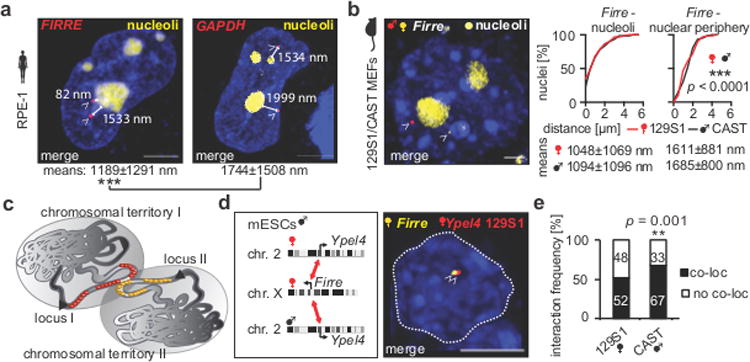
Figure 4
Firre 's positioning and its inter -allelic interactions
(a) Example of CLING-labeled FIRRE loci (arrowheads: red = PP7-mCherry, 108 nuclei) and their distances to the closest nucleolus (rRNA-GFP) in female RPE-1 cells (scale bars = 5 u03bcm). Loci-nucleoli...
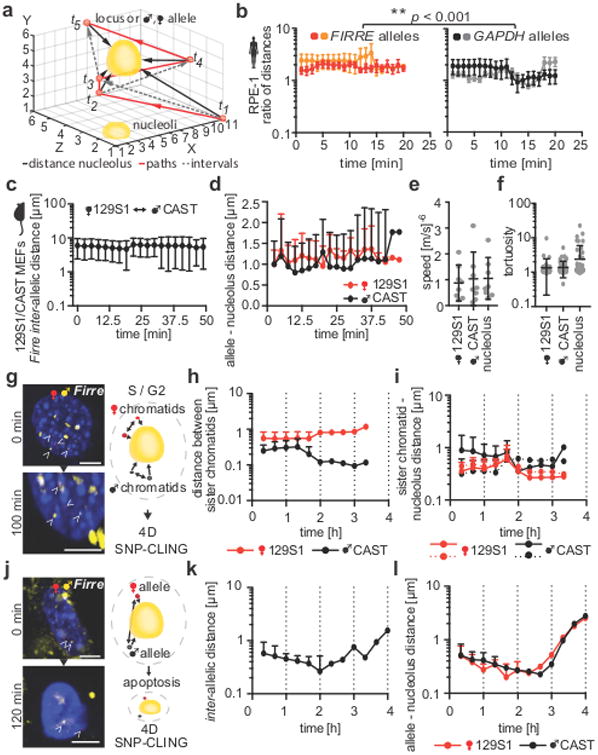
Figure 5
Firre 's allelic positioning over time
(a) Scheme of 4D-imaging: individual distances, paths, and intervals of tracked signals (locus or allele) over time to address spatiotemporal loci dynamics. (b) Ratios of loci-nucleoli distances of FI...
Figure images are served from the NIH/NLM PubMed Central Open Access Subset or Europe PMC; copyright remains with the publishers and authors.
💬 Discussion
0 commentsNo comments yet. Be the first to start a discussion!
Leave a Comment