Abstract
Fluorescent staining of astrocytes without damaging or interfering with normal brain functions is essential for intravital microscopy studies. Current methods involved either transgenic mice or local intracerebral injection of sulforhodamine 101. Transgenic rat models rarely exist, and in mice, a backcross with GFAP transgenic mice may be difficult. Local injections of fluorescent dyes are invasive. Here, we propose a non-invasive, specific and ubiquitous method to stain astrocytes in vivo. This method is based on iv injection of sulforhodamine dyes and is applicable on rats and mice from postnatal age to adulthood. The astrocytes staining obtained after iv injection was maintained for nearly half a day and showed no adverse reaction on astrocytic calcium signals or electroencephalographic recordings in vivo. The high contrast of the staining facilitates the image processing and allows to quantify 3D morphological parameters of the astrocytes and to characterize their network. Our method may become a reference for in vivo staining of the whole astrocytes population in animal models of neurological disorders.
🔬 Techniques
💻 Software
✨ Fluorophores
🧪 Sample Preparation
🔬 Cell Lines
🏭 Microscope Brands
🧪 Reagent Suppliers
🔴 Lasers
🎨 Filters
💻 Software Details
🏛️ Research Organizations (ROR)
Affiliated research institutions:
📋 Methods
1 Ethics Statement In accordance with the policy of Grenoble Institute of Neuroscience (GIN) and the French legislation, experiments were done in compliance with the European Community Council Directive of November 24, 1986 (86/609/EEC). The research involving animals was authorized by the Direction Départementale des Services Vétérinaires de l'Isère – Ministère de l'Agriculture et de la Pêche, France and the Direction Départementale de la protection des populations - Préfecture de l'Isère-France (F. Appaix, PhD, permit number 38 09 39). All efforts were made to minimize the number of animals used and their suffering during the experimental procedure. Animals were housed in cages with food and water ad libitum in a 12 h light/dark cycle at 22±1°C. 2 Chemicals All chemicals were purchased from Sigma-Aldrich (France). SR101, SRB or SRG were dissolved in 0.9% NaCl (saline) at the concentration of 10 mg/ml. Fluorescein IsoThioCyanate-dextran (FITC-dextran, 70 kDa) was diluted at 100 mg/ml concentration in saline. Dyes solutions were stored at 4°C and protected from light for a maximum of one month. 3 Animals and surgical preparation Rats (Sprague Dawley, postnatal day (P) 17–70, n = 32, Wistar, P17–30, n = 21, Janvier, France) and mice (adult male C57BL/6, P42–70, n = 5, Janvier, France; and FVB/N-Tg(GFAPGFP)14Mes/J, P20–45, n = 4, Jackson Laboratory, US) were used. For in vivo TPLSM imaging, animals were anesthetized using isoflurane (5% for induction and 1–2% during experiments) in a 70% air, 30% O 2 gas mixture. Their body temperature was monitored with a rectal probe and maintained at 36°C using a heating blanket. A catheter (Neoflon™, BD, USA) was inserted in the tail vein and SRB, SRG or SR101 (20 mg/kg), and/or FITC-dextran (200 mg/kg) was iv injected. A craniotomy of 2–3 mm in diameter was performed with a surgical drill above the somatosensory and motor cortex and filled with chilled artificial cerebrospinal fluid (aCSF; in mM: 126 NaCl, 2.5 KCl, 2.5 CaCl 2 , 1.2 MgCl 2 , 1.20 NaH 2 PO 4 , 25 NaHCO 3 , 1 sodium pyruvate and 22 D-glucose; bubbled with 95% O 2 and 5% CO 2 ; pH 7.4). In some case, the dura mater was carefully removed and the exposed cortex was protected by aCSF and covered with a coverslip glued on the skull. To compare our iv method with a previous report [12] , 50 µl of SR101 was directly applied (5 min, 100 µM in aCSF) on the cortical surface. For experiments on acute brain slices, animals were iv injected with SRB, SRG or SR101 as described above. One hour after injection, rats were anesthetized by ketamine injection (Imalgène®, Kétamine Virbac, France; 100 mg/kg), decapitated, and their brain was quickly removed. Coronal brain slices with a thickness of 300 µm were cut (vibratome V1000S, Leica, Germany) in ice-cold low Ca 2+ - high Mg 2+ artificial cerebrospinal fluid (aCSF; in mM: 126 NaCl, 2.5 KCl, 0.5 CaCl 2 , 7 MgCl 2 , 1.20 NaH 2 PO 4 , 25 NaHCO 3 , 1 sodium pyruvate and 22 D-glucose; bubbled with 95% O 2 and 5% CO 2 ; pH 7.4). Following sectioning, all slices were kept at room temperature in normal aCSF (in mM: 1.20 MgCl 2 and 2 CaCl 2 ) until TPLSM imaging for a maximum of 6 hours. For comparison with the iv injection, acute brain slices from non-injected animal were incubated with SR101 (15 min, final concentration 1 µM) [24] . For the epilepsy mouse model, 6 week-old animals were injected in the dorsal intrahippocampus with 1 nmol of kainic acid (50 nl), 2 weeks before iv SRB injection, as previously described [22] , [23] . The cannula was positioned in the right dorsal hippocampus (coordinates from bregma: anteroposterior [AP] = 2.0 mm, mediolateral [ML] = 1.5 mm, dorsoventral [DV] = 2.0 mm) and the kainic acid solution was injected during one minute using a micro-pump (CMA/100, Carnegie Medicine). Only animals showing signs of focal status epilepticus (e.g., mild clonies, rotations) during the 12 h following kainic acid injection were included in the study. 4 Two-photon microscopy and two-photon fluorescence spectra Two-photon microscopy was performed using a LSM 7 MP (Zeiss, Germany) equipped with a 20× water-immersion objective (NA 1.0; Zeiss) and ZEN 2009 software. Laser excitation at 800–900 nm was done with a Ti:Sapphire laser system (Chameleon vision II; Coherent, UK). Fluorescence light was collected in the epifluorescence configuration. The sulforhodamines fluorescence was separated from the FITC or GFP fluorescence using a dichroic mirror (562 nm, Semrock, US). Fluorescence emissions were detected simultaneously by two non-descanned photomultiplier tubes with a 542/50 nm filter (Semrock, US) for “green” fluorescence emission and a 617/73 nm filter (Semrock, US) for “red” fluorescence emission. Fluorescence emission spectra were measured using 100 µM solutions of SRB or SR101 dissolved in water. Fluorescence intensities of these solutions were recorded on the microscope as a function of excitation wavelengths ranging from 720 nm to 950 nm in steps of 10 nm using a constant laser power (50 mW on the sample). 5 Immunolabeling Immunostaining on living brain slices was performed to characterize SRB-positive cells. Slices from SRB-injected rat brain were incubated for one hour at room temperature with either anti-NG2 antibody diluted in aCSF (1∶1000, DAKO) or anti-NeuN antibody (1∶1000, DAKO) diluted in aCSF with 0.005% Pluronic acid F-127 (Molecular Probes, Invitrogen), 0.00025% Cremophor EL (Sigma-Aldrich) and 0.05% DMSO (dimethyl sulfoxide, Sigma-Aldrich) saturated with 95% O 2 /5% CO 2 . Slices were rinsed twice in aCSF and incubated with an anti-mouse Alexa488-conjugated secondary antibody (1∶1000; Molecular Probes, Invitrogen) for one hour at room temperature. Finally, slices were put in aCSF for TPLSM imaging. Above immunostaining method described for living brain slice could not be used for anti-S100B and anti-CD11 antibodies. Thus, a method was developed to merge astrocytes sulforhodamine staining acquired in living slice with immunostaining performed on the same slice after fixation. Rats were intravenously injected with both SRB and FITC-dextran. Blood vessels stained with fixable FITC-dextran were used as landmarks to merge images from the living and the fixed slice. Slices were then fixed with 4% paraformaldehyde in Tris Buffer Saline (TBS) with 0.3% triton-X100 (TBST) for 1 hour and incubated with 3% normal goat serum (NGS) in TBST at room temperature for 30 min. The incubation with the antibodies anti-S100B (1∶1000, DAKO) and anti-CD11 (1∶100, AbCys) in 1% NGS-TBST was performed overnight at 4°C. Then, after rinsing, slices were incubated with fluorescent secondary antibodies diluted in 1% NGS-TBST for 2 hours at room temperature: anti-rabbit Alexa488-conjugated secondary antibody (1∶1000; Molecular Probes, Invitrogen) for anti-S100B or anti-mouse Alexa488-conjugated (1∶1000; Molecular Probes, Invitrogen) for anti-CD11. Finally, slices were rinsed in TBST and mounted on slides using Vectashield medium (Vector labs, USA). Shrinkage caused by fixation was corrected using the “TurboReg” plugin [25] of ImageJ software to merge sulforhodamine staining with immunolabeling. 6 Electroencephalographic (EEG) recordings in freely moving rat Sprague-Dawley rats (P25; n = 4 for SRB and n = 4 for SR101) were anesthetized with 1% isoflurane in a 70% air, 30% O 2 gas mixture and placed in a stereotaxic apparatus. Bipolar electrodes (stainless steel wire ∅220 µm, insulated with Teflon) with a mean space of 300 µm between the 2 tips were unilaterally implanted into the S1BF somatosensory cortex (coordinates relative to bregma: anteroposterior (AP): −1.3, mediolateral (ML): −5, dorsoventral (DV): −3), into the M1 motor cortex (coordinates relative to bregma: AP: +1.6, ML: −2.5, DV: −2) and into the hippocampus (coordinates relative to bregma: AP: −3.7, ML: −2.5, DV: −3.5). These electrodes were fixed to the skull with acrylic cement and connected to a female connector. Reference electrode was made of a stainless-steel screw fixed over the cerebellum and soldered to the connector. On the following day, the behavior and EEG activity was monitored in freely moving rat pups using a video/EEG computer-based acquisition system (System Plus Evolution®, Micromed, France). The rats were first monitored for 1 h for reference. Then, either SRB or SR101 (20 mg/kg) was intravenously injected as described above and then both EEG activity and behavior were monitored during 3 days for sessions of 3 consecutive hours. 7 Calcium Imaging A solution containing 5 µM Fluo-4 AM (Molecular Probes, Invitrogen, US), 0.005% Pluronic acid F-127 (Sigma-Aldrich, France), 0.00025% Cremophor EL (Sigma-Aldrich, France) and 0.05% DMSO (Sigma-Aldrich, France) was prepared in aCSF. Brain slices obtained as described above were loaded with this solution during 30 minutes at 35°C. The loading chamber was continuously bubbled with 95% O 2 /5% CO 2 . Slices were then placed in aCSF saturated with 95% O 2 /5% CO 2 and supplemented with 1 mM sodium pyruvate, at room temperature for 30 minutes. Before imaging, slices were placed in a perfusion chamber and perfused with aCSF bubbled with 95% O 2 /5% CO 2 at room temperature. Confocal imaging was done with an upright microscope (Eclipse E600 FN, Nikon Instruments, France) equipped with a 20× water-immersion objective (NA 0.5; Nikon) and a confocal head (confocal C1 head, Nikon). Fluo-4 was excited with an argon laser (488 nm) and emission was filtered with a 515±15 nm filter, SRB or SR101 were excited with a HeNe green laser (543 nm) and emission was filtered with a 605±75 nm filter. Images were acquired with EZ-C1 software (Nikon), in 12-bit encoded format. 512×256 images were taken at 800 ms intervals. For in vivo experiments, after removing the dura mater, 10 µl of a solution containing 0.9 mM Fluo-4 AM (Molecular Probes, Invitrogen, US), 2% Pluronic acid F-127 (Sigma-Aldrich, France) and 20% DMSO (Sigma-Aldrich, France) prepared in aCSF/Hepes were applied at the cortical surface for 45 min and rinsed with aCSF for 10 min. Time lapse recordings obtained were analyzed with CalSignal software [26] . 8 Image Processing and Statistical Analysis Image processing was performed with ImageJ software [27] . Multistacks mosaic was reconstructed using the “3D stitching” plugin [28] . Quantitative analysis of the astrocytic network was based on a 3-step procedure. First, raw images were segmented by adaptive thresholding (Bernsen) to facilitate automated cell detection. The result was then analyzed using the “Particle Analyzer” included in the BoneJ plugin [29] to determine the spatial coordinates of all detected objects. Finally, V3D software [30] was employed to visualize the raw images in 3D and to superpose markers for the detected cells in order to manually correct the result. Thus, non-detected cells can be added and artefactual objects can be removed. Normalized radial densities were calculated by dividing the histogram of the distances r between all labeled cells (bin width 3 µm) by N4πr 2 , where N is the total number of cells in the z-stacks [12] . The volume of astrocyte cell bodies was estimated using the “3D object counter” plugin [31] in ImageJ.
Show full methods section
1 Ethics Statement In accordance with the policy of Grenoble Institute of Neuroscience (GIN) and the French legislation, experiments were done in compliance with the European Community Council Directive of November 24, 1986 (86/609/EEC). The research involving animals was authorized by the Direction Départementale des Services Vétérinaires de l'Isère – Ministère de l'Agriculture et de la Pêche, France and the Direction Départementale de la protection des populations - Préfecture de l'Isère-France (F. Appaix, PhD, permit number 38 09 39). All efforts were made to minimize the number of animals used and their suffering during the experimental procedure. Animals were housed in cages with food and water ad libitum in a 12 h light/dark cycle at 22±1°C. 2 Chemicals All chemicals were purchased from Sigma-Aldrich (France). SR101, SRB or SRG were dissolved in 0.9% NaCl (saline) at the concentration of 10 mg/ml. Fluorescein IsoThioCyanate-dextran (FITC-dextran, 70 kDa) was diluted at 100 mg/ml concentration in saline. Dyes solutions were stored at 4°C and protected from light for a maximum of one month. 3 Animals and surgical preparation Rats (Sprague Dawley, postnatal day (P) 17–70, n = 32, Wistar, P17–30, n = 21, Janvier, France) and mice (adult male C57BL/6, P42–70, n = 5, Janvier, France; and FVB/N-Tg(GFAPGFP)14Mes/J, P20–45, n = 4, Jackson Laboratory, US) were used. For in vivo TPLSM imaging, animals were anesthetized using isoflurane (5% for induction and 1–2% during experiments) in a 70% air, 30% O 2 gas mixture. Their body temperature was monitored with a rectal probe and maintained at 36°C using a heating blanket. A catheter (Neoflon™, BD, USA) was inserted in the tail vein and SRB, SRG or SR101 (20 mg/kg), and/or FITC-dextran (200 mg/kg) was iv injected. A craniotomy of 2–3 mm in diameter was performed with a surgical drill above the somatosensory and motor cortex and filled with chilled artificial cerebrospinal fluid (aCSF; in mM: 126 NaCl, 2.5 KCl, 2.5 CaCl 2 , 1.2 MgCl 2 , 1.20 NaH 2 PO 4 , 25 NaHCO 3 , 1 sodium pyruvate and 22 D-glucose; bubbled with 95% O 2 and 5% CO 2 ; pH 7.4). In some case, the dura mater was carefully removed and the exposed cortex was protected by aCSF and covered with a coverslip glued on the skull. To compare our iv method with a previous report [12] , 50 µl of SR101 was directly applied (5 min, 100 µM in aCSF) on the cortical surface. For experiments on acute brain slices, animals were iv injected with SRB, SRG or SR101 as described above. One hour after injection, rats were anesthetized by ketamine injection (Imalgène®, Kétamine Virbac, France; 100 mg/kg), decapitated, and their brain was quickly removed. Coronal brain slices with a thickness of 300 µm were cut (vibratome V1000S, Leica, Germany) in ice-cold low Ca 2+ - high Mg 2+ artificial cerebrospinal fluid (aCSF; in mM: 126 NaCl, 2.5 KCl, 0.5 CaCl 2 , 7 MgCl 2 , 1.20 NaH 2 PO 4 , 25 NaHCO 3 , 1 sodium pyruvate and 22 D-glucose; bubbled with 95% O 2 and 5% CO 2 ; pH 7.4). Following sectioning, all slices were kept at room temperature in normal aCSF (in mM: 1.20 MgCl 2 and 2 CaCl 2 ) until TPLSM imaging for a maximum of 6 hours. For comparison with the iv injection, acute brain slices from non-injected animal were incubated with SR101 (15 min, final concentration 1 µM) [24] . For the epilepsy mouse model, 6 week-old animals were injected in the dorsal intrahippocampus with 1 nmol of kainic acid (50 nl), 2 weeks before iv SRB injection, as previously described [22] , [23] . The cannula was positioned in the right dorsal hippocampus (coordinates from bregma: anteroposterior [AP] = 2.0 mm, mediolateral [ML] = 1.5 mm, dorsoventral [DV] = 2.0 mm) and the kainic acid solution was injected during one minute using a micro-pump (CMA/100, Carnegie Medicine). Only animals showing signs of focal status epilepticus (e.g., mild clonies, rotations) during the 12 h following kainic acid injection were included in the study. 4 Two-photon microscopy and two-photon fluorescence spectra Two-photon microscopy was performed using a LSM 7 MP (Zeiss, Germany) equipped with a 20× water-immersion objective (NA 1.0; Zeiss) and ZEN 2009 software. Laser excitation at 800–900 nm was done with a Ti:Sapphire laser system (Chameleon vision II; Coherent, UK). Fluorescence light was collected in the epifluorescence configuration. The sulforhodamines fluorescence was separated from the FITC or GFP fluorescence using a dichroic mirror (562 nm, Semrock, US). Fluorescence emissions were detected simultaneously by two non-descanned photomultiplier tubes with a 542/50 nm filter (Semrock, US) for “green” fluorescence emission and a 617/73 nm filter (Semrock, US) for “red” fluorescence emission. Fluorescence emission spectra were measured using 100 µM solutions of SRB or SR101 dissolved in water. Fluorescence intensities of these solutions were recorded on the microscope as a function of excitation wavelengths ranging from 720 nm to 950 nm in steps of 10 nm using a constant laser power (50 mW on the sample). 5 Immunolabeling Immunostaining on living brain slices was performed to characterize SRB-positive cells. Slices from SRB-injected rat brain were incubated for one hour at room temperature with either anti-NG2 antibody diluted in aCSF (1∶1000, DAKO) or anti-NeuN antibody (1∶1000, DAKO) diluted in aCSF with 0.005% Pluronic acid F-127 (Molecular Probes, Invitrogen), 0.00025% Cremophor EL (Sigma-Aldrich) and 0.05% DMSO (dimethyl sulfoxide, Sigma-Aldrich) saturated with 95% O 2 /5% CO 2 . Slices were rinsed twice in aCSF and incubated with an anti-mouse Alexa488-conjugated secondary antibody (1∶1000; Molecular Probes, Invitrogen) for one hour at room temperature. Finally, slices were put in aCSF for TPLSM imaging. Above immunostaining method described for living brain slice could not be used for anti-S100B and anti-CD11 antibodies. Thus, a method was developed to merge astrocytes sulforhodamine staining acquired in living slice with immunostaining performed on the same slice after fixation. Rats were intravenously injected with both SRB and FITC-dextran. Blood vessels stained with fixable FITC-dextran were used as landmarks to merge images from the living and the fixed slice. Slices were then fixed with 4% paraformaldehyde in Tris Buffer Saline (TBS) with 0.3% triton-X100 (TBST) for 1 hour and incubated with 3% normal goat serum (NGS) in TBST at room temperature for 30 min. The incubation with the antibodies anti-S100B (1∶1000, DAKO) and anti-CD11 (1∶100, AbCys) in 1% NGS-TBST was performed overnight at 4°C. Then, after rinsing, slices were incubated with fluorescent secondary antibodies diluted in 1% NGS-TBST for 2 hours at room temperature: anti-rabbit Alexa488-conjugated secondary antibody (1∶1000; Molecular Probes, Invitrogen) for anti-S100B or anti-mouse Alexa488-conjugated (1∶1000; Molecular Probes, Invitrogen) for anti-CD11. Finally, slices were rinsed in TBST and mounted on slides using Vectashield medium (Vector labs, USA). Shrinkage caused by fixation was corrected using the “TurboReg” plugin [25] of ImageJ software to merge sulforhodamine staining with immunolabeling. 6 Electroencephalographic (EEG) recordings in freely moving rat Sprague-Dawley rats (P25; n = 4 for SRB and n = 4 for SR101) were anesthetized with 1% isoflurane in a 70% air, 30% O 2 gas mixture and placed in a stereotaxic apparatus. Bipolar electrodes (stainless steel wire ∅220 µm, insulated with Teflon) with a mean space of 300 µm between the 2 tips were unilaterally implanted into the S1BF somatosensory cortex (coordinates relative to bregma: anteroposterior (AP): −1.3, mediolateral (ML): −5, dorsoventral (DV): −3), into the M1 motor cortex (coordinates relative to bregma: AP: +1.6, ML: −2.5, DV: −2) and into the hippocampus (coordinates relative to bregma: AP: −3.7, ML: −2.5, DV: −3.5). These electrodes were fixed to the skull with acrylic cement and connected to a female connector. Reference electrode was made of a stainless-steel screw fixed over the cerebellum and soldered to the connector. On the following day, the behavior and EEG activity was monitored in freely moving rat pups using a video/EEG computer-based acquisition system (System Plus Evolution®, Micromed, France). The rats were first monitored for 1 h for reference. Then, either SRB or SR101 (20 mg/kg) was intravenously injected as described above and then both EEG activity and behavior were monitored during 3 days for sessions of 3 consecutive hours. 7 Calcium Imaging A solution containing 5 µM Fluo-4 AM (Molecular Probes, Invitrogen, US), 0.005% Pluronic acid F-127 (Sigma-Aldrich, France), 0.00025% Cremophor EL (Sigma-Aldrich, France) and 0.05% DMSO (Sigma-Aldrich, France) was prepared in aCSF. Brain slices obtained as described above were loaded with this solution during 30 minutes at 35°C. The loading chamber was continuously bubbled with 95% O 2 /5% CO 2 . Slices were then placed in aCSF saturated with 95% O 2 /5% CO 2 and supplemented with 1 mM sodium pyruvate, at room temperature for 30 minutes. Before imaging, slices were placed in a perfusion chamber and perfused with aCSF bubbled with 95% O 2 /5% CO 2 at room temperature. Confocal imaging was done with an upright microscope (Eclipse E600 FN, Nikon Instruments, France) equipped with a 20× water-immersion objective (NA 0.5; Nikon) and a confocal head (confocal C1 head, Nikon). Fluo-4 was excited with an argon laser (488 nm) and emission was filtered with a 515±15 nm filter, SRB or SR101 were excited with a HeNe green laser (543 nm) and emission was filtered with a 605±75 nm filter. Images were acquired with EZ-C1 software (Nikon), in 12-bit encoded format. 512×256 images were taken at 800 ms intervals. For in vivo experiments, after removing the dura mater, 10 µl of a solution containing 0.9 mM Fluo-4 AM (Molecular Probes, Invitrogen, US), 2% Pluronic acid F-127 (Sigma-Aldrich, France) and 20% DMSO (Sigma-Aldrich, France) prepared in aCSF/Hepes were applied at the cortical surface for 45 min and rinsed with aCSF for 10 min. Time lapse recordings obtained were analyzed with CalSignal software [26] . 8 Image Processing and Statistical Analysis Image processing was performed with ImageJ software [27] . Multistacks mosaic was reconstructed using the “3D stitching” plugin [28] . Quantitative analysis of the astrocytic network was based on a 3-step procedure. First, raw images were segmented by adaptive thresholding (Bernsen) to facilitate automated cell detection. The result was then analyzed using the “Particle Analyzer” included in the BoneJ plugin [29] to determine the spatial coordinates of all detected objects. Finally, V3D software [30] was employed to visualize the raw images in 3D and to superpose markers for the detected cells in order to manually correct the result. Thus, non-detected cells can be added and artefactual objects can be removed. Normalized radial densities were calculated by dividing the histogram of the distances r between all labeled cells (bin width 3 µm) by N4πr 2 , where N is the total number of cells in the z-stacks [12] . The volume of astrocyte cell bodies was estimated using the “3D object counter” plugin [31] in ImageJ.
Origin software
(OriginLab) was used for statistical analyses of the epilepsy mouse model. Data are reported as mean ± s.e.m. Significant differences ( p
📊 Figures
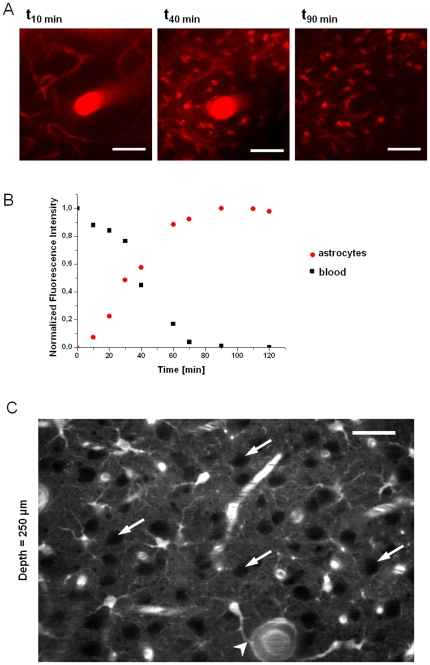
Figure 1
Astrocytes are progressively stained in vivo after an intravenous injection of sulforhodamine B.
A ) 10 min after an iv injection of SRB (P18 rat) only blood vessels were observed, 40 min after the injection both vessels and astrocytes were stained and 90 min after the injection only astrocytes c...
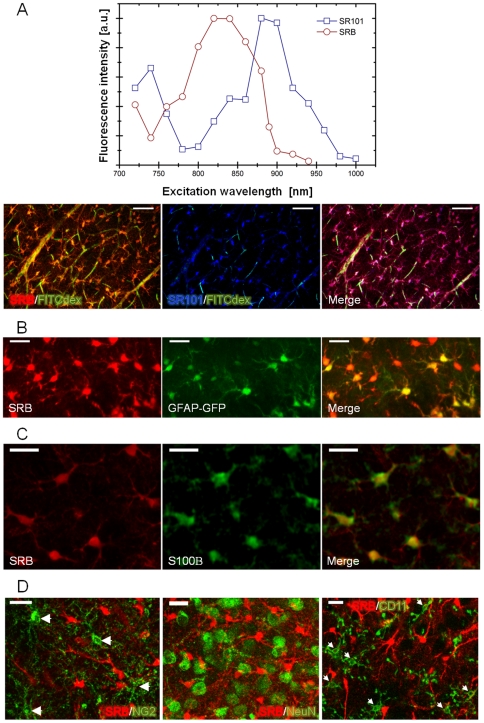
Figure 2
Sulforhodamine stained cells are only astrocytes.
A ) Two-photon excitation spectra of SRB and SR101 shows the possibility to excite one dye without exciting the other. Z-projection (standard-deviation) of a 100 u00b5m stack acquired on an acute coro...
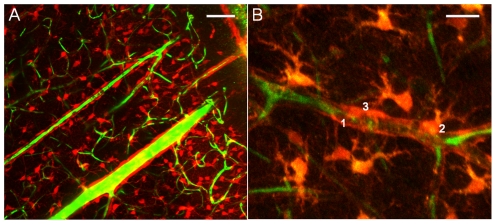
Figure 3
Astrocytes and blood vessels staining in acute cortical brain slices (P23 rat).
A ) Astrocytes are SRB labeled (red) whereas the vessels are stained by FITC-dextran (green). Scale baru200a=u200a50 u00b5m. B ) Higher magnification of image A showing that most of the surface of the...
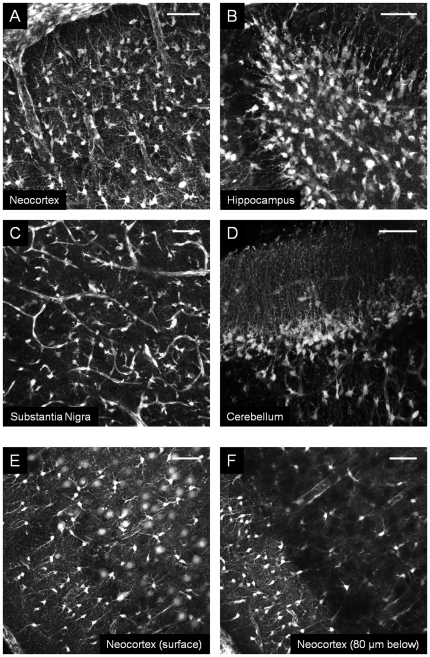
Figure 4
Comparison of two methods for astrocytes staining in acute brain slices (thickness of 300 u00b5m, P18 rat).
TPLSM images: Au2013D ) brain slicing performed 2 h after intravenous injection of SR101 (20 mg/kg) and Eu2013F ) brain slices incubated 15 minutes with SR101 (final concentration 1 u00b5M) in aCSF. Z...
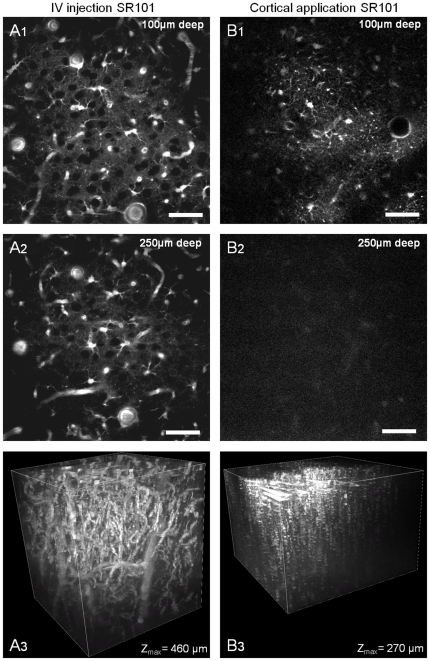
Figure 5
Comparison of two in vivo methods for astrocytes staining (P21 rat).
TPLSM images acquired: A 1u20133 ) 30 minutes after SRB (20 mg/kg) intravenous injection and B 1u20133 ) 5 minutes after SR101 application (100 u00b5M) on the cortical surface. ( A 1 ) and ( B 1 ) Ima...
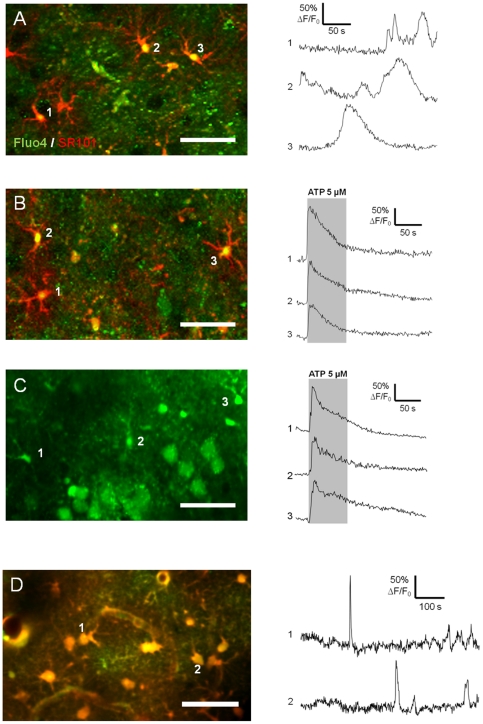
Figure 6
Calcium signaling in neocortical astrocytes stained with SR101.
A ) Left panel: merged confocal images of astrocytes labeled with SR101 (iv injection; red) and incubated with 5 u00b5M Fluo-4 AM (green) in acute brain slice (P17 rat). Right panel: example of typica...
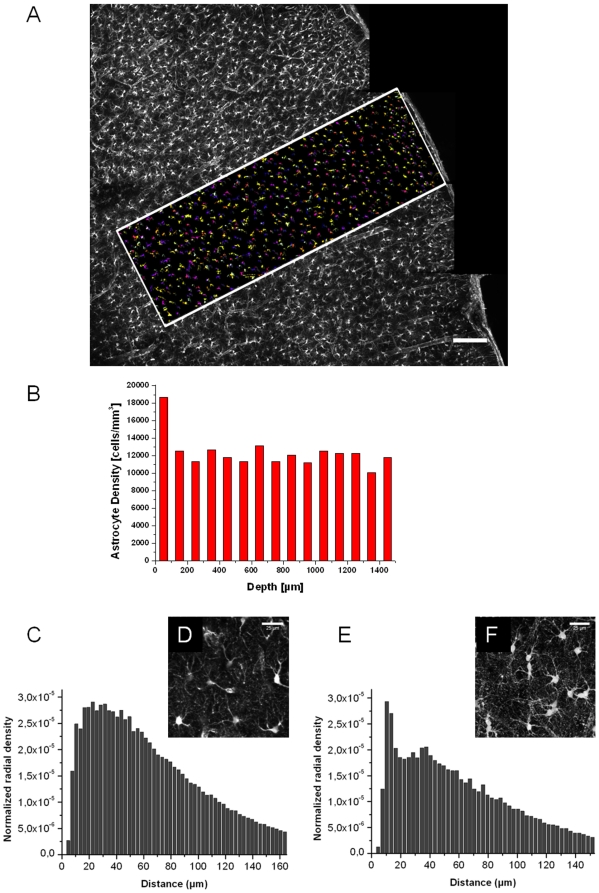
Figure 7
3D morphological analysis of the astrocytic network after iv injection of SRB.
A ) A multistacks mosaic acquired in the somatosensory area of a coronal acute brain slice (P17 rat). The region of interest (ROI; white rectangle) shows colored astrocytes detected using ImageJ plugi...
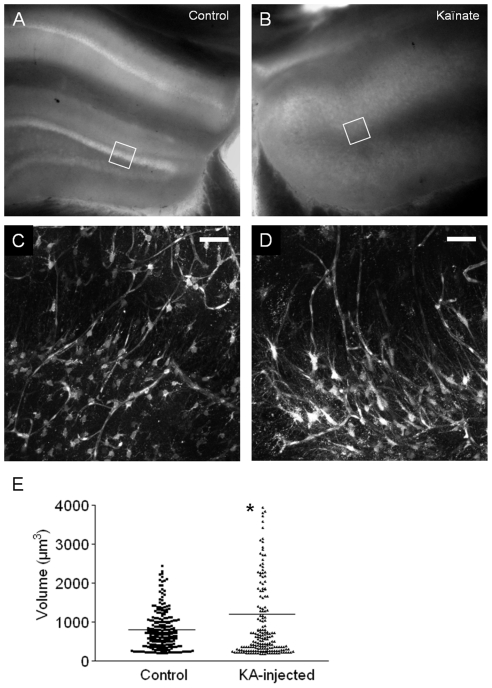
Figure 8
Rearrangement of the astroglial network in a mouse model of mesiotemporal lobe epilepsy.
Au2013B ) Bright field microscopy imaging (Nikon Multizoom AZ100, France) of acute hippocampal slices from adult mice 2 weeks after a unilateral intrahippocampal kainate injection. A ) Contralateral n...
Figure images are served from the NIH/NLM PubMed Central Open Access Subset or Europe PMC; copyright remains with the publishers and authors.
💬 Discussion
0 commentsNo comments yet. Be the first to start a discussion!
Leave a Comment