Abstract
Mitochondrial antiviral signaling (MAVS) protein is required for innate immune responses against RNA viruses. In virus-infected cells MAVS forms prion-like aggregates to activate antiviral signaling cascades, but the underlying structural mechanism is unknown. Here we report cryo-electron microscopic structures of the helical filaments formed by both the N-terminal caspase activation and recruitment domain (CARD) of MAVS and a truncated MAVS lacking part of the proline-rich region and the C-terminal transmembrane domain. Both structures are left-handed three-stranded helical filaments, revealing specific interfaces between individual CARD subunits that are dictated by electrostatic interactions between neighboring strands and hydrophobic interactions within each strand. Point mutations at multiple locations of these two interfaces impaired filament formation and antiviral signaling. Super-resolution imaging of virus-infected cells revealed rod-shaped MAVS clusters on mitochondria. These results elucidate the structural mechanism of MAVS polymerization, and explain how an α-helical domain uses distinct chemical interactions to form self-perpetuating filaments. DOI: http://dx.doi.org/10.7554/eLife.01489.001.
🔬 Techniques
🔭 Microscopes
🧬 Organisms
💻 Software
✨ Fluorophores
🧪 Sample Preparation
🔬 Cell Lines
🏭 Microscope Brands
🧪 Reagent Suppliers
📷 Detectors
💻 Software Details
📋 Protocols
💾 Data Repositories
🏛️ Research Organizations (ROR)
Affiliated research institutions:
📋 Methods
Reagents and standard methods Mouse antibody against Flag-tag
(M2) and M2-conjugated agarose were purchased from Sigma-Aldrich (St. Louis, MO); rabbit antibodies against TOM20 and the p65 subunit of NF-κB were from Santa Cruz Biotechnology (Dallas, TX); Alexa Fluor 488 conjugated goat anti-mouse and anti-rabbit antibodies, Alexa Fluor 568 conjugated goat anti-mouse antibody, and Alexa Fluor 633 conjugated goat anti-rabbit antibody were from Invitrogen (Carlsbad, CA). Sendai virus (SeV, Cantell strain, Charles River Laboratories) was used at 100 hemagglutination (HA) units/ml culture media. HEK293T, HEK293T-IFNβ-luciferase, Mavs −/− MEF cells and derivatives were cultured in Dulbecco’s modified Eagle’s medium (DMEM) supplemented with 10% (v/v) cosmic calf serum (Hyclone, Thermo Fisher Scientific, Waltham, MA) with penicillin (100 U/ml) and streptomycin (100 μg/ml). Other chemicals and reagents were from Sigma-Aldrich unless otherwise specified. Protein expression and purification cDNA encoding Flag-tagged MAVS CARD (1–100) has been described previously ( Hou et al., 2011 ). For protein expression, pcDNA3-Flag-MAVS CARD was transiently transfected into HEK293T cells. Cells were harvested 36 hr after transfection and lysed in a buffer containing 20 mM Tris–HCl (pH 8.0), 150 mM NaCl, 10% glycerol, 0.10% Triton X-100, 1.0 mM DTT, and EDTA-free protease inhibitor cocktail (Roche, Basel, Switzerland). After centrifugation at 10,000× g for 10 min, Flag-MAVS CARD was selectively bound to M2-antibody-conjugated agarose beads and eluted by Flag peptide. The eluate was fractionated on a Superdex 200 PC 3.2/30 column (GE Healthcare, Uppsala, Sweden) equilibrated in a buffer containing 20 mM Tris–HCl (pH 7.5), 50 mM NaCl and 1.0 mM DTT. Fractions were analyzed by SDS-PAGE and silver staining. cDNA encoding the MAVSΔProTM mutant lacking the proline-rich region (103–153) and the C terminal transmembrane domain (461–540) has been described previously ( Hou et al., 2011 ). The bacterial expression vector pET-28a-His 6 -Sumo-MAVSΔProTM was transformed into BL21 (pLys). Protein expression was induced with 0.20 mM IPTG at 18°C for four hours. After sonication in a lysis buffer containing 10 mM Tris–HCl (pH 8.0), 500 mM NaCl, 0.50 mM DTT, 5.0% glycerol, 0.50 mM PMSF and 10 mM imidazole, cell lysates were centrifuged at 50,000× g for 30 min. His 6 -Sumo-MAVSΔProTM in the supernatant was purified using Ni-NTA affinity resin (QIAGEN, Limburg, Netherlands). Subsequently, the protein was loaded onto HiTrap Q HP column (GE Healthcare), and then eluted with a gradient of NaCl varying from 0.10 M to 0.50 M in a buffer made of 10 mM Tris–HCl (pH 7.5), 5.0% glycerol, 2.0 mM DTT, 1.0 mM EDTA and 0.50 mM PMSF. The fractions containing His 6 -Sumo-MAVSΔProTM, which were eluted with 300 mM NaCl, were pooled together and applied to a Superdex 200 HR 10/30 column (GE Healthcare) equilibrated with a buffer made of 10 mM Tris–HCl (pH 8.0), 150 mM NaCl, 1.0 mM DTT, 1.0 mM EDTA and 0.50 mM PMSF. His 6 -Sumo-MAVSΔProTM was then digested with SUMO protease at 4.0°C overnight. The His 6 -SUMO tag was removed by running the reaction mixture in a Superdex 200 PC 3.2/30 column (GE Healthcare), which was equilibrated in a buffer containing 10 mM Tris–HCl (pH 8.0), 150 mM NaCl and 1.0 mM DTT. The peak fraction of the protein was collected for EM studies.
Show full methods section
Reagents and standard methods Mouse antibody against Flag-tag
(M2) and M2-conjugated agarose were purchased from Sigma-Aldrich (St. Louis, MO); rabbit antibodies against TOM20 and the p65 subunit of NF-κB were from Santa Cruz Biotechnology (Dallas, TX); Alexa Fluor 488 conjugated goat anti-mouse and anti-rabbit antibodies, Alexa Fluor 568 conjugated goat anti-mouse antibody, and Alexa Fluor 633 conjugated goat anti-rabbit antibody were from Invitrogen (Carlsbad, CA). Sendai virus (SeV, Cantell strain, Charles River Laboratories) was used at 100 hemagglutination (HA) units/ml culture media. HEK293T, HEK293T-IFNβ-luciferase, Mavs −/− MEF cells and derivatives were cultured in Dulbecco’s modified Eagle’s medium (DMEM) supplemented with 10% (v/v) cosmic calf serum (Hyclone, Thermo Fisher Scientific, Waltham, MA) with penicillin (100 U/ml) and streptomycin (100 μg/ml). Other chemicals and reagents were from Sigma-Aldrich unless otherwise specified. Protein expression and purification cDNA encoding Flag-tagged MAVS CARD (1–100) has been described previously ( Hou et al., 2011 ). For protein expression, pcDNA3-Flag-MAVS CARD was transiently transfected into HEK293T cells. Cells were harvested 36 hr after transfection and lysed in a buffer containing 20 mM Tris–HCl (pH 8.0), 150 mM NaCl, 10% glycerol, 0.10% Triton X-100, 1.0 mM DTT, and EDTA-free protease inhibitor cocktail (Roche, Basel, Switzerland). After centrifugation at 10,000× g for 10 min, Flag-MAVS CARD was selectively bound to M2-antibody-conjugated agarose beads and eluted by Flag peptide. The eluate was fractionated on a Superdex 200 PC 3.2/30 column (GE Healthcare, Uppsala, Sweden) equilibrated in a buffer containing 20 mM Tris–HCl (pH 7.5), 50 mM NaCl and 1.0 mM DTT. Fractions were analyzed by SDS-PAGE and silver staining. cDNA encoding the MAVSΔProTM mutant lacking the proline-rich region (103–153) and the C terminal transmembrane domain (461–540) has been described previously ( Hou et al., 2011 ). The bacterial expression vector pET-28a-His 6 -Sumo-MAVSΔProTM was transformed into BL21 (pLys). Protein expression was induced with 0.20 mM IPTG at 18°C for four hours. After sonication in a lysis buffer containing 10 mM Tris–HCl (pH 8.0), 500 mM NaCl, 0.50 mM DTT, 5.0% glycerol, 0.50 mM PMSF and 10 mM imidazole, cell lysates were centrifuged at 50,000× g for 30 min. His 6 -Sumo-MAVSΔProTM in the supernatant was purified using Ni-NTA affinity resin (QIAGEN, Limburg, Netherlands). Subsequently, the protein was loaded onto HiTrap Q HP column (GE Healthcare), and then eluted with a gradient of NaCl varying from 0.10 M to 0.50 M in a buffer made of 10 mM Tris–HCl (pH 7.5), 5.0% glycerol, 2.0 mM DTT, 1.0 mM EDTA and 0.50 mM PMSF. The fractions containing His 6 -Sumo-MAVSΔProTM, which were eluted with 300 mM NaCl, were pooled together and applied to a Superdex 200 HR 10/30 column (GE Healthcare) equilibrated with a buffer made of 10 mM Tris–HCl (pH 8.0), 150 mM NaCl, 1.0 mM DTT, 1.0 mM EDTA and 0.50 mM PMSF. His 6 -Sumo-MAVSΔProTM was then digested with SUMO protease at 4.0°C overnight. The His 6 -SUMO tag was removed by running the reaction mixture in a Superdex 200 PC 3.2/30 column (GE Healthcare), which was equilibrated in a buffer containing 10 mM Tris–HCl (pH 8.0), 150 mM NaCl and 1.0 mM DTT. The peak fraction of the protein was collected for EM studies.
Negative-stain electron microscopy
Copper grids (Ted Pella Inc., Redding, CA) coated with a layer of thin carbon film (3–5 nm) were rendered hydrophilic by negative glow discharge in air. A 2-4 μl aliquot of the purified MAVS sample was loaded onto the grids. After 30 s of incubation on the grid at room temperature, the sample was stained with 2.0% phosphotungstic acid (PTA) at pH 8.0 and blotted dry. Samples were imaged in a JEOL 2200FS FEG electron microscope operated at 200 kV with a nominal magnification of 50,000 × (2.84 Å/pixel at the detector level) using a defocus range of −0.7 to −1.5 μm. Images were recorded with an electron dose of 20 e − /Å 2 on a 2K × 2K Tietz slowscan Charge Coupled Device (CCD) camera.
CryoEM sample preparation and data collection Quantifoil
R2/2 grids (Quantifoil Micro Tools GmbH, Jena, Germany) were coated with a thin carbon film (1–3 nm) in order to retain more filaments for imaging. Right before use, the grids were negatively glow-discharged in air. 2.5 μl purified MAVS was loaded onto the grids. Grids were blotted in 100% humidity at 4°C for 5 s before being plunge-frozen into liquid ethane bathed in liquid nitrogen inside a Vitrobot (FEI, Hillsboro, OR). After the specimens were transferred into and kept frozen inside the JEOL 2200FS FEG electron microscope, images were recorded on SO163 films (Eastman Kodak, Rochester, NY) with a nominal magnification of 60,000 × under low-dose conditions (∼20 e − /Å 2 ). A Gatan K2 Summit Direct Detector (Gatan, Pleasanton, CA) was used for testing specimens in the later phase of the project. A total of 358 films were developed using full-strength D19 (Kodak) solution. Micrographs were digitized with a PhotoScan film Scanner (Z/I Imaging GmbH, Germany) at a step size of 7.0 μm. After 2 × 2 binning, the pixel size was 2.33 Å on the specimen. The magnification calibration at the nominal 60,000 × was 61,950 × and the actual pixel size was 2.26 Å. Datasets from other imaging conditions were scaled to this condition after the axial rise of each dataset was independently determined through IHRSR. A total of 30,384 segments were boxed from film data using the EMAN2 program HelixBoxer ( Ludtke et al., 1999 ). To accelerate data collection, we sent the grids of the MAVS CARD filaments to the HHMI Janelia Farm Research Campus, and collected ∼2,100 images with a 4K × 4K Falcon Direct Detector in a Titan Krios microscope. The microscope was operated at 300 kV and was equipped with a Cs corrector. Automatic data collection was run by proprietary software, EPU (FEI, Hillsboro, OR). Images were taken under −2.5 to −4.0 microns of defocus at 29,000 ×, which gave rise to a calibrated pixel size of 2.30 Å at the specimen level. The density of filaments in the cryo specimens was fairly low so that we had to collect a large number of images. After the evaluation of their power spectra, 1,088 Falcon images were selected, and a total of 18,500 short filaments were boxed out for analysis.
EM image processing
The analysis of the datasets of both the MAVS CARD filaments and the MAVSΔProTM filaments followed the IHRSR method developed by Dr Edward Egelman’s group at University of Virginia. The method was implemented in SPIDER. Dr Egelman kindly provided the programs in SPIDER, and the HSEARCH_LORENTZ/HIMPOSE programs. All SPIDER programs were rewritten in order to run with SPIDER Version 19.08 in a Linux cluster that runs the Redhat Enterprise 5.0. Besides, new SPIDER programs were written to refine the map for out-of-plane tilting of the filaments and for local optimization in angle assignment. Extensive technical details could be found in reference ( Mukherjee et al., 2014 ). Briefly, from all images obtained in one session of data collection, the filaments were boxed out into 200 pixel segments (∼45.2 nm long at the specimen level) with 90% overlapping between neighboring ones from the same long filament. Filaments shorter than 200 pixels were discarded. The filament helical axis was always positioned roughly along the Y-axis. The defocus and astigmatism information for each image were determined by CTFFIND2 in the MRC package (IMAGE2010). The filament particles (boxed segments out of the raw filaments) were phase-flipped and band-pass filtered. We also tested the Wiener-filtering with a constant of 0.2 (1/SNR), and did not find significant difference from the phase-flipped dataset. Afterwards the filaments from different images out of one cryo session were pooled together as a subdataset. To start the analysis, we made sure that the summed power spectrum of each subdataset showed a faint (usually fuzzy) layer line at the position of the first meridional line (layer line 9; Figure 1—figure supplement 1A , Figure 4—figure supplement 1B ). The diameter of individual filaments was estimated from the raw images. A cylindrical volume that had the estimated diameter was generated in SPIDER and projected along Y-axis to be used as the first reference. The individual filaments were compared with the projection from the cylindrical volume. The shift in X-direction for each boxed segment (particle) was rounded to the nearest integer and applied to center the particle horizontally. The total power spectrum was calculated from all X-centered particles in the dataset. The four layer lines (LL = 1, 4, 5, and 9) were measured to prepare a (LL, Z*) table. The peak positions were indexed to make a table of (n, R). The n was estimated from a numeric table of Bessel functions from 0 to 14 th orders. The helical indexing led to the initial guess of a 3-start helix (n = 3 or −3), with some uncertainty of a 4-start one (n = 4 or −4). We then tested the refinement for both a 3-start helix and 4-start one separately, and found that the model with a 3-start helical symmetry was able to converge to a 3D map with the right axial rise, but not the one with a 4-start symmetry ( Figure 1—figure supplement 1C,D,G ). Full refinement with n = −4 was done to confirm this point. We therefore concluded that n = 3 was probably right (n = −3 is the mirror and equally possible). With this information, we did the initial analysis of all subdatasets from different cryo sessions independently in order to obtain the rotation angle (ΔΦ) and the axial rise (Δz) for each subdataset. The axial rises for individual datasets collected at different magnifications or from different microscopes were brought together and compared to find the right parameters for interpolating the images in the different datasets and scaled them all together into one large dataset that contained 48,884 particles. The refinement of the large dataset against a cylindrical volume of a diameter of 90 Å quickly led to a stable solution ( Figure 1—figure supplement 1C,D ) with the symmetry parameters of ΔΦ = 53.6° and Δz = 16.5 Å. To test the robustness of the parameters, we also introduced 1.0 Å deviation to the axial rise in the middle of the refinement, and observed the quick recovery of the refinement to the stable solution ( Figure 1—figure supplement 1D ). This test suggested that the solution was quite stable. When we performed multivariate statistical analysis and hierarchical classification of the large dataset in IMAGIC, the Eigen images clearly showed that local bending and symmetry breakdown ( Figure 1—figure supplement 1B ) appeared to be the major defects in the dataset, which might have been a limiting factor to a better resolution. We tried to eliminate a small fraction of images (∼20%) that corresponded to those class-averaged images showing clearly weak symmetry or distortions. But after that, we still saw distortions in the Eigen images calculated from the rest of the images. We therefore did not eliminate ∼50% or more of the data to examine the resolution. After an initial refinement, we sorted the data into nine bins by aligning them against models whose symmetry parameters are centered around (ΔΦ = 53.6°, Δz = 16.5 Å) with ΔΔΦ = 2.0° and ΔΔz = 1.5 Å. The distribution of the particles into these 9 bins followed a Gaussian distribution, and the central bin had 20,825 particles and was selected for further refinement where the out-of-plane tilting was refined in 2° steps to a maximum of 15°. After 140 runs the final map was stable and the symmetry well converged to ΔΦ = 53.6° and Δz = 16.8 Å. The final map was calculated from 15,366 boxed segments. The map after IHRSR was corrected by an average CTF envelope calculated from the CTF parameters for all images used in the final map calculation. After the FSC calculation (see next paragraph), a negative B-factor of −1,100 Å 2 was applied to sharpen the final map to 9.6 Å. To estimate the resolution by FSC, the sorted dataset (20,825 particles) was separated into top and bottom two halves. Two completely independent volumes were obtained by refining the two half datasets against a cylinder. The two refinements starting with different initial symmetry parameters converged to almost exactly the same symmetry parameters: ΔΦ = 53.61° and Δz = 16.68 Å for the first, and ΔΦ = 53.66° and Δz = 16.66 Å for the second. The two volumes without symmetry imposition were aligned in UCSF Chimera ( Pettersen et al., 2004 ). The second volume was shifted by 0.225 pixels and rotated by −28.96° around Y-axis before the FSC calculation ( Figure 1—figure supplement 1E ). The estimated resolution at FSC = 0.5 was 9.6 Å. Because of almost exactly the same symmetry in two volumes, we worried about noise correlation and did not use the 0.143 threshold for our resolution estimate. As a control, we calculated the FSC before the two volumes were aligned, and found that the FSC quickly fell down to below 0.1 at around 40 Å. To confirm that the final map recapitulates the characteristic of the original dataset, we calculated the summed power spectrum of projections from the map at 360 different orientations around its helical axis ( Figure 1—figure supplement 1A , right). The power spectrum showed the same patterns as in the total power of the raw dataset ( Figure 1—figure supplement 1A , left), with layer lines extending to higher resolution range. Analysis of the MAVSΔProTM dataset followed the same procedure. The dataset had only 8,909 particles ( Figure 4—figure supplement 1A,D,E ). We therefore did not sort them against models with varying symmetry parameters. The FSC calculation gave rise to the resolution estimate of 16.4 Å ( Figure 4—figure supplement 1C ). Cryo-electron tomography (cryo-ET) Energy-filtered electron cryo-tomography on the MAVS CARD filaments was carried out from a dataset collected with an FEI Titan Krios cryo-EM at HHMI Janelia Farm Research Campus. The tomography tilt series were collected in a Gatan K2 Summit direct electron detector installed behind a GIF Quantum energy filter. A narrow energy slit of 5 eV was used together with a small objective aperture (50 microns) to enhance image contrast. The data were collected at a nominal magnification of 42,000 ×, corresponding to 2.7 Å per pixel on the K2 camera. The tilt range spans from −60 to +60° with a step size of 3°. The defocus level was set at −6.0 microns. Tomographic reconstruction was carried out using the standard weighted back projection procedure implemented in IMOD ( Yu et al., 2013 ). The tilt series were aligned using patch tracking due to the absence of fiducial gold particles. A non-linear anisotropic diffusion filter was applied to the reconstruction. For better resolution of the helical stripes, five slices that cover the top surfaces of multiple filaments in the tomogram were used to calculate a projection image ( Figure 1—figure supplement 2B ), and the view was from above the filaments. The boxed segments were cropped out and the distance between stripes was measured in the image. The angle between the stripes and the helical axis was estimated manually. Docking the MAVS CARD crystal structure into the EM map The crystal structure of MAVS CARD (PDB Code: 2VGQ) was first docked into the cryoEM density map manually in UCSF Chimera. We tested the docking in the original map and its mirror, and found that the docking to the mirrored map, which has left-handed symmetry, allowed us to position three α-helices of the X-ray model directly into the density features in the map ( Figure 1C ). Recognition of these surface features led to a fairly unique position for the X-ray model and resolved the ambiguity in chirality, consistent with the cryoET results. After one CARD was docked into the map, a hexamer model was built by applying symmetry operations. We segmented the cryoEM density and extracted a portion that represents a hexamer formed by two layers of protein subunits using the segmentation tools in UCSF Chimera. Subsequently, the hexamer model was optimized using SITUS ( Wriggers, 2010 ) to find a local best position with the symmetry constraints. The side chains of a few charged residues (D23, E26, R37, R64 and R65) at the inter-strand interface in the model were optimized by testing different rotamers in Coot to produce the model in Figure 2B ( Emsley et al., 2010 ). The two videos were made with Chimera. Screen for soluble MAVS CARD mutants in E. coli Creation and solubility screen of mutant libraries of the human and horse CARDs were performed as described previously ( Harada et al., 2008 ). Briefly, the coding regions of the MAVS CARD (residues 2–98) were randomly mutagenized by using error-prone PCR, and sub-cloned into the pBAD/DHFR vector (kindly provided by Dr James Bowie at UCLA) between the NcoI/SalI restriction sites. Plasmids were transformed into Top10 cells (Invitrogen) to express CARD mutants fused to the C-terminus of DHFR. Cells were grown on M9 minimal medium plates containing 100 μg/ml ampicillin, 0.20% arabinose and with or without 1 μg/ml trimethoprim at 37°C for 72 hr. Colonies that grew in the presence of trimethoprim were candidate clones expressing soluble CARD mutants. Plasmids from these clones were sequenced to identify their mutations in the CARD domain. The mutants were subsequently subcloned into a modified pET28a vector that encodes an N-terminal His 6 -tag and a cleavage site of human rhinovirus C3 protease ( He et al., 2009 ), and expressed in the bacterial strain BL21 DE3 using a standard procedure. Proteins were purified using Ni-NTA and gel filtration chromatography. The N-terminal tag was removed by treatment of human rhinovirus C3 protease. Mutants were identified as soluble if the proteins could be purified and behaved as a homogenous monomeric peak in gel filtration chromatography. Crystallization and structure determination of soluble MAVS CARD mutants Well-behaving CARD mutants were concentrated and subjected to crystallization trials. Many mutants of horse CARD crystallized in multiple conditions, many of which belonged to the same crystal form as shown by preliminary diffraction experiments. The E26R and R64C mutants, both mapped to the electrostatic interface for mediating MAVS oligomerization, were chosen for structure determination. Crystals of E26R at 1.1 mg/ml grew in 0.10 M MES (pH6.5), 30%PEG 5000 MME, 0.20 M ammonium sulfate at 20°C. Crystals of R64C at 1.5 mg/ml grew in Bis-Tris (pH6.5), 25% PEG 3350, 0.20 M ammonium acetate at 20°C. Crystals were flash-cooled in liquid nitrogen in their crystallization buffers supplemented with 25% glycerol. Diffraction data for E26R were collected at 100 K in Beamline 19ID of the Advanced Photon Source (Argonne National Laboratory). Data for R64C were collected at 100 K with a Rigaku X-ray source using a Raxis IV detector. Diffraction data were indexed, integrated and scaled by using HKL2000 ( Otwinowski and Minor, 1997 ). The structure of the human MAVS CARD (PDB ID: 2VGQ) was used as the search model for molecular replacement using Phaser in the Phenix package ( Adams et al., 2002 ; McCoy et al., 2007 ). Iterative model building and refinement were performed in Phenix and Coot, respectively ( Emsley and Cowtan, 2004 ). The data collection and refinement statistics were summarized in Supplementary file 1 .
Interferon-β luciferase reporter assay
HEK293T cells stably expressing both Renilla luciferase (as an internal control) and IFNβ promoter driving firefly luciferase were transfected with the indicated amounts of cDNAs for Flag-tagged wide-type MAVS or its mutants. 24 hr after transfection, cells were harvested to measure the expression of luciferase using a dual luciferase assay kit (Promega, Madison, WI). Confocal and SR-SIM imaging Mavs −/− MEFs stably expressing wide-type MAVS or its mutants were grown on sterile glass coverslips in 12-well plates. 12 hr after Sendai virus infection, cells were first stained with MitoTracker Red according to the manufacturer’s instructions (Invitrogen). Cells were then fixed with 4.0% paraformaldehyde in PBS for 15 min, permeabilized in PBS containing 0.10% Triton X-100 for 5 min, and blocked in PBS containing 0.10% Triton X-100 and 10% BSA for 30 min at room temperature. After blocking, the cells were incubated with specific primary antibodies for 1 hr, washed and then incubated with suitable Alexa Fluor 488 (or Alexa Fluor 568 or Alexa Fluor 633)-conjugated secondary antibodies for another hour. After careful wash, the slides were mounted with the VECTASHIELD mounting medium with DAPI (Vector Laboratories). Imaging of the cells was carried out using a Zeiss LSM510 META laser scanning Confocal Microscope or a Zeiss ELYRA PS.1 Super-Resolution Structured Illumination Microscope (SR-SIM). Z-stacks with an interval of 110 nm were used to section the whole cell for 3D-SR-SIM. Images were analyzed using the Zen2011 software (Zeiss) or ImageJ. Alignment and reconstruction of 3D-SIM images were performed using IMARIS (Bitplane).
Quantitative reverse transcription
PCR (q-RT-PCR) Total RNA was isolated using TRIzol (Invitrogen). 0.1 μg of total RNA was reverse-transcribed into cDNA with iScript cDNA synthesis kit (Bio-Rad, Hercules, CA). The resulting cDNAs served as the templates for Quantitative-PCR analysis using iTaq Universal SYBR Green Supermix (Bio-Rad) and ViiTM7 Real-Time PCR System (Applied Biosystems Inc., Foster City, CA). Primers for specific genes are: Mouse β-actin, 5′-TGACGTTGACATCCGTAAAGACC-3′ and 5′-AAGGGTGTAAAACGCAGCTCA-3′; Mouse IFNβ, 5′-CCCTATGGAGATGACGGAGA-3′ and 5′-CTGTCTGCTGGTGGAGTTCA-3′. Semi-denaturing detergent agarose gel electrophoresis (SDD-AGE) The formation of prion-like aggregates of MAVS and its mutants was analyzed by SDD-AGE as previously described ( Hou et al., 2011 ).
Reagents and standard methods Mouse antibody against Flag-tag
(M2) and M2-conjugated agarose were purchased from Sigma-Aldrich (St. Louis, MO); rabbit antibodies against TOM20 and the p65 subunit of NF-κB were from Santa Cruz Biotechnology (Dallas, TX); Alexa Fluor 488 conjugated goat anti-mouse and anti-rabbit antibodies, Alexa Fluor 568 conjugated goat anti-mouse antibody, and Alexa Fluor 633 conjugated goat anti-rabbit antibody were from Invitrogen (Carlsbad, CA). Sendai virus (SeV, Cantell strain, Charles River Laboratories) was used at 100 hemagglutination (HA) units/ml culture media. HEK293T, HEK293T-IFNβ-luciferase, Mavs −/− MEF cells and derivatives were cultured in Dulbecco’s modified Eagle’s medium (DMEM) supplemented with 10% (v/v) cosmic calf serum (Hyclone, Thermo Fisher Scientific, Waltham, MA) with penicillin (100 U/ml) and streptomycin (100 μg/ml). Other chemicals and reagents were from Sigma-Aldrich unless otherwise specified.
Additional files 10.7554/eLife.01489.019 Supplementary file 1. Statistics for X-ray crystallographic data collection and model refinement. DOI: http://dx.doi.org/10.7554/eLife.01489.019 Major datasets The following datasets were generated: Zhang X , He X , 2014 , Crystal structure of horse MAVS card domain mutant E26R , 4O9L ; http://www.rcsb.org/pdb/search/structidSearch.do?structureId=4o9l , Publicly available at RCSB Protein Data Bank ( http://www.rcsb.org ). Zhang X , He X , 2014 , Crystal structure of horse MAVS card domain mutant R64C , 4O9F ; http://www.rcsb.org/pdb/search/structidSearch.do?structureId=4o9f , Publicly available at RCSB Protein Data Bank ( http://www.rcsb.org ). Jiang Q-X , Xu H , 2014 , cryoEM density map of MAVS CARD , EMD-5890 ; http://www.ebi.ac.uk/pdbe/entry/EMD-5890 , Publicly available at EMDB ( http://www.ebi.ac.uk/pdbe/emdb/ ). Jiang Q-X , Xu H , 2014 , cryoEM density map of MAVSdeltaProTM , EMD-5891 ; http://www.ebi.ac.uk/pdbe/entry/EMD-5891 , Publicly available at EMDB ( http://www.ebi.ac.uk/pdbe/emdb/ ). Jiang Q-X , Xu H , 2014 , Atomic model of MAVS CARD , 3J6C ; http://www.rcsb.org/pdb/search/structidSearch.do?structureId=3j6c , Publicly available at RCSB Protein Data Bank ( http://www.rcsb.org ). The following previously published dataset was used: Potter JA , Randall RE , Taylor GL , 2008 , Crystal structure of human IPS-1/MAVS/VISA/Cardif caspase activation recruitment domain , 2VGQ ; http://www.rcsb.org/pdb/explore/explore.do?structureId=2vgq , Publicly available at RCSB Protein Data Bank ( http://www.rcsb.org ).
📊 Figures
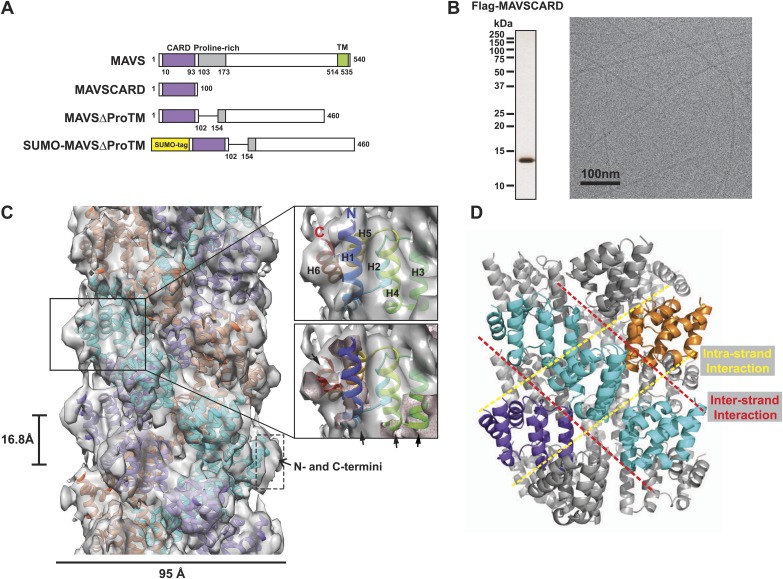
Figure 1.
CryoEM reconstruction of MAVS CARD filaments.
( A ) Diagrams of the domain organization in MAVS and deletion mutants used in this study. ( B ) Flag-MAVS CARD purified from HEK293T cells analyzed by silver stained SDS-PAGE and cryoEM imaging. The ...
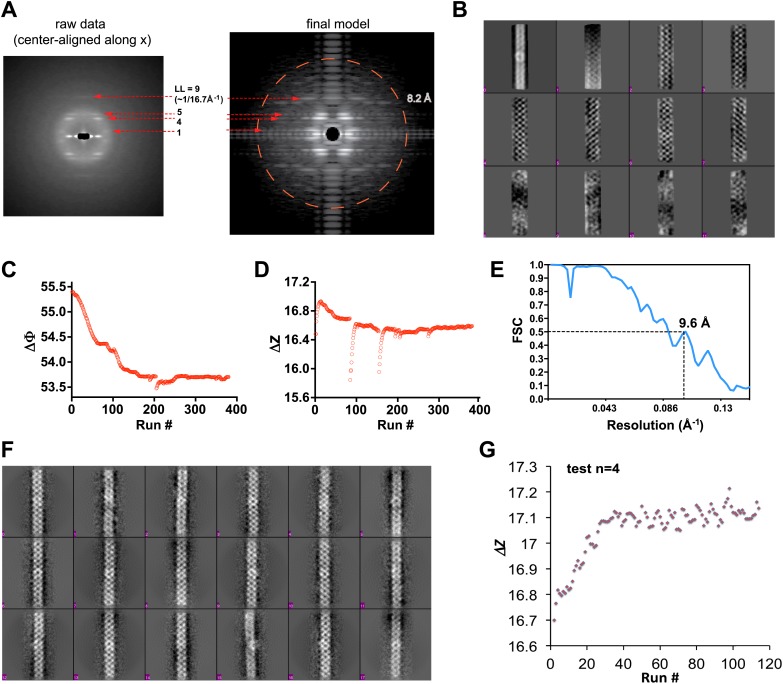
Figure 1u2014figure supplement 1.
Processing of cryoEM images of the MAVS CARD filaments.
( A ) Left, summed power spectrum from a set of horizontally centered particles; right, summed power spectrum from 360 projections of the final cryoEM map of MAVS CARD filament. To better exhibit the ...
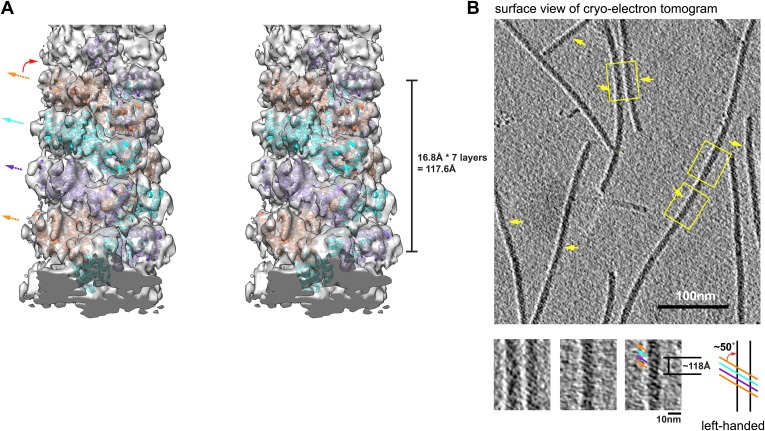
Figure 1u2014figure supplement 2.
Structural model of MAVS CARD filaments and its chirality determination by cryo electron tomography (cryo-ET).
( A ) A cross-eye stereo view of the cryoEM map of the MAVS CARD filament with multiple copies of the MAVS CARD X-ray models (PDB: 2VGQ) docked in position, showing the left-handed three-stranded heli...
Video 1.
3D reconstruction of the MAVS CARD filament.
DOI: http://dx.doi.org/10.7554/eLife.01489.006
Video 2.
Building a pseudoatomic model from the cryoEM map.
The cryoEM map of the MAVS CARD filament is shown at two different density levels together with the pseudoatomic model, and individual units are assembled into a long filament. DOI: http://dx.doi.org/...
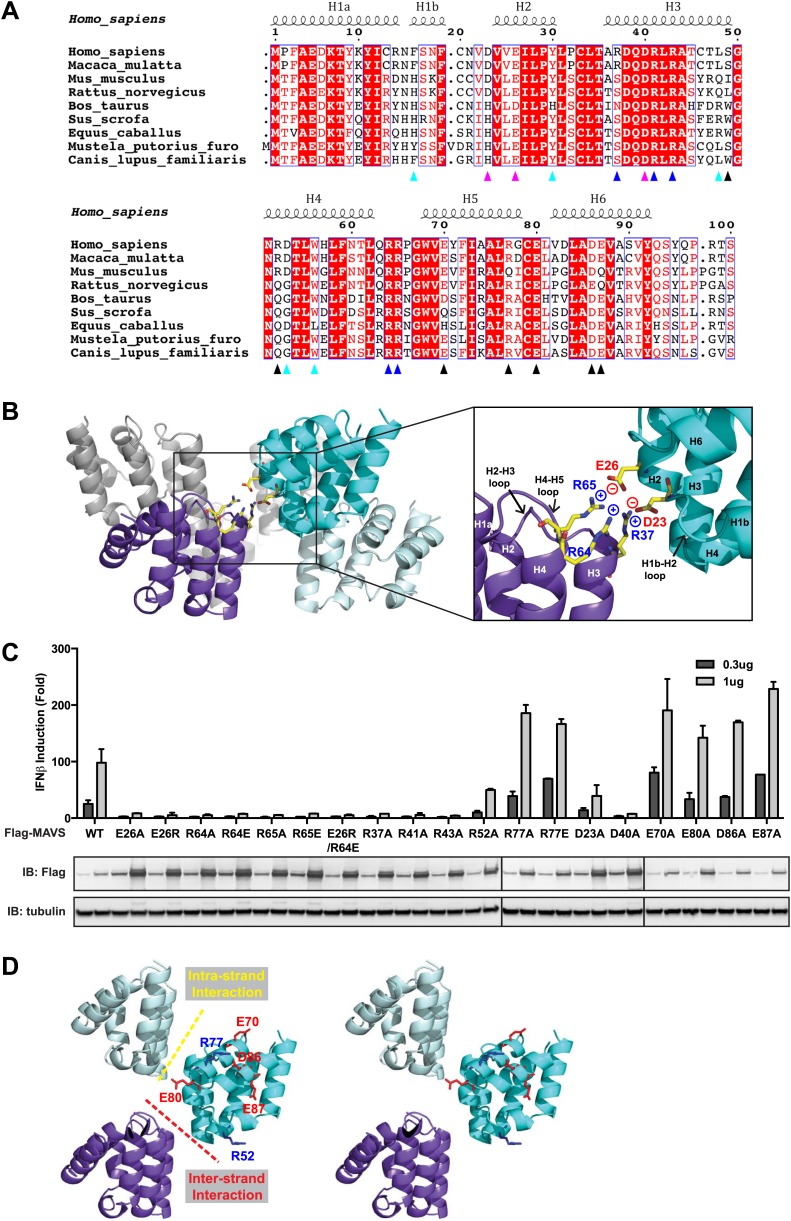
Figure 2.
Charged residues are conserved at the inter-strand interface of MAVS CARD filament.
( A ) Sequence alignment of the MAVS CARD from 10 different species with the secondary structures based on the X-ray model of human MAVS CARD. The alignment was generated with ClustalW ( http://www.eb...
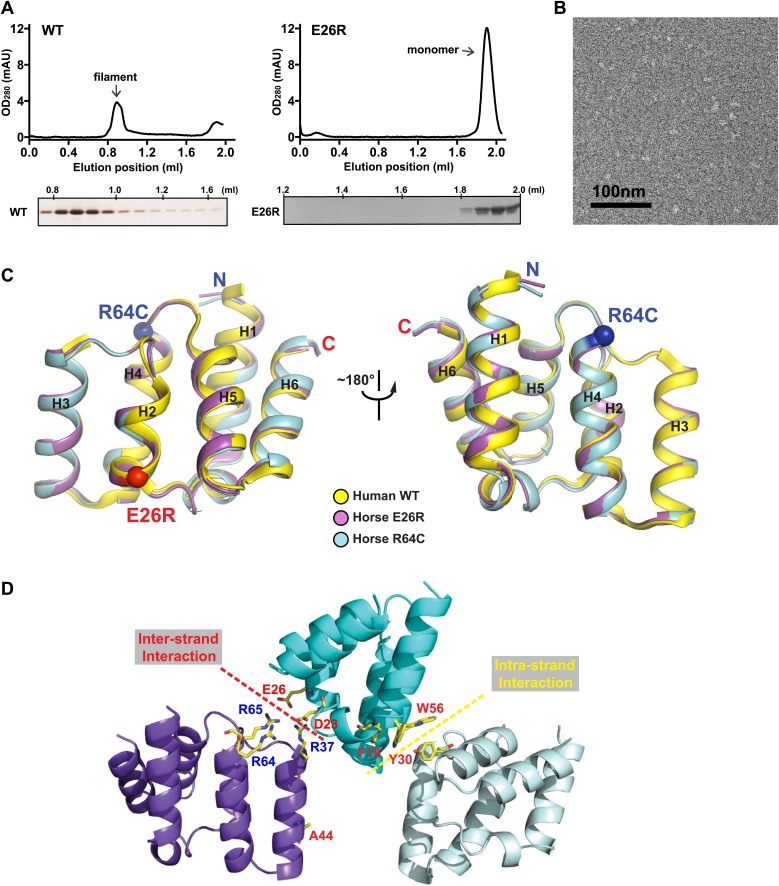
Figure 2u2014figure supplement 1.
Mutations at the inter-strand interface disrupt MAVS CARD polymerization.
( A ) Size-exclusion chromatography of recombinant wild-type human MAVS CARD and the E26R mutant. Aliquots of the fractions were analyzed by silver staining (left) or Coomassie blue staining (right). ...
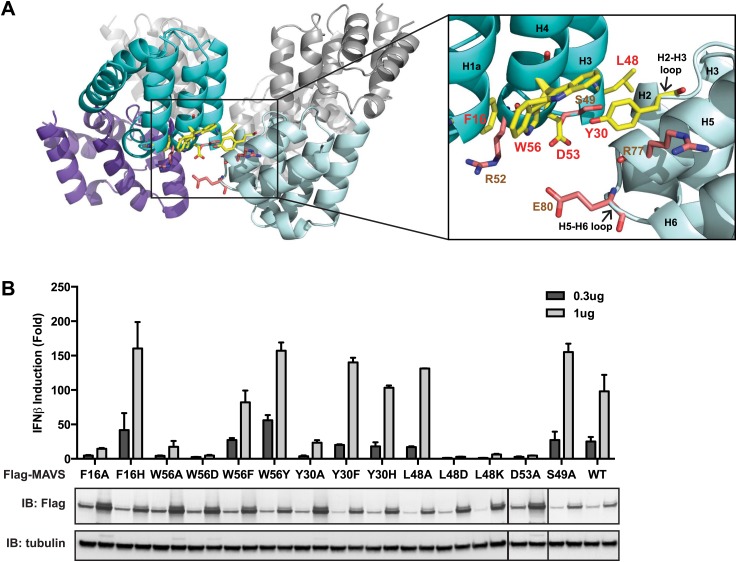
Figure 3.
The intra-strand interface is mediated by hydrophobic interactions and hydrogen bonding.
( A ) MAVS CARD hexamer model with interacting residues at the intra-strand interface shown as yellow sticks. Residues that showed normal activity when substituted with alanine are displayed in brown....
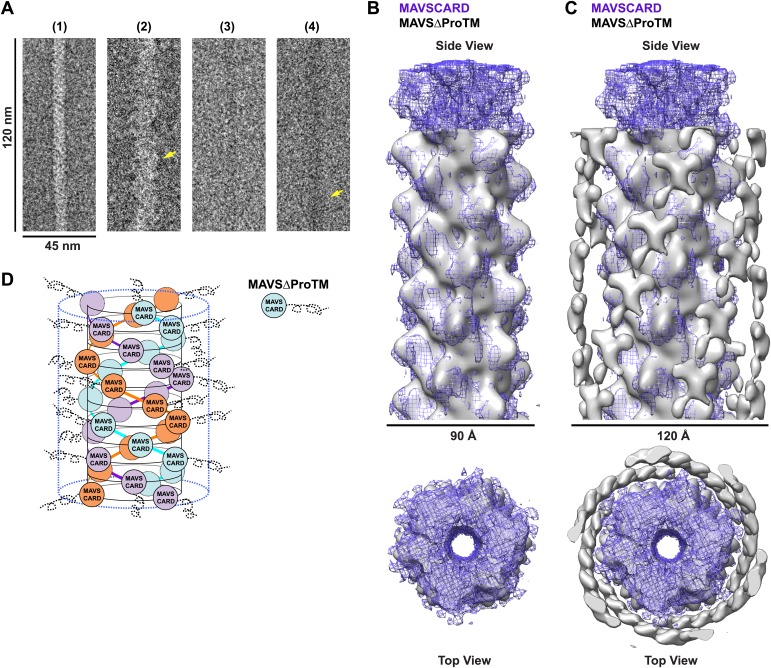
Figure 4.
CARD filament is the organization center of the MAVS Filament.
( A ) Segments from negative-stain EM images of (1) Flag-MAVS CARD and (2) MAVSu0394ProTM and those from cryoEM images of (3) Flag-MAVS CARD and (4) MAVSu0394ProTM. For better visualization, protein i...
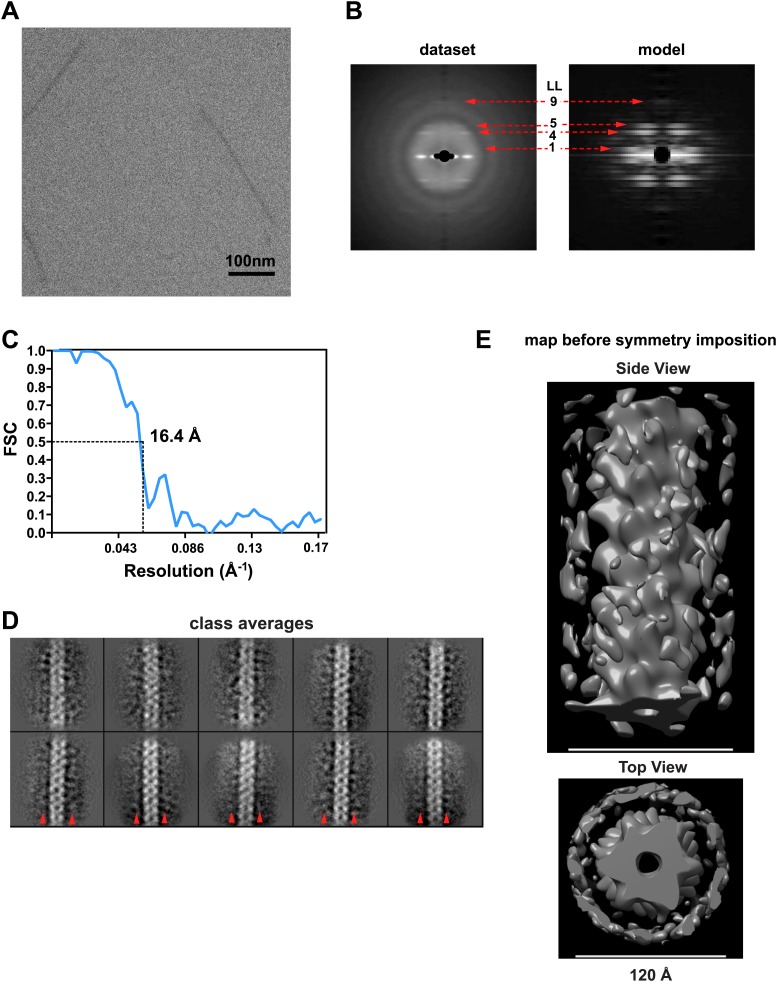
Figure 4u2014figure supplement 1.
Image processing for the MAVSu0394ProTM filaments.
( A ) A typical cryoEM image of MAVSu0394ProTM filaments (protein is black). Scale bar, 100 nm. ( B ) Summed power spectrum of boxed segments of MAVSu0394ProTM filaments after central alignment along ...
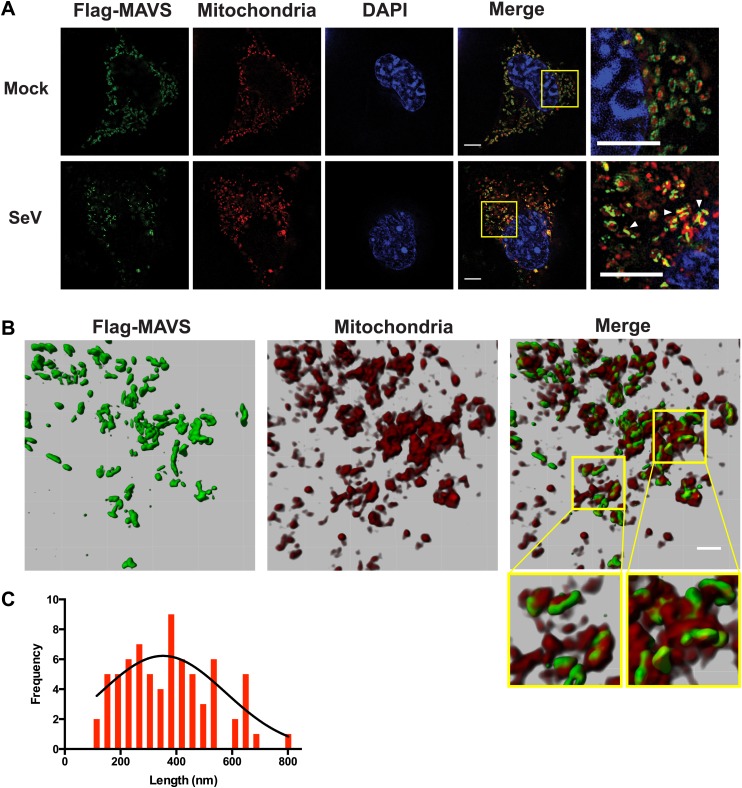
Figure 5.
In virus-infected cells MAVS redistributes and forms rod-shaped puncta on the surface of mitochondria.
( A ) Mavs u2212/u2212 MEF cells stably expressing Flag-tagged wild-type MAVS were mock-treated or infected with Sendai virus (SeV) for 12 hr and stained with MitoTracker (Mitochondria; red) and anti-...
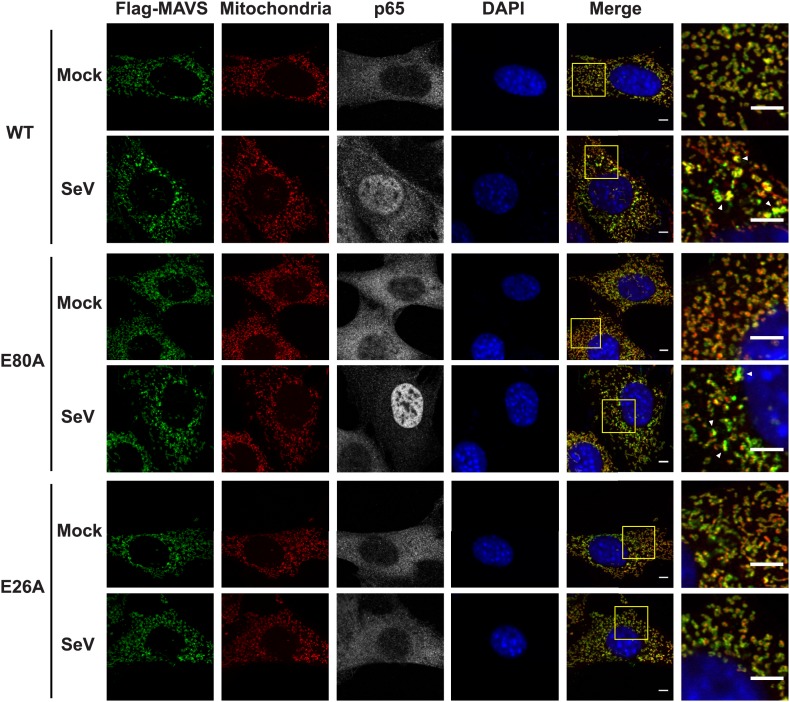
Figure 5u2014figure supplement 1.
Mutations at the inter-strand interface that disrupt CARD polymerization abolish the SeV-induced redistribution of MAVS on mitochondria.
Mavs u2212/u2212 MEF cells stably expressing Flag-tagged wild-type MAVS or its mutants were mock-treated or infected with SeV for 12 hr and stained with MitoTracker (Mitochondrial matrix; red), anti-F...
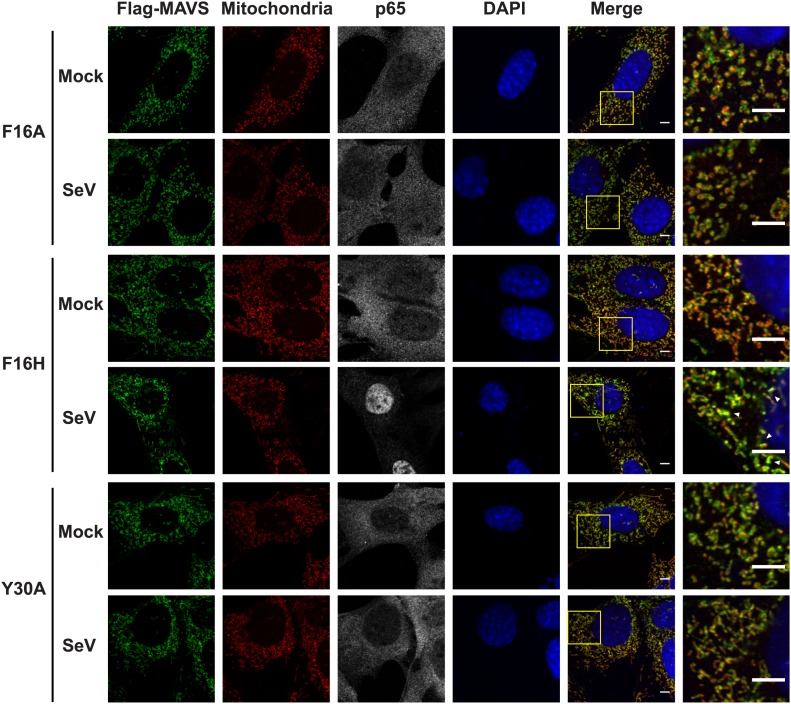
Figure 5u2014figure supplement 2.
Mutations at the intra-strand interface that disrupt CARD polymerization abolish the SeV-induced redistribution of MAVS on mitochondria.
Similar to the Figure 5u2014figure supplement 1 , mutations of two important residues (F16 and Y30) at the intra-strand interface were tested in a similar fashion. Scale bar, 5.0 u03bcm. DOI: http://d...
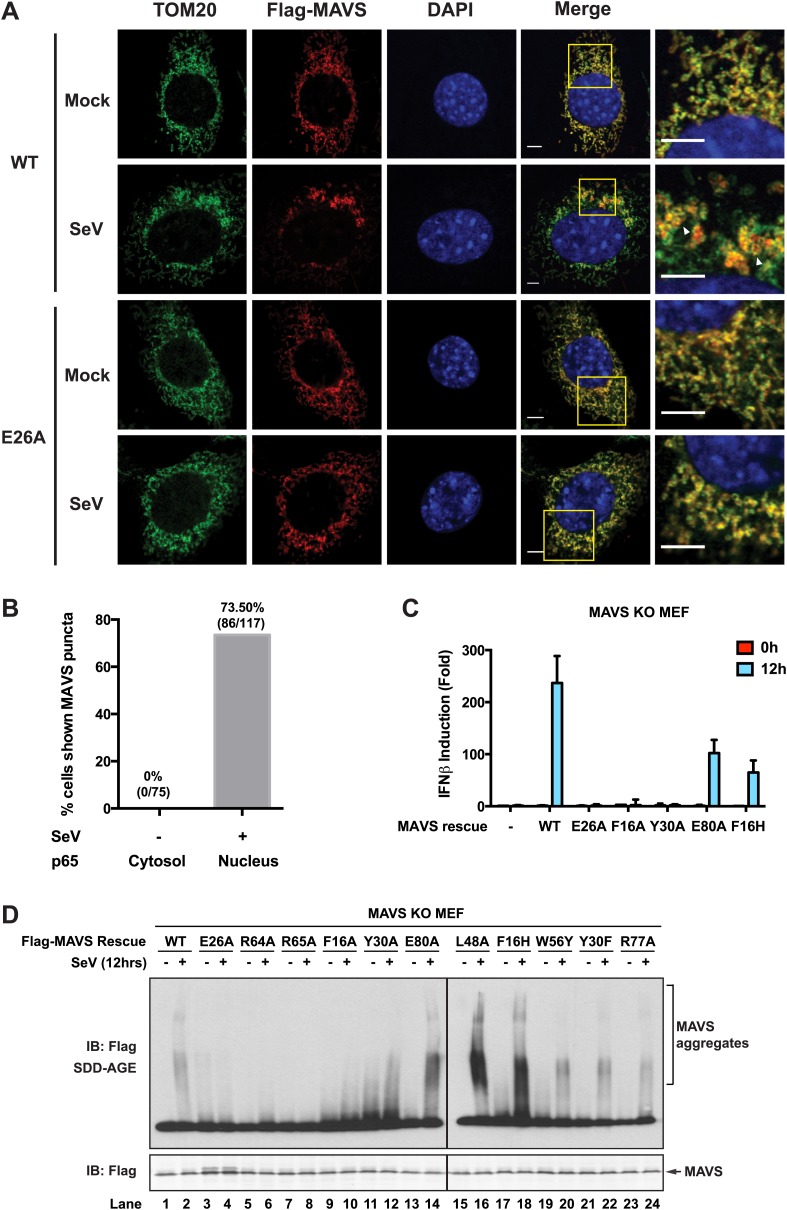
Figure 5u2014figure supplement 3.
Strong correlations among MAVS puncta formation, MAVS signaling and MAVS CARD polymerization.
Mavs u2212/u2212 MEF cells stably expressing Flag-tagged wild-type MAVS or its mutants were mock-treated or infected with SeV for 12 hr. ( A ) As in Figure 5u2014figure supplement 1 , MAVS puncta form...
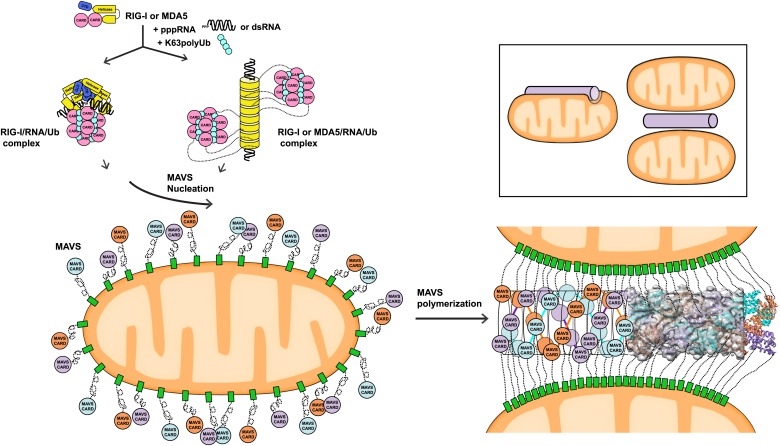
Figure 6.
A working model for MAVS activation by RIG-I/RNA complexes.
Detection of 5u2019-pppRNA by RIG-I or dsRNA by MDA5 or RIG-I triggers the formation of RIG-I (or MDA5)/RNA/polyUb complex. The CARD domains of individual complexes are poised properly to attract thre...
Figure images are served from the NIH/NLM PubMed Central Open Access Subset or Europe PMC; copyright remains with the publishers and authors.
💬 Discussion
0 commentsNo comments yet. Be the first to start a discussion!
Leave a Comment