Abstract
AbstractSignals arising from bacterial infections are detected by pathogen recognition receptors (PRRs) and are transduced by specialized adapter proteins in mammalian cells. The Receptor-interacting-serine/threonine-protein kinase 2 (RIPK2 or RIP2) is such an adapter protein that is critical for signal propagation of the Nucleotide-binding-oligomerization-domain-containing proteins 1/2 (NOD1 and NOD2). Dysregulation of this signaling pathway leads to defects in bacterial detection and in some cases autoimmune diseases. Here, we show that the Caspase-activation-and-recruitment-domain (CARD) of RIP2 (RIP2-CARD) forms oligomeric structures upon stimulation by either NOD1-CARD or NOD2-2CARD. We reconstitute this complex, termed the RIPosome in vitro and solve the cryo-EM filament structure of the active RIP2-CARD complex at 4.1 Å resolution. The structure suggests potential mechanisms by which CARD domains from NOD1 and NOD2 initiate the oligomerization process of RIP2-CARD. Together with structure guided mutagenesis experiments at the CARD-CARD interfaces, we demonstrate molecular mechanisms how RIP2 is activated and self-propagating such signal.
🔬 Techniques
✨ Fluorophores
🧪 Sample Preparation
🔬 Cell Lines
🏭 Microscope Brands
🧪 Reagent Suppliers
📷 Detectors
💻 Software Details
💾 Data Repositories
🏛️ Research Organizations (ROR)
Affiliated research institutions:
📋 Methods
Plasmid construction To prepare plasmids for mammalian cell expression, wild type and variants of NOD1 full-length (1–953, synthesized by Creative Biogene), NOD2 full-length (1–1040, synthesized by Creative Biogene), and flag-tag RIP2 full-length (1–540, cDNA from MegaMan Human Transcriptome Libraries) were cloned into pcDNA3.1 between the HindIII and XhoI restriction sites (Supplementary Tables 2 and 3 ). For recombinant CARD proteins, NOD1–CARD (residues 1–110)–SNAP and NOD2–CARD (residues 28–220)–SNAP, RIP2–CARD (residues 432–540)–SNAP were inserted into pcDNA3.1 by HindIII and XbaI restricition sites. Site-directed mutagenesis was performed using the KAPA Hifi PCR kits (KAPA Biosystems). To generate the CARD–SNAP recombinant proteins, SNAP-tag was inserted between the EcoRI and XhoI restriction sites into pET47b (Novagen). The RIP2–CARD, NOD1–CARD, and NOD2–CARD were then inserted between the XmaI and EcoRI restriction sites. Several SNAP–RIP2–CARD constructs were designed to obtain single filaments instead of bundles for further structural analysis. N-terminal 13 extra amino acids—VDEALREAQTKSA—named 13aa was attached to the N-terminal of RIP2–CARD and then this insert was cloned into the pSnap-tag (T7)-2 vector (New England Biolabs) between the EcoRI and NotI restriction sites after the SNAP sequence. The RIP2–CARD (432–540) domain was further optimized by removing the flexible C-terminal tail to prepare RIP2–CARD (432–529), which was used to collect good-quality RIP2 filament micrographs.
Show full methods section
Plasmid construction To prepare plasmids for mammalian cell expression, wild type and variants of NOD1 full-length (1–953, synthesized by Creative Biogene), NOD2 full-length (1–1040, synthesized by Creative Biogene), and flag-tag RIP2 full-length (1–540, cDNA from MegaMan Human Transcriptome Libraries) were cloned into pcDNA3.1 between the HindIII and XhoI restriction sites (Supplementary Tables 2 and 3 ). For recombinant CARD proteins, NOD1–CARD (residues 1–110)–SNAP and NOD2–CARD (residues 28–220)–SNAP, RIP2–CARD (residues 432–540)–SNAP were inserted into pcDNA3.1 by HindIII and XbaI restricition sites. Site-directed mutagenesis was performed using the KAPA Hifi PCR kits (KAPA Biosystems). To generate the CARD–SNAP recombinant proteins, SNAP-tag was inserted between the EcoRI and XhoI restriction sites into pET47b (Novagen). The RIP2–CARD, NOD1–CARD, and NOD2–CARD were then inserted between the XmaI and EcoRI restriction sites. Several SNAP–RIP2–CARD constructs were designed to obtain single filaments instead of bundles for further structural analysis. N-terminal 13 extra amino acids—VDEALREAQTKSA—named 13aa was attached to the N-terminal of RIP2–CARD and then this insert was cloned into the pSnap-tag (T7)-2 vector (New England Biolabs) between the EcoRI and NotI restriction sites after the SNAP sequence. The RIP2–CARD (432–540) domain was further optimized by removing the flexible C-terminal tail to prepare RIP2–CARD (432–529), which was used to collect good-quality RIP2 filament micrographs.
Protein purification
For the expression of the His-tagged recombinant proteins, the constructed plasmids were transformed into BL21(DE3) (NEB) and grown at 37 °C for 16–18 h. Then the starting culture was transferred to a larger volume of lysogeny broth (LB), which was grown until an OD600 of about 0.6–0.8, then the temperature was lowered to 16 °C, and cells were induced with 0.5 mM IPTG and grown overnight. Bacteria were harvested at 4600 × g (Avanti JXN series, Beckman Coulter) for 10 min and then resuspended with lysis buffer (20 mM Tris-HCl, pH 8.0, 300 mM NaCl, 20 mM imidazole, and 10% glycerol). Cells were then lysed by Emulsiflex-C3, and centrifuged at a speed of 30,000 × g (Avanti JXN series, Beckman Coulter) for 20 min at 4 °C to separate supernatant and pellet. The supernatant was passed through a pre-equilibrated column containing Ni-NTA agarose beads (ThermoFisher Scientific) by gravity. The column was then washed with lysis buffer containing 20 mM imidazole to remove nonspecific binding proteins. His-tagged proteins were eluted with elution buffer that contained 300 mM imidazole. To further purify our recombinant proteins, size-exclusion chromatography (Superdex 200 increase, GE Healthcare) was performed in buffer A (20 mM Tris-HCl, pH 8.0, 150 mM NaCl, and 1 mM DTT). At this step, the purified proteins were the oligomeric pre-activated seed fraction of RIP2–CARD. For monomeric RIP2–CARD, it was prepared following the protocol as described here. Concentrated and purified soluble pre-activated RIP2–CARD at around 10 mg/ml was buffer exchanged into 10 ml of 6 M guanidinium, and gradually dialyzed against 3, 2, 1.5, 1, 0.8, and 0.6 M guanidinium containing buffer A in the cold room, and eventually in buffer A. In the absence of stimuli, refolded SNAP–RIP2–CARD protein remained monomeric for 24 h.
Oligomerization assay
RIP2–CARD monomers that were labeled with Alexa Fluor 647 (New England Biolabs) and seeds were incubated with Alexa Fluor 488 (New England Biolabs) for 10 min separately. One microliter of 100 μM BG-Alexa dye stocks (dissolved in water containing 5% DMSO) were added into every 100 μl of pre-labeling protein stock at a concentration of 20 μM. To check whether NOD1–CARD and NOD2-CARD seeds can interact with RIP2–CARD monomer, fluorescently labeled monomeric SNAP–RIP2–CARD (10 μM) was mixed with 5 or 10 μM NOD1–CARD–SNAP and NOD2–CARD–SNAP for 15 min at room temperature before analysis by Bis-Tris native PAGE gel (Life) or 15% SDS-PAGE gel. The double fluorescently labeled gel was run at a voltage of 200 V for 60 min. Once the EMSA was completed, they were visualized by Typhoon FLA7000 (GE Healthcare) with 100-μm pixel size at channels 488 and 647 using PTM 600. To form RIP2 prion-like long filament (200–500 nM), ~20 μM monomeric SNAP–RIP2–CARD was mixed with unlabeled, wild-type SNAP–RIP2–CARD seeds at a molar ratio of 10:1 for overnight. Later on, in-house-prepared MBP-3C-protease 36 was added to the fully extended filament with a final concentration of 0.5 μM. The digestion was performed at 4° for 8 h, before further purification to separate the core filament, the cleaved-off SNAP tags, and the proteases. Extended SNAP–RIP2–CARD thick filament and 3C-protease-digested core RIP2–CARD thin filament were then purified using size-exclusion column Superose 6 (GE Healthcare), before structural analysis.
Genome-editing vectors and reagents
All sgRNA-expression vectors were built on the pSpCas9(BB)-2A-Puro (PX459) V2.0 backbone (Addgene plasmid no. 62988). sgRNAs were designed with the GUIDES web-based CRISPR design tool ( http://guides.sanjanalab.org/#/ ). Guide sequences are provided as below. As required, DNA sequences for the guides were modified at position 1 to encode a G, owing to the transcription-initiation requirement of the human U6 promoter. CRISPR–Cas9-driven targeted mutagenesis of RIPK2 HEK293T (Sigma-Aldrich) cells were transiently transfected with Lipofectamine 2000 (Invitrogen) as per the manufacturer’s recommendations. As demonstrated by Agudelo et al. 50 , 1 μM ouabain (Sigma) was added directly to the cells during the culture-medium change at day 4 after the transfection, replenished every 3 or 4 days, and maintained for 10 days. Surviving clones of genome-edited HEK293T cells in ATP1A1 and RIPK2 were subsequently used for the downstream experiments. Sequences for SpCas9 guides ATP1A1 G2: GATCCAAGCTGCTACAGAAG RIPK2 G1: GATAATGTATAGTGTGTCACA RIPK2 G2: GACTATTTTCATGGAGCTGAG RIPK2 G3: GAGATCATACGTGCTCGGTG RIPK2 G4: GAGTTTCCTGCAGTTGAGAG Luciferase assays HEK293T cells were plated into 24-well plates (Greiner) 24 h prior to transfection. Plasmid mixtures were pre-mixed with Lipofectamine 2000 (Invitrogen) as per the manufacturer’s recommendations before being added to the cell culture. The media containing transfection reagent was exchanged back to normal media 8 h post transfection. Dual luciferase assays were carried out with the dual luciferase reporter assay system (Promega). Cells from each well were harvested 24 h post transfection and lysed using 200 μl of 1x passive lysis buffer (Promega). Fifty microliters of the cell lysates were aliquoted onto 96-well white flat-bottom chimney well plates (Greiner). Luciferase Assay Reagent II (Promega) was first added to each well and the plate was read in a Tecan plate reader to record luminescence in each sample. Then Stop and Glow® reagent (Promega) was added to each well to quench firefly luciferase activity while allowing measurement of luminescence from Renilla luciferase by Tecan plate reader. The dual luciferase system is consisted of two different reporter genes, firefly ( Photinus pyralis ) and Renilla ( Renilla reniformis ) luciferase on two separate plasmids. The gene encoding firefly luciferase is under the control of NF-κB promoter and the gene encoding Renilla promoter is fused to a constitutive CMV promoter. The two plasmids were cotransfected into each sample with a ratio of 5:1 for NF-κB-firefly vector:CMV- Renilla co-reporter vector combinations. Twenty-four hours post transfection, the cells were harvested and the activities of luciferases were measured sequentially from a single sample. The relative light units were first calculated as the ratio of firefly to Renilla luciferase activity. Then the data were presented as relative light units of induced cells/relative light units of control cells. The blank control samples in each experiment were cells mock-transfected with empty pcDNA3-FLAG vectors. For each plot, the data represented the means of three independent assays with the bars indicating standard error in each sample.
Tissue culture and transfection
All cells were maintained at 37 °C with 5% CO 2 in DMEM (Gibco) supplemented with 10% (v/v) fetal bovine serum (Gibco). HEK293T cells were plated at a density of 5 × 10 5 cells per well for poly-L-lysine- (Sigma-Aldrich) coated six-well plate or 1 × 10 5 cells per well for a 24-well plate 24 h prior to transfections. Plasmids were transfected into HEK293T cells using FuGENE HD (Promega) with a “5:1“ ratio according to the manufacturer’s instructions. For protein electroporation, HEK293T cells were at 80% confluency before experiments. Cells were harvested and washed twice with PBS. For each reaction, 2 × 10 6 cells were resuspended in 100 μL of resuspension buffer R (Thermofisher). Proteins (20 μg) were then transfected using NEON transfection system (Thermofisher) according to the manufacturer’s recommendations. Cells were harvested 8 h post electroporation. Immunoblots HEK293T cells were plated into six-well plates (Corning) 24 h prior to transfection. Cells were harvested 24 h post transfection and lysed using RIPA buffer (150 mM NaCl, 50 mM Tris, pH 8, 1 mM EDTA, 1% (v/v) Triton X-100, 0.1% (w/v) sodium dodecyl sulfate, and 0.5% (w/v) sodium deoxycholate) on ice for 30 min with vortexing every 5 min. Cell lysates were centrifuged for 5 min at 10,000× g at 4 °C to separate the pellet and supernatant fractions, and each component was subjected to SDS-PAGE. Actin control western blot was performed using the 18,000 × g supernatant fractions of each cell lysate. Transblotting was done by the Mini Trans-Blot® Cell (Bio-Rad) onto PVDF membrane (Bio-Rad), which was then blocked by 10% (w/v) blocking grade powder (Bio-Rad) diluted in TBST (50 mM Tris-HCl, pH 7.4, 140 mM NaCl, and 0.1% Tween20). Next, the blot was incubated with primary antibodies in 1x TBST with 5% (w/v) BSA (Biowest) at room temperature for 1 h or 4 °C overnight. Secondary antibody incubation was performed for 1 h at room temperature. WesternBright Sirius, a femtogram HRP substrate (Advansta) was added to each blot and left for 1 min. The blot was visualized with Chemi-Doc (Bio-Rad). All the western blots were representative of at least three independent experiments. Lot of information of commercial antibodies was included in Supplementary Table 4 . In the displayed figures, anti-RIP2 antibody was used in a (1:500) dilution ratio; anti-phospho-RIP2 antibody was used in a (1:1000) dilution ratio; anti-flag antibody (M2) was used in a (1:10,000) dilution ratio; anti-NOD1 antibody was used in a (1:1000) dilution ratio; anti-rabbit HRP-conjugated secondary antibody was used in a (1:5000) dilution ratio; anti-NOD2 antibody was used in a (1:200) dilution ratio; anti-β-actin antibody was used in a (1:4000) dilution ratio; anti-mouse IgG secondary antibody was used in a (1:5000) dilution ratio; anti-Ub antibody was used in a (1:10,000) dilution ratio.
Immunoprecipitation HEK cells transfected with pcDNA3 full-length
RIP2 and NOD2 were harvested and lysed using passive 1x RIPA buffer (150 mM NaCl, 50 mM Tris, pH 8, 1 mM EDTA, 1% (v/v) Triton X-100, 0.1% (w/v) sodium dodecyl sulfate, and 0.5% (w/v) sodium deoxycholate). The whole-cell lysate was then incubated with anti-FLAG nanoparticles (Nvigen) at room temperature for 1 h. The beads were collected with magnets and washed three times with wash buffer (100 mM Tris-HCl, pH 8.0, 150 mM NaCl, and 1% Triton X-100). The proteins were eluted with 1.5 mg/mL 3X FLAG® Peptide (Sigma-Aldrich) containing wash buffer. Immunofluorescence 293T cells were seeded at ∼70% confluence on poly-L-lysine-coated coverslips. All cells were grown in complete media and allowed to adhere overnight. Coverslips were fixed with 3.7% paraformaldehyde in 1x PBS and permeablized with 0.5% Triton X-100 in 1x PBS. Coverslips were incubated with Alexa Fluor™ 647 Phalloidin (Invitrogen) diluted in PBS with 1% BSA for 30 min at room temperature. DAPI staining was then performed on the coverslips at room temperature for 5 min. Coverslips were mounted with VECTASHIELD HardSet Antifade Mounting Medium (Vector Laboratories). Cryo-electron microcopy For cryo-EM grid preparation, Quantifoil R2/2 holey carbon grid (Quantifoil) was glow-discharged and plunge-frozen using a Vitrobot (FEI) to be treated with 5-µl sample at a concentration of about 3 mg/ml. Final high-resolution images were collected at Tecnai Polara, 300 kV, using SerialEM 51 for data collection. Cs = 2.0 mm. Gatan K2 camera (Gatan), super-resolution mode for data collection, and binned 2× when doing motion correction. The sub-frame time is 200 ns and total exposure time is 7 s, this will give 35 frames per stack. The pixel size on the final image is 1.23 Å. The dose rate is 8 e/pixel/s. For cryo-EM data, super-resolution image stacks were gain normalized and binned by 2× to a pixel size of 1.23 Å prior to drift and local movement correction using MotionCorr2 52 . Date processing software Relion 2 was used for CTF determination, particle picking, 2D classification, 3D classification, and refinement procedures. Totally, 3100 micrographs were collected and analyzed. We manually picked out ~18,000 filaments and windowed out segments of 220 × 220 pixels, yielding 653,110 particles for 2D classification. After several iterations, bad particles were removed and we used 236,877 particles for 3D classification. Ab initio low-resolution helical structure was generated using a Gaussian cylinder as an initial model and good 2D class averages, which employed exhaustive searches for orientations of segments that are strictly constrained by the known helical symmetry. This reconstruction served as an initial reference model for 3D classification and auto-refinement in Relion. Finally, 142,230 particles were chosen to calculate our RIP2 filamentous model. All 3D refinements were carried out following the gold-standard procedure where the data set was divided into two half-sets. After refinement was converged, a mask was calculated and applied to the final data set and the corrected Fourier shell correlation (FSC) was calculated to estimate the resolution about 4.1 Å by using FSC = 0.143 criterion. In the final model, parameters of the RIP2 filament were calculated to yield a 4.936 Å of the axial rise per asymmetric unit and an azimuthal rotation per subunit of −101,373°. Model building Step 1 was the monomer docking. The RIP2–CARD monomer structure (PDB accession code: 2N7Z) was used at this stage. The residue numbers were renumbered and the terminal residues were deleted to match the length of the density. The individual helix was manually shifted (rigid body movement) according to the locations of three large aromatic side chains. These three residues (W439, Y474, and F501) are highlighted in Fig. 5b . The density map at this resolution enabled us to unambiguously locate these residues. This step was done in Coot. In Step 2, a tetramer containing the Type I, II, and III interfaces (a centrally located monomer and three other monomers forming Type I, II, and III interfaces with the central one) was built. After building four monomers in this way, we obtained a tetramer that could be used to refine the surface interactions. Phenix real space refinement was done without rigid body refinement. Different parameters were tested, a torsion-rotational angle NCS constraint (Phenix default auto setting) was used at this step. In this way, all surfaces of the central monomer could be refined. During Step 3, a tetramer model was built that is in agreement with the data from the cellular activity assays, given particular emphasis in charge-reversal experiments. In Step 4, a 12mer model was built. The central monomer from Step 3 was copy-and-pasted to occupy the entire 60 Å segment density. In the end, 12 identical monomers were added to the density. Phenix real space refinement with default NCS torsion-rotational constraint was performed. After several rounds of refinement, a model with reasonable statistics was obtained. Step 5: final refinement. The clash score was >16 after Step 4 and when inspecting this model in detail, some interactions were rebuilt and then Step 4 was repeated until satisfactory statistics and density interpretation were achieved.
Electronic supplementary material Supplementary Information Reporting Summary
Electronic supplementary material Supplementary Information accompanies this paper at 10.1038/s41467-018-07447-9.
📊 Figures
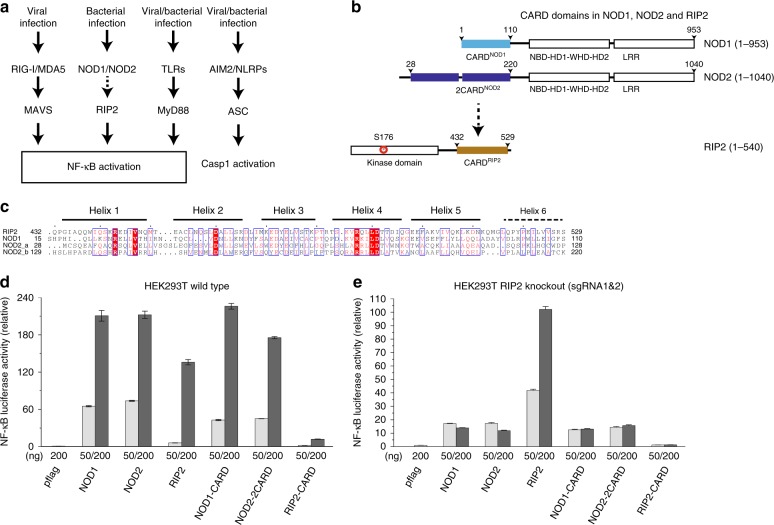
Fig. 1
CARD domains from NOD1/2 and RIP2 are important for signaling. a Schematic overview of canonical RLRu2013MAVS, NOD1/2u2013RIP2, TLRu2013MyD88, and ASC signaling pathways. Adapters with CARD/pyrin doma...
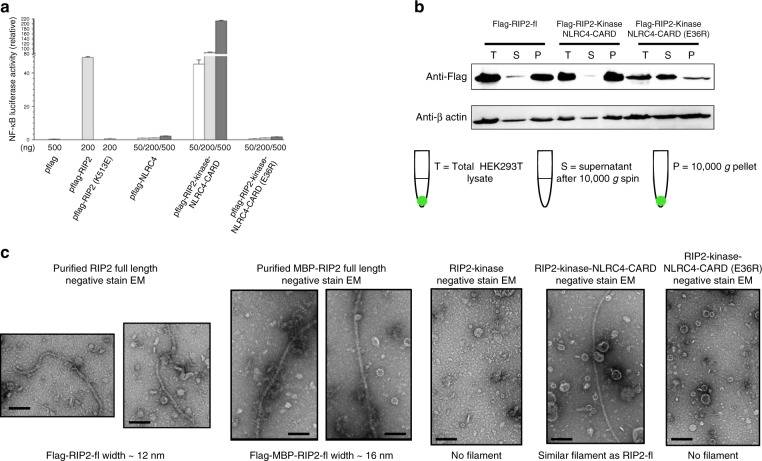
Fig. 2
RIP2 forms a filamentous structure upon activation. a NF-u03baB promotor activation by domain swap chimeric constructs of RIP2. HEK293T cells were transfected with empty pflag vector, wild-type RIP2, ...
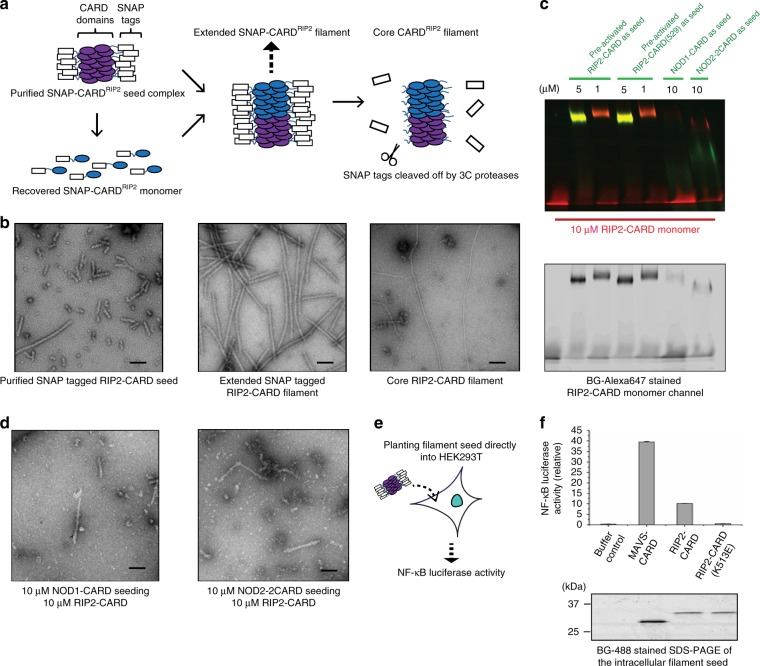
Fig. 3
Preparation of recombinant RIP2u2013CARD filament in its signaling active form. a Cartoon illustrations showing how recombinant RIP2u2013CARD filaments were prepared. The oligomeric seed fraction of S...
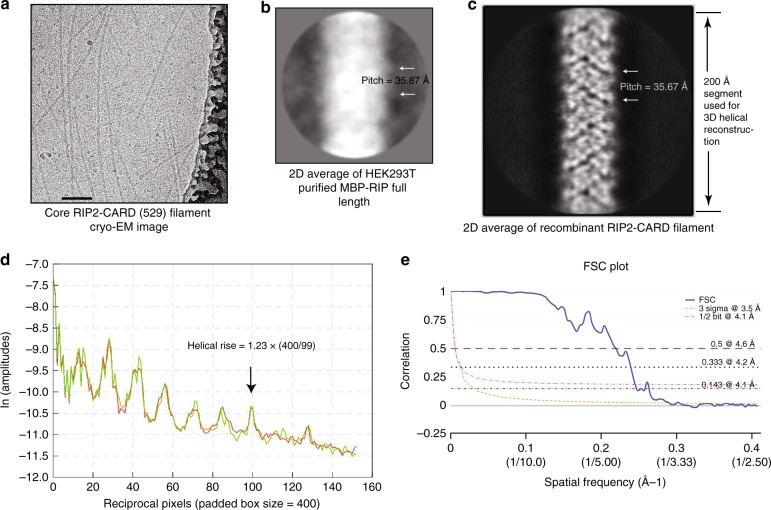
Fig. 4
Electron density of RIP2u2013CARD filament resolved using helical reconstruction. a Cryo-EM micrograph of core RIP2u2013CARDu2013EM construct. Scale bar: 100u2009nm. b Representative 2D class average ...
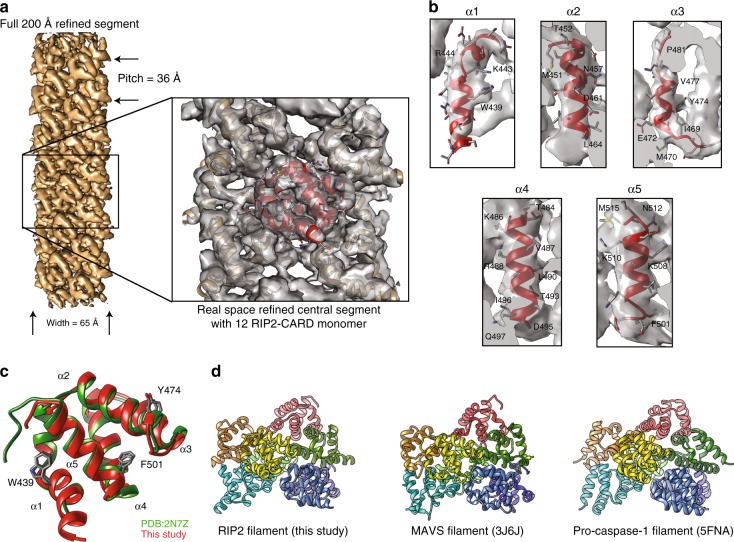
Fig. 5
A RIP2u2013CARD 12mer structure based on cryo-EM density. a Cartoon illustration of the average segment density of activated RIP2u2013CARD filamentous structure (EMDB code: 6482). The image was prepar...
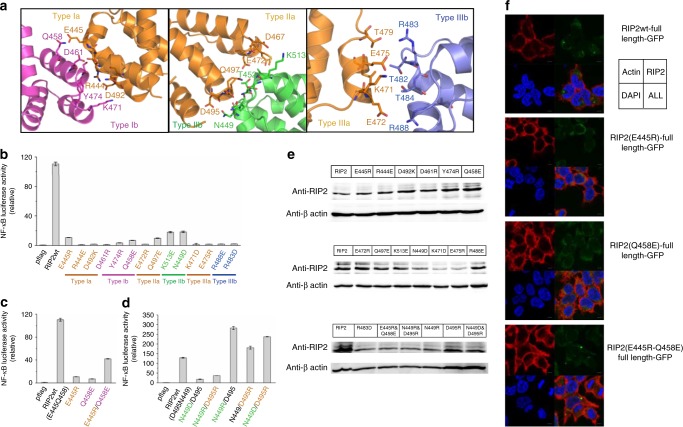
Fig. 6
Interdomain surface interactions within the RIP2u2013CARD filament. a Cartoons illustrated the details of Ia:Ib, IIa:IIb, and IIIa:IIIb interactions in RIP2u2013CARD filament. Residues at the interfac...
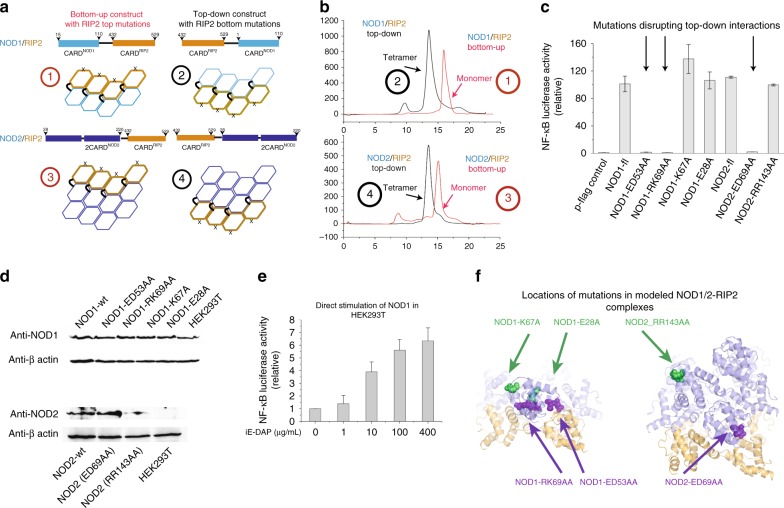
Fig. 7
Both NOD1 and 2 activate RIP2 in a top-down interaction mode. a The design of NOD1/RIP2 and NOD2/RIP2 fusion constructs. According to our structural model, we introduced mutations located on RIP2u2013...
Figure images are served from the NIH/NLM PubMed Central Open Access Subset or Europe PMC; copyright remains with the publishers and authors.
💬 Discussion
0 commentsNo comments yet. Be the first to start a discussion!
Leave a Comment