Abstract
A key step in ribosome biogenesis is the nuclear export of pre-ribosomal particles. Nmd3, a highly conserved protein in eukaryotes, is a specific adaptor required for the export of pre-60S particles. Here we used cryo-electron microscopy (cryo-EM) to characterize Saccharomyces cerevisiae pre-60S particles purified with epitope-tagged Nmd3. Our structural analysis indicates that these particles belong to a specific late stage of cytoplasmic pre-60S maturation in which ribosomal proteins uL16, uL10, uL11, eL40 and eL41 are deficient, but ribosome assembly factors Nmd3, Lsg1, Tif6 and Reh1 are present. Nmd3 and Lsg1 are located near the peptidyl-transferase center (PTC). In particular, Nmd3 recognizes the PTC in its near-mature conformation. In contrast, Reh1 is anchored to the exit of the polypeptide tunnel, with its C terminus inserted into the tunnel. These findings pinpoint a structural checkpoint role for Nmd3 in PTC assembly, and provide information about functional and mechanistic roles of these assembly factors in the maturation of the 60S ribosomal subunit.
🔬 Techniques
🔭 Microscopes
🧬 Organisms
✨ Fluorophores
🏭 Microscope Brands
🧪 Reagent Suppliers
💻 Software Details
💾 Data Repositories
🏛️ Research Organizations (ROR)
Affiliated research institutions:
📋 Methods
Methods, including statements of data availability and any associated accession codes and references, are available in the online version of the paper .
ONLINE METHODS
Purification of pre-60S Nmd3 particles
Pre-60S particles were purified by tandem affinity purification 61 . The C-terminally tagged Nmd3-TAP strain SC1121 (SC0000; MATa , ura3-52 , leu2-3 , 112 , YHR170w::TAP-KlURA3) was obtained from EUROSCARF ( http://www.euroscarf.de ). Cells were cultured in 3 L of YEPD medium at 30 °C to an OD 600 of 1.0, collected by centrifugation and washed with lysis buffer (50 mM Tris-HCl, pH 7.5, 100 mM NaCl, 10 mM MgCl 2 , 0.075% (v/v) NP-40). Resuspended cells were disrupted ten times with glass beads in lysis buffer containing complete protease inhibitor cocktail (1 pill per 50 ml; Roche). Cell lysates were centrifuged at 13,000 r.p.m. for 1 h at 4 °C with a JA 25.50 motor (Beckman Coulter). Supernatants were collected and applied to a column containing IgG Sepharose beads (GE Healthcare) and incubated for 2 h at 4 °C. The beads were then washed several times with lysis buffer, and proteins were eluted via the addition of 1 ml of TEV cleavage buffer (50 mM Tris-HCl, pH 7.5, 100 mM NaCl, 10 mM MgCl 2 ) containing the TEV protease. The cleavage reaction continued for 2 h at 16 °C. The elution was collected and concentrated. The composition of the pre-60S particles was analyzed by mass spectrometry ( Supplementary Table 1 ).
Cryo-EM specimen preparation
The pre-60S sample was diluted to a concentration of ~100 nM. Prior to sample freezing, holey carbon grids (Quantifoil R2/2) were coated with a thin layer of freshly prepared carbon and glow-discharged with a plasma cleaner. Cryo-grids were prepared with an FEI Vitrobot Mark IV at 4 °C and 100% humidity, and inspected with a 300-kV FEI Titan Krios transmission electron microscope (FEI Falcon II direct electron detector). Micrographs were collected at a magnification of 75,000×, which rendered a pixel size of 1.08 Å at the object scale, and with the defocus ranging from −1.5 to −2.5 µm. Data collection was done under low-dose conditions by the semiautomatic software AutoEMation II (written by J.L.). For each micrograph stack, 20 frames were collected, with a total dose of 40 electrons per pixel.
Show full methods section
Methods, including statements of data availability and any associated accession codes and references, are available in the online version of the paper .
ONLINE METHODS
Purification of pre-60S Nmd3 particles
Pre-60S particles were purified by tandem affinity purification 61 . The C-terminally tagged Nmd3-TAP strain SC1121 (SC0000; MATa , ura3-52 , leu2-3 , 112 , YHR170w::TAP-KlURA3) was obtained from EUROSCARF ( http://www.euroscarf.de ). Cells were cultured in 3 L of YEPD medium at 30 °C to an OD 600 of 1.0, collected by centrifugation and washed with lysis buffer (50 mM Tris-HCl, pH 7.5, 100 mM NaCl, 10 mM MgCl 2 , 0.075% (v/v) NP-40). Resuspended cells were disrupted ten times with glass beads in lysis buffer containing complete protease inhibitor cocktail (1 pill per 50 ml; Roche). Cell lysates were centrifuged at 13,000 r.p.m. for 1 h at 4 °C with a JA 25.50 motor (Beckman Coulter). Supernatants were collected and applied to a column containing IgG Sepharose beads (GE Healthcare) and incubated for 2 h at 4 °C. The beads were then washed several times with lysis buffer, and proteins were eluted via the addition of 1 ml of TEV cleavage buffer (50 mM Tris-HCl, pH 7.5, 100 mM NaCl, 10 mM MgCl 2 ) containing the TEV protease. The cleavage reaction continued for 2 h at 16 °C. The elution was collected and concentrated. The composition of the pre-60S particles was analyzed by mass spectrometry ( Supplementary Table 1 ).
Cryo-EM specimen preparation
The pre-60S sample was diluted to a concentration of ~100 nM. Prior to sample freezing, holey carbon grids (Quantifoil R2/2) were coated with a thin layer of freshly prepared carbon and glow-discharged with a plasma cleaner. Cryo-grids were prepared with an FEI Vitrobot Mark IV at 4 °C and 100% humidity, and inspected with a 300-kV FEI Titan Krios transmission electron microscope (FEI Falcon II direct electron detector). Micrographs were collected at a magnification of 75,000×, which rendered a pixel size of 1.08 Å at the object scale, and with the defocus ranging from −1.5 to −2.5 µm. Data collection was done under low-dose conditions by the semiautomatic software AutoEMation II (written by J.L.). For each micrograph stack, 20 frames were collected, with a total dose of 40 electrons per pixel.
Image processing
Motion correction at the micrograph level was done with MotionCorr ( http://cryoem.ucsf.edu/software/driftcorr.html ). Micrograph selection, automatic particle picking and normalization were done with SPIDER 62 . The contrast transfer function parameter was estimated with the CTFFIND3 program 63 in the RELION package 64 . Further image processing, including 2D and 3D classification, refinement and post-processing, was done with RELION 1.3. A total of 2,285 micrographs were collected and 278,881 particles were picked for cascade 2D and 3D classification with a binning factor of two. About 50% of particles were removed during two rounds of 2D classification, and 127,787 particles were subjected to three rounds of 3D classification ( Supplementary Fig. 2 ). After the final round of 3D classification, a total of 84,240 particles were applied for high-resolution refinement (without binning). Final refinement was done with a dose-reduced data set, using only a total dose of 20 electrons per pixel. During the final refinement, a soft-edged mask was applied from the 1.8° step, resulting in a 3.4-Å map (gold-standard FSC 0.143 criteria). After refinement, the map was sharpened using the post-processing options of RELION with a soft mask and B factor of −30 Å 2 applied, which resulted in an overall resolution of 3.07 Å. The local resolution was estimated using ResMap 65 in RELION. To improve the local density of Lsg1, we further classified the final data set (84,240 particles) using a signal-subtraction method 28 . Specifically, we first created an artificial ‘Lsg1-free’ pre-60S map using the refined density map of the Nmd3 particles by masking out the Lsg1 density from the final map. Then, we prepared a data set of modified particles by subtracting the 2D projections of the Lsg1-free pre-60S structure from the respective raw Nmd3 particles. These modified particles, which supposedly should be dominated by density from Lsg1, were subjected to further rounds of 3D classification (with a large soft mask of Lsg1 and also with local search restrictions applied). Nevertheless, the final structure from a subset of the original particles (around 40,000 particles) only marginally improved the density appearance of Lsg1 ( Supplementary Fig. 4a ), with the consequence of decreased overall resolution (3.7 Å).
Atomic model building and refinement
The amino acid sequence of Nmd3 (UniProt P38861 ) was subjected to secondary-structure prediction using PSIPRED 66 . We first built a polyalanine model using Coot 67 and then performed sequence assignment using the information from predicted secondary structures and side chain densities in the map. For model building of the pre-60S subunit, the 3.0-Å crystal structure of the yeast ribosome (PDB 3U5D and PDB 3U5E ) 27 was fitted into the density map using Chimera 68 . For the rRNAs, the structure of the 5.8S, 5S and 25S rRNAs (PDB 3U5D ) were adjusted manually with Coot. Modeling of the L1 stalk was also facilitated by the coordinates of L1-stalk RNA (G2440–U2509) from a crystallography study 69 (PDB 3O5H ). For ribosomal proteins, the crystal structures were first fitted as rigid bodies and optimized with Coot. The coordinate of protein uL1 was taken from a previous cryo-EM study 36 (PDB 4V91 ). The atomic-model refinement was done via real-space refinement (phenix.real_space_refine) 70 in Phenix 71 and also by Fourier space refinement in REFMAC 72 . The atomic model was cross-validated according to previously described procedures 73 , and model statistics are summarized in Table 1 . In the final model, we were able to build residues 155–402 for Nmd3, residues 377–432 for Reh1, and residues 1–227 for Tif6. Notably, a few flexible components of the 25S rRNA, including H38 (1,000–1,050) and the L1 stalk (2,443–2,506), were removed from the final model because they were highly fragmented in the final sharpened map. Structural analysis and figure preparation were done with PyMOL 74 and UCSF Chimera.
Supplementary Material supplement
📊 Figures
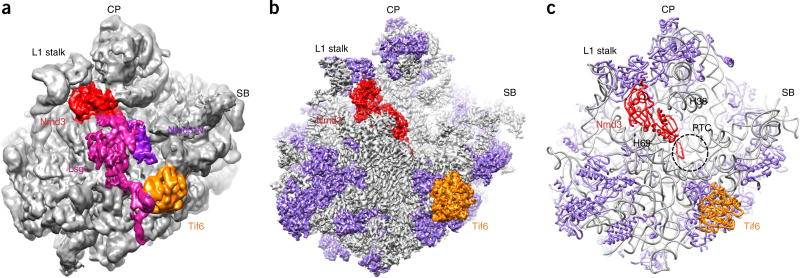
Figure 1
The structure of the pre-60S Nmd3-TAP ribosomal particle. ( a , b ) Low-pass-filtered ( a ) and B -factor-sharpened ( b ) cryo-EM density maps of the pre-60S particle, shown as surface representations...
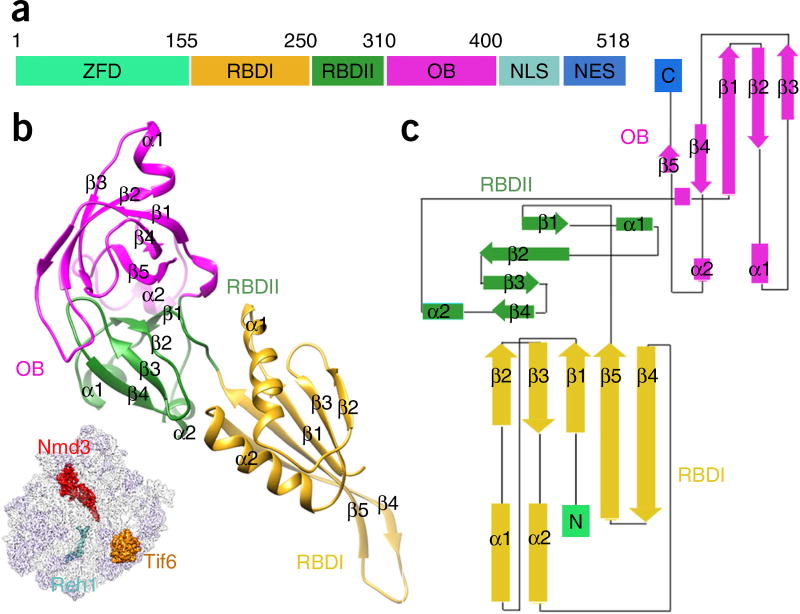
Figure 2
The structure of Nmd3. ( a ) Schematic illustration of Nmd3 domain organization. ZFD, zinc-finger-containing domain; NLS, nuclear localization sequence; NES, nuclear export signal. ( b ) The atomic mo...
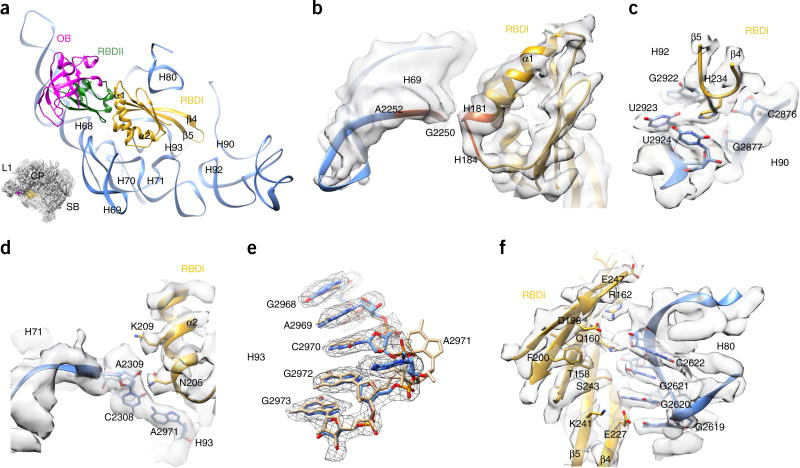
Figure 3
Interaction of Nmd3 RBDI with 25S rRNA. ( a ) Binding position of Nmd3 on the pre-60S particle. Different Nmd3 domains are indicated by color-coding. The orientation is represented in the illustration...
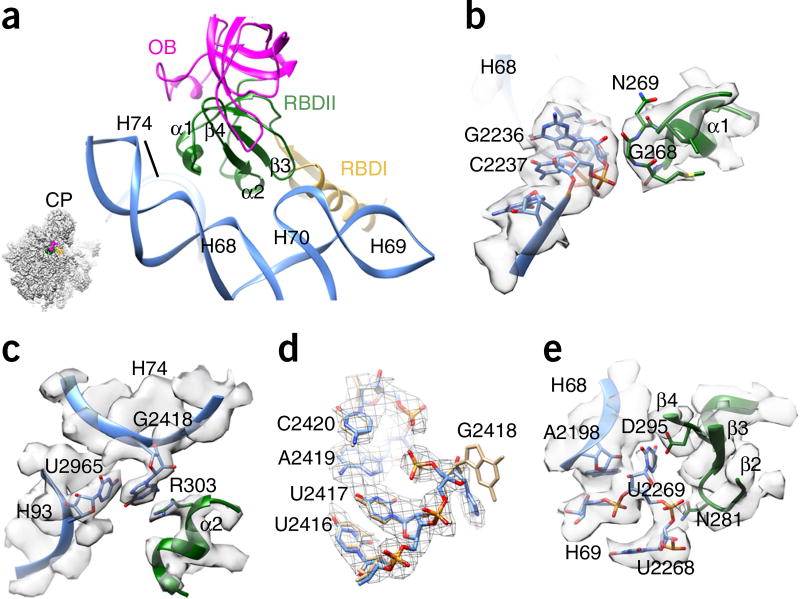
Figure 4
Interaction of Nmd3 RBDII with 25S rRNA. ( a ) Overview of the interaction between RBDII and 25S rRNA. The orientation is represented in the illustration on the lower left. ( b ) The u03b11 helix of R...
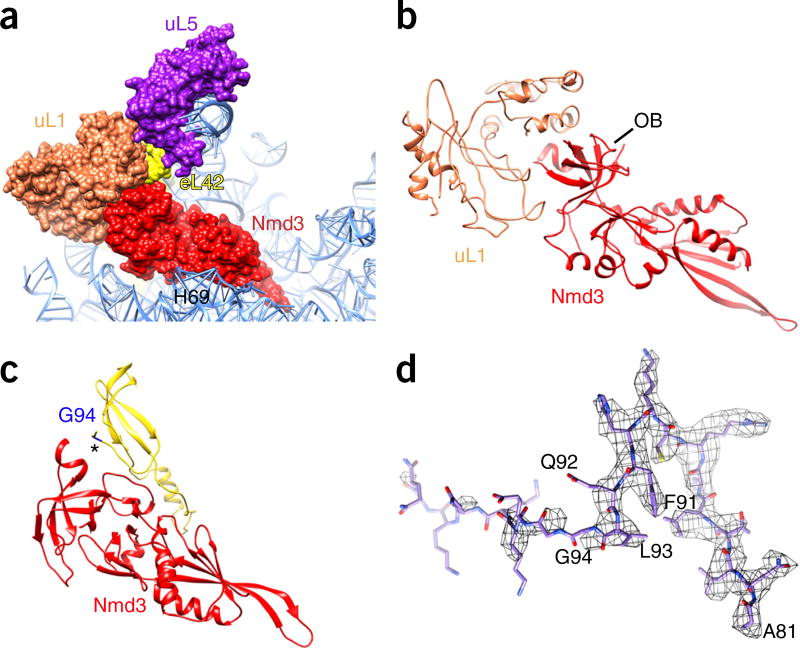
Figure 5
Interaction of the Nmd3 OB with uL1 and eL42. ( a ) Overall orientation of Nmd3 relative to ribosomal proteins uL1 and eL42. ( b ) Schematic of the extensive interaction between uL1 and the Nmd3 OB, h...
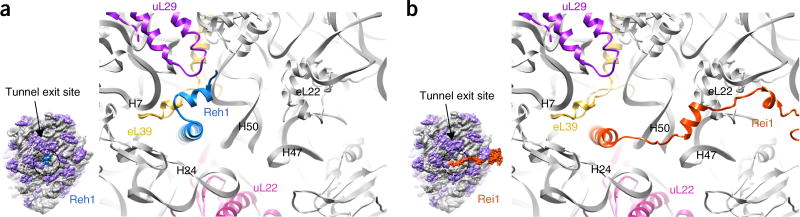
Figure 6
The C terminus of Reh1 inserts into the PET. ( a ) The atomic model of the Nmd3 particle viewed from the tunnel exit. The orientation of Reh1 is shown in the illustration on the left (surface represen...
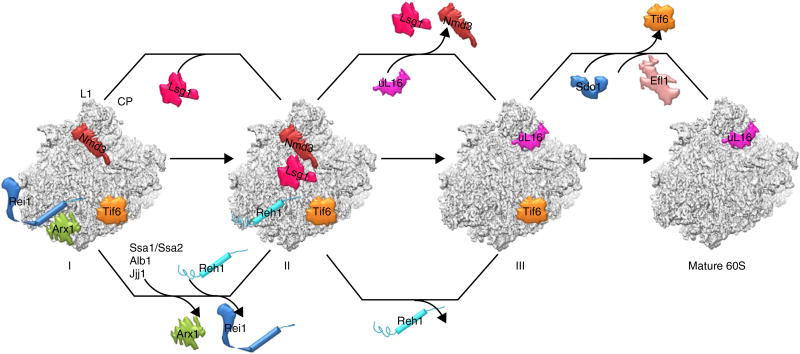
Figure 7
The model for the final cytoplasmic stages of pre-60S maturation. The map features two parallel pathways for the maturation of two functional centers of the 60S subunit, the PTC-CP region and the tunn...
Figure images are served from the NIH/NLM PubMed Central Open Access Subset or Europe PMC; copyright remains with the publishers and authors.
💬 Discussion
0 commentsNo comments yet. Be the first to start a discussion!
Leave a Comment