Abstract
The human replisome is an elaborate arrangement of molecular machines responsible for accurate chromosome replication. At its heart is the CDC45-MCM-GINS (CMG) helicase, which, in addition to unwinding the parental DNA duplex, arranges many proteins including the leading-strand polymerase Pol ε, together with TIMELESS-TIPIN, CLASPIN and AND-1 that have key and varied roles in maintaining smooth replisome progression. How these proteins are coordinated in the human replisome is poorly understood. We have determined a 3.2 Å cryo-EM structure of a human replisome comprising CMG, Pol ε, TIMELESS-TIPIN, CLASPIN and AND-1 bound to replication fork DNA. The structure permits a detailed understanding of how AND-1, TIMELESS-TIPIN and Pol ε engage CMG, reveals how CLASPIN binds to multiple replisome components and identifies the position of the Pol ε catalytic domain. Furthermore, the intricate network of contacts contributed by MCM subunits and TIMELESS-TIPIN with replication fork DNA suggests a mechanism for strand separation.
🔬 Techniques
🔭 Microscopes
🧬 Organisms
💻 Software
✨ Fluorophores
🧪 Sample Preparation
🔬 Cell Lines
🏭 Microscope Brands
🧪 Reagent Suppliers
📷 Detectors
💻 Software Details
💾 Data Repositories
🏛️ Research Organizations (ROR)
Affiliated research institutions:
📋 Methods
Expression plasmid construction cDNAs encoding all subunits of hsCMG (MCM2, MCM3, MCM4, MCM5, MCM6, MCM7, PSF1, PSF2, PSF3, SLD5, CDC45), Pol ε (POLE1, POLE2, POLE3, POLE4), RFC1, RFC2, RFC3, RFC4, RFC5 TIMELESS‐TIPIN, AND‐1 and CLASPIN were codon‐optimised for overexpression in insect cells; PCNA was codon‐optimised for overexpression in E . coli and synthesised by GeneArt Gene Synthesis (ThermoFisher) (see Appendix Table S1 for isoform identifiers). CDC45 was encoded with an internal flag tag, whereas SLD5 and RFC1 contained an N‐terminal twin strep tag. For AND‐1 and CLASPIN, N‐ and C‐terminal 3X Flag tag were used, respectively. For TIMELESS‐TIPIN, TIMELESS was encoded with an N‐terminal twin strep tag along with TEV cleavage site (see Appendix Table S2 for affinity tag sequences). The codon‐optimised sequences were then cloned into a pACEBac1 vector separately. For expression of hsCMG, individual genes were amplified by PCR and expression cassettes encoding MCM2‐7 and GINS (PSF1, PSF2, PSF3 and SLD5) were generated in pBIG2ab and pBIG1a vectors, respectively, using a modified version of the BiGBac system (Weissmann et al , 2016 ). Similar to hsCMG, individual genes encoding Pol ε subunits were amplified and cloned into pBIG1a. For RFC, TIMELESS‐TIPIN, CLASPIN, and AND‐1, PaCEBac1 constructs were used in subsequent virus generation. See Appendix Table S3 for details of expression plasmids used.
Protein expression
To prepare baculoviruses, vector constructs for each individual protein and complexes were transformed into EMBacY E. coli competent cells for bacmid generation. Isolated bacmid was then transfected into Sf9 cells using FuGENE® HD (Promega). These baculoviruses were then amplified before a large‐scale culture was infected. For expression of hsCMG, separate viruses expressing MCM2‐7, GINS and CDC45 were used to co‐infect 3 l of Hi5 cells at a density of 1 × 10 6 cells/ml. Individual viruses expressing the four subunit Pol ε and RFC were used to infect 2 l of Hi5 cells. For CLASPIN, TIMELESS‐TIPIN and AND‐1, 1 l of Hi5 cells was infected with the viruses. Cell growth and viability were monitored and cells harvested upon growth arrest (normally on day 3 after infection). hsCMG purification Cells from a 3‐l culture were resuspended in lysis buffer (40 mM Hepes‐NaOH pH 7.5, 10% glycerol, 0.005% Tween‐20, 0.5 mM TCEP, 150 mM NaOAc) + protease inhibitors (cOmplete, EDTA‐ free (Roche), one tablet per 50 ml buffer). Cells were lysed by dounce homogenisation and insoluble material was removed by ultracentrifugation (235,000 g , 4°C, 45 min). Flag M2 affinity gel (Sigma) (5 ml) was added to the lysate and incubated for 2 h at 4°C. Resin was collected in 20‐ml columns (Bio‐Rad) (2 ml bed volume per column) and washed with 100 ml lysis buffer per column. Proteins were eluted with 1 CV (column volume) buffer + 0.5 mg/ml 3× FLAG peptide (Sigma) and 2 CV buffer + 0.2 mg/ml 3× FLAG peptide. Elutions were pooled, 0.5 ml strep‐tactin XT superflow high capacity (iba) was added, and the sample was incubated for 40 min at 4°C. Resin was collected in 20‐ml column and washed with 10 CV buffer. Resin was further washed with 10 CV lysis buffer + 5 mM Mg(OAc) 2 + 0.5 mM ATP followed by 30 CV wash without ATP and Mg(OAc) 2 . Proteins were eluted with 14 CV (0.5 ml each fraction) lysis buffer + 30 mM biotin. Fractions were pooled and applied to a MonoQ PC 1.6/5 (GE Healthcare) equilibrated in 25 mM Tris–HCl pH 7.2,10% glycerol, 0.005% Tween‐20, 0.5 mM TCEP, 150 mM KCl. CMG was eluted with a 30 CV gradient from 150 to 1,000 mM KCl, and peak fractions were dialysed overnight against 500 ml dialysis buffer (40 mM HEPES‐KOH pH 7.6, 80 mM KOAc, 2 mM Mg(OAc) 2 , 0.25 mM EDTA, 1 mM DTT, 10% glycerol). Protein was concentrated (Amicon Ultra, Ultracel ‐ 30K), frozen in liquid nitrogen and stored at −80°C.
Show full methods section
Expression plasmid construction cDNAs encoding all subunits of hsCMG (MCM2, MCM3, MCM4, MCM5, MCM6, MCM7, PSF1, PSF2, PSF3, SLD5, CDC45), Pol ε (POLE1, POLE2, POLE3, POLE4), RFC1, RFC2, RFC3, RFC4, RFC5 TIMELESS‐TIPIN, AND‐1 and CLASPIN were codon‐optimised for overexpression in insect cells; PCNA was codon‐optimised for overexpression in E . coli and synthesised by GeneArt Gene Synthesis (ThermoFisher) (see Appendix Table S1 for isoform identifiers). CDC45 was encoded with an internal flag tag, whereas SLD5 and RFC1 contained an N‐terminal twin strep tag. For AND‐1 and CLASPIN, N‐ and C‐terminal 3X Flag tag were used, respectively. For TIMELESS‐TIPIN, TIMELESS was encoded with an N‐terminal twin strep tag along with TEV cleavage site (see Appendix Table S2 for affinity tag sequences). The codon‐optimised sequences were then cloned into a pACEBac1 vector separately. For expression of hsCMG, individual genes were amplified by PCR and expression cassettes encoding MCM2‐7 and GINS (PSF1, PSF2, PSF3 and SLD5) were generated in pBIG2ab and pBIG1a vectors, respectively, using a modified version of the BiGBac system (Weissmann et al , 2016 ). Similar to hsCMG, individual genes encoding Pol ε subunits were amplified and cloned into pBIG1a. For RFC, TIMELESS‐TIPIN, CLASPIN, and AND‐1, PaCEBac1 constructs were used in subsequent virus generation. See Appendix Table S3 for details of expression plasmids used.
Protein expression
To prepare baculoviruses, vector constructs for each individual protein and complexes were transformed into EMBacY E. coli competent cells for bacmid generation. Isolated bacmid was then transfected into Sf9 cells using FuGENE® HD (Promega). These baculoviruses were then amplified before a large‐scale culture was infected. For expression of hsCMG, separate viruses expressing MCM2‐7, GINS and CDC45 were used to co‐infect 3 l of Hi5 cells at a density of 1 × 10 6 cells/ml. Individual viruses expressing the four subunit Pol ε and RFC were used to infect 2 l of Hi5 cells. For CLASPIN, TIMELESS‐TIPIN and AND‐1, 1 l of Hi5 cells was infected with the viruses. Cell growth and viability were monitored and cells harvested upon growth arrest (normally on day 3 after infection). hsCMG purification Cells from a 3‐l culture were resuspended in lysis buffer (40 mM Hepes‐NaOH pH 7.5, 10% glycerol, 0.005% Tween‐20, 0.5 mM TCEP, 150 mM NaOAc) + protease inhibitors (cOmplete, EDTA‐ free (Roche), one tablet per 50 ml buffer). Cells were lysed by dounce homogenisation and insoluble material was removed by ultracentrifugation (235,000 g , 4°C, 45 min). Flag M2 affinity gel (Sigma) (5 ml) was added to the lysate and incubated for 2 h at 4°C. Resin was collected in 20‐ml columns (Bio‐Rad) (2 ml bed volume per column) and washed with 100 ml lysis buffer per column. Proteins were eluted with 1 CV (column volume) buffer + 0.5 mg/ml 3× FLAG peptide (Sigma) and 2 CV buffer + 0.2 mg/ml 3× FLAG peptide. Elutions were pooled, 0.5 ml strep‐tactin XT superflow high capacity (iba) was added, and the sample was incubated for 40 min at 4°C. Resin was collected in 20‐ml column and washed with 10 CV buffer. Resin was further washed with 10 CV lysis buffer + 5 mM Mg(OAc) 2 + 0.5 mM ATP followed by 30 CV wash without ATP and Mg(OAc) 2 . Proteins were eluted with 14 CV (0.5 ml each fraction) lysis buffer + 30 mM biotin. Fractions were pooled and applied to a MonoQ PC 1.6/5 (GE Healthcare) equilibrated in 25 mM Tris–HCl pH 7.2,10% glycerol, 0.005% Tween‐20, 0.5 mM TCEP, 150 mM KCl. CMG was eluted with a 30 CV gradient from 150 to 1,000 mM KCl, and peak fractions were dialysed overnight against 500 ml dialysis buffer (40 mM HEPES‐KOH pH 7.6, 80 mM KOAc, 2 mM Mg(OAc) 2 , 0.25 mM EDTA, 1 mM DTT, 10% glycerol). Protein was concentrated (Amicon Ultra, Ultracel ‐ 30K), frozen in liquid nitrogen and stored at −80°C.
CLASPIN purification
Cells from a 1‐l culture were resuspended in lysis buffer (50 mM Tris–HCl pH 8, 10% glycerol, 0.005% Tween‐20, 0.5 mM TCEP, 400 mM NaCl) + protease inhibitors (cOmplete, EDTA‐free, one tablet per 50 ml buffer). Cells were lysed by dounce homogenisation, and insoluble material was removed by centrifugation (235,000 g , 4°C, 45 min). Flag M2 affinity gel (1 ml) was added and the lysate incubated for 2 h at 4°C. Resin was collected in 20‐ml column (2 ml bed volume) and was washed with 30 ml lysis buffer. Resin was further washed with 10 CV lysis buffer + 5 mM Mg(OAc) 2 + 0.5 mM ATP, followed by 10 CV wash without ATP and Mg(OAc) 2 . CLASPIN was eluted in 1 CV lysis buffer + 0.4 mg/ml 3× FLAG peptide and 2 CV lysis buffer + 0.2 mg/ml 3× FLAG peptide. Eluates were pooled and 0.4 ml was applied to a Superose 6 10/300 (GE Healthcare) column equilibrated in 25 mM Tris–HCl pH 7.2, 10% glycerol, 0.005% Tween‐20, 0.5 mM TCEP, 150 mM NaCl. Peak fractions were pooled, frozen in liquid nitrogen and stored at −80°C.
TIMELESS‐TIPIN purification
Cell pellet from a 1‐l culture was resuspended in lysis buffer (25 mM Hepes‐KOH pH 7.2, 150 mM KCl, 5% glycerol, 0.5 mM TCEP, 0.01% NP‐40‐S) + protease inhibitors (cOmplete, EDTA‐free, one tablet per 50 ml buffer). Cells were lysed by Dounce homogenisation, and insoluble material was removed by centrifugation (235,000 g , 4°C, 45 min). 0.5 ml Strep‐Tactin XT superflow high capacity was added to the lysate and incubated for 30 min at 4°C. Resin was collected in 20‐ml column (2 ml bed volume) and was washed 50 ml lysis buffer. Protein was eluted with 10 CV (0.5 ml each fraction) lysis buffer + 30 mM biotin. Fractions were pooled and applied to 1 ml HiTrap Q HP column (GE Healthcare) equilibrated in 25 mM Hepes‐KOH pH 7.2, 150 mM KCl, 5% glycerol, 0.5 mM TCEP, 0.01% NP‐40‐S. TIMELESS‐TIPIN was eluted with a 20 CV gradient from 150 to 1,000 mM KCl. Peak fractions were pooled, concentrated to ˜500 μl in an Amicon Ultra‐15 30 kDa MWCO concentrator and applied to a Superdex 200 Increase 10/300 gel filtration column (GE Healthcare) equilibrated in 25 mM Tris–HCl pH 7.2, 5% glycerol, 0.01% NP‐40‐S, 1 mM DTT, 150 mM NaCl. Peak fractions were pooled, frozen in liquid nitrogen and stored at −80°C.
AND‐1 purification
Cell pellet obtained from 1 l of insect culture was resuspended in lysis buffer (25 mM Tris–HCl pH 7.2, 10% glycerol, 0.005% Tween‐20, 0.5 mM TCEP, 300 mM NaCl) + protease inhibitors (cOmplete, EDTA‐free, one tablet per 50 ml buffer). Cells were lysed by Dounce homogenisation, and insoluble material was removed by centrifugation (235,000 g , 4°C, 45 min). Flag M2 affinity gel (1 ml) was added to the lysate and incubated for 2 h at 4°C. Resin was collected in 20‐mL column (2 ml bed volume) and was washed with 30 ml lysis buffer. Resin was further washed with 10 CV lysis buffer + 5 mM Mg(OAc) 2 + 0.5 mM ATP, followed by 10 CV wash without ATP and Mg(OAc) 2 . AND‐1 was eluted in 1 CV lysis buffer + 0.4 mg/ml 3× FLAG peptide and 2 CV buffer + 0.2 mg/ml 3× FLAG peptide. Eluates were pooled and applied to 1 mL MonoQ column equilibrated in 25 mM Tris–HCl pH 7.2, 10% glycerol, 0.005% Tween‐20, 0.5 mM TCEP, 150 mM NaCl). AND‐1 was eluted with a 20 CV gradient from 150 to 1,000 mM NaCl. Peak fractions were pooled, concentrated to ˜500 μl in an Amicon Ultra‐15 30 kDa MWCO concentrator and applied to a Superdex 200 Increase 10/300 gel filtration column equilibrated in 5 mM Tris–HCl pH 7.2, 10% glycerol, 0.005% Tween‐20, 0.5 mM TCEP, 150 mM NaCl. Peak fractions were pooled, frozen in liquid nitrogen and stored at −80°C.
Pol ε purification
Cell pellet obtained from 2 l of insect cell culture was resuspended in lysis buffer (45 mM Hepes‐KOH pH 7.6, 100 mM NaCl, 10% glycerol, 0.5 mM TCEP, 0.02% NP‐40‐S) + protease inhibitors (cOmplete, EDTA‐free, one tablet per 50 ml buffer). Cells were lysed by dounce homogenisation, and insoluble material was removed by centrifugation (235,000 g , 4°C, 45 min). CaCl 2 was added (2 mM) to the supernatant together with 2 ml Calmodulin Affinity Resin and incubated for 90 min at 4°C. Unbound protein was applied to 1 ml HiTrap Heparin column (GE Healthcare) equilibrated in 45 mM Hepes‐KOH pH 7.6, 100 mM NaCl, 10% glycerol, 0.5 mM TCEP, 0.02% NP‐40‐S. The protein was eluted with a 30CV gradient from 100 to 1,000 mM NaCl. Peak fractions were pooled and incubated with 1 ml Calmodulin Affinity Resin + 2 mM CaCl 2 for 1 h. After incubation, resin was collected and washed with 50 ml lysis buffer + 2 mM CaCl 2 and bound proteins were eluted with 10 CV (1 ml each fraction) lysis buffer + 2 mM EDTA + 2 mM EGTA. Fractions were pooled and applied to MonoQ PC 1.6/5 (GE Healthcare) column equilibrated in lysis buffer. The protein was eluted with a 30CV gradient from 100 to 600 mM NaCl. Peak fractions were pooled and dialysed overnight against 1 l dialysis buffer (25 mM HEPES‐KOH pH 7.6, 10% glycerol, 1 mM DTT, 0.005% Tween, 10% glycerol, 300 mM KOAc). Protein was concentrated with Amicon Ultra‐15 30 kDa MWCO concentrator, frozen in liquid nitrogen and kept at −80°C.
RFC purification
Cell pellet obtained from 2 l of insect cell culture was resuspended in lysis buffer (25 mM Hepes‐KOH pH 7.6, 300 mM NaCl, 10% glycerol, 0.5 mM TCEP, 0.02% NP‐40‐S) + protease inhibitors (cOmplete, EDTA‐free, one tablet per 50 ml buffer). Cells were lysed by dounce homogenisation, and insoluble material was removed by centrifugation (235,000 g , 4°C, 45 min). 1 ml Strep‐Tactin XT superflow high capacity resin was added to the lysate and incubated for 30 min at 4°C. Resin was collected in 20‐ml column (2 ml bed volume) and was washed with 100 ml lysis buffer. Protein was eluted with 10 CV (1 ml each fraction) lysis buffer + 30 mM biotin. Fractions were pooled and applied to 1 ml HiTrap Heparin column (GE Healthcare) equilibrated in 25 mM Hepes‐KOH pH 7.6, 100 mM NaCl, 10% glycerol, 0.5 mM TCEP, 0.01% NP‐40‐S. The protein was eluted with a 30 CV gradient from 100 to 1,000 mM NaCl. Peak fractions were pooled and the conductivity of the sample was adjusted to a buffer containing 25 mM Hepes‐KOH pH 7.6, 100 mM NaCl, 10% glycerol, 0.5 mM TCEP, 0.01% NP‐40‐S. The sample was applied to 1 ml MonoQ column equilibrated in 25 mM Hepes‐KOH pH 7.6, 100 mM NaCl, 10% glycerol, 0.5 mM TCEP, 0.01% NP‐40‐S. Protein was eluted with a 20 CV gradient from 150 to 1,000 mM NaCl. Peak fractions were pooled and dialysed overnight against 1 l dialysis buffer (25 mM HEPES‐KOH pH 7.6, 10% glycerol, 1 mM DTT, 0.005% Tween, 10% glycerol, 300 mM KOAc). Protein was concentrated with Amicon Ultra‐15 30 kDa MWCO concentrator, frozen in liquid nitrogen and kept at −80°C. PCNA purification Bl21 (DE3) Rosetta, transformed with pET28a PCNA (1 l culture), were grown at 37°C in LB + 50 μg/ml kanamycin + 10 μg/ml chloramphenicol to an OD 600 of 0.6. Expression was induced by addition of 0.8 mM IPTG, and the culture was grown further for 3 h. Cells were harvested and the pellet was resuspended in 50 mM Tris–HCl pH 7.2, 10% w/v sucrose + protease inhibitors (cOmplete, EDTA‐free, one tablet per 50 ml buffer). Cells were lysed via sonication (30%, 5s on/5s off, total 2 min), and insoluble material was removed by centrifugation (235,000 g , 4°C, 20 min). Ammonium sulphate was added slowly to 150 mM, and then, polymin P was added to 0.4%. The sample was stirred for 10 min at 4°C and insoluble material was removed by centrifugation (27,000 g 4°C, 10 min). 0.23 g/ml solid ammonium sulphate was added slowly to the supernatant; the sample was stirred for 10 min and centrifuged (48,000 g , 4°C, 10 min). The pellet was resuspended in 3 ml 25 mM Tris–HCl pH 7.2, 10% glycerol, 1 mM EDTA and 100 mM NaCl and the sample dialysed against the same buffer for 2 h. The conductivity was adjusted to a buffer containing 25 mM Tris−HCl pH 7.2, 10% glycerol, 1 mM EDTA and 150 mM NaCl. The sample was applied to a 1 ml HiTrap SP FF and a 1 ml HiTrap heparin column assembled in tandem. The unbound sample was collected and applied to a 1 ml DEAE column equilibrated in 25 mM Tris–HCl pH 7.2, 10% glycerol, 1 mM EDTA and 150 mM NaCl. Protein was eluted with a 30 CV gradient from 150 to 600 mM NaCl. Fractions were pooled, diluted twofold in 25 mM Tris–HCl pH 7.2, 10% glycerol, 1 mM EDTA and 150 mM NaCl and applied to a 1 ml MonoQ column equilibrated in the same dilution buffer. Protein was eluted with a 30 CV gradient from 150 to 600 mM NaCl. Peak fractions were pooled, concentrated to ˜400 μl and applied to Superdex 200 increase 10/300 column (GE Healthcare) equilibrated in 25 mM Tris–HCl pH 7.2, 10% glycerol, 1 mM EDTA and 150 mM NaCl. Fractions were pooled; protein was concentrated with Amicon Ultra‐15 30 kDa MWCO concentrator, frozen in liquid nitrogen and kept at −80°C. RPA purification Bl21 (DE3) Rosetta, transformed with pET28a RPA (1 l culture), were grown at 37°C in LB + 50 μg/ml kanamycin + 10 μg/ml chloramphenicol to an OD 600 of 0.6. Expression was induced by addition of 0.3 mM IPTG, and the culture was grown further for 3 h. Cells were harvested, and the pellet was resuspended in 50 mM Tris–HCl pH 7.5, 10% glycerol, 100 mM KCl, 1 mM EDTA, 1 mM DTT, 0.01% NP‐40‐S + protease inhibitors (cOmplete, EDTA‐free, one tablet per 50 ml buffer). Triton X‐100 was added to 0.1% and stirred for 5 min at 4°C. Cells were lysed via sonication (30%, 5s on/5s off, total 2 min), and insoluble material was removed by centrifugation (235,000 g , 4°C, 45 min). The supernatant was applied to a 5 ml HiTrap Blue column equilibrated in 50 mM Tris–HCl pH 7.5, 10% glycerol, 100 mM KCl, 1 mM EDTA, 1 mM DTT, 0.01% NP‐40‐S. The column was washed first with 40 ml equilibration buffer and further washed with 40 ml 20 mM Tris–HCl pH 7.5, 10% glycerol, 0.8 M NaCl, 1 mM EDTA, 1 mM DTT, 0.01% NP‐40‐S. Protein was eluted in a buffer containing 40% ethylene glycol, 2.5 M NaCl, 10% glycerol, 20 mM Tris–HCl pH 7.5, 1 mM EDTA, 1 mM DTT, 0.01% NP‐40‐S. Peak fractions containing RPA were pooled and dialysed against 2 l dialysis buffer (20 mM Tris–HCl pH 7.5, 10% glycerol, 50 mM NaCl, 1 mM EDTA, 1 mM DTT, 0.01% NP‐40‐S) for 90 min. Protein was applied to a 2 ml Bio‐Gel HT hydroxyapatite column (Bio‐Rad), and the flow through was re‐applied once. The column was first washed with 6 ml 50 mM Tris–HCl pH 7.5, 10% glycerol, 100 mM KCl, 1 mM EDTA, 1 mM DTT, 0.01% NP‐40‐S; then, protein was eluted with 6 ml 50 mM Tris–HCl pH 7.5, 10% glycerol, 100 mM KCl, 1 mM EDTA, 1 mM DTT, 0.01% NP‐40‐S, 80 mM potassium phosphate. Peak fractions were pooled and diluted in 20 mM Tris–HCl pH 7.5, 10% glycerol, 0.1 M KCl, 1 mM EDTA, 0.01% NP‐40‐S, 0.5 mM TCEP to reduce the conductivity of the sample. The sample was then applied to 1 ml MonoQ (GE Healthcare) equilibrated in 20 mM Tris–HCl pH 7.5, 10% glycerol, 0.1 M KCl, 1 mM EDTA, 0.01% NP‐40‐S, 0.5 mM TCEP. Protein was eluted with a 15 CV gradient from 100‐550 mM KCl. Fractions enriched for RPA were pooled and dialysed against 2 l dialysis buffer (25 mM HEPES‐KOH pH 7.6, 150 mM KOAc, 0.5 mM TCEP, 10% glycerol, 0.02% NP‐40‐S) for 4 h. The protein was frozen in liquid nitrogen and kept at −80°C.
DNA fork preparation
Stock solutions of both leading‐ and lagging‐strand oligos (Integrated DNA Technologies) were prepared, both at 53 μM in 25 mM HEPES‐NaOH, pH 7.5, 150 mM NaOAc, 0.5 mM TCEP, 2 mM Mg(OAc) 2 . The sequence of the lead strand fork was: 5′‐(Cy3)TAGAGTAGGAAGTGA(Biotinylated‐dT)GGTAAGTGATTAGAGAATTGGAGAGTGTG(T) 34 T ∗ T ∗ T ∗ T ∗ T ∗ T, where * denotes a phosphorothioate backbone linkage. The sequence of the lagging‐strand fork was: 5′‐GGCAGGCAGGCAGGCACACACTCTCCAATTCTCTAATCACTTACCA(Biotinylated‐dT)CACTTCCTACTCTA. Both leading and lagging oligos were mixed at an equimolar ratio and annealed to form a fork structure via gradual cooling from 80°C to room temperature.
Preparation of fork DNA for helicase assay
To anneal fork DNA, equal molars of fork‐leading and fork‐lagging oligos were mixed. The mixture was heated to 75°C and cooled to room temperature gradually. Oligo stocks were prepared in 25 mM HEPES‐NaOH, pH 7.5, 150 mM NaOAc, 0.5 mM TCEP, 2 mM Mg(OAc) 2 . Oligo sequences were modified from the fork substrates used in previous work (Georgescu et al , 2017 ; Kose et al , 2020 ). Fork leading was 5′‐ (Cy3)TAGAGTAGGAAGTGA(Bio‐dT)GGTAAGTGATTAGAGAATTGGAGAGTGTG (T) 34 T ∗ T ∗ T ∗ T ∗ T ∗ T, where ∗ denotes phosphorothioate backbone linkages. Fork‐lagging was 5′‐(Cy5)GGCAGGCAGGCAGGCAGGCAGGCAGGCAGGCAGGCAGGCAACACACTCTCCAATTCTCTAATCACTTACCATCACTTCCTACTCTA. The sequence of trap oligo used in the assay to prevent re‐annealing of the unwound DNA was 5′‐GGCAGGCAGGCAGGCACACACTCTCCAATTCTCTAATCACTTACCA(Bio‐dT) CACTTCCTACTCTA.
Helicase assay
To load CMG onto the substrate without unwinding, 50 nM CMG was incubated with 2 nM fork DNA in a buffer containing 25 mM HEPES‐KOH (pH 7.6), 100 mM potassium glutamate, 50 mM magnesium acetate, 0.005% (v/v) Tween‐20, 1 mM TCEP, 200 µg/ml BSA, 0.1 mM AMP‐PNP for 5 min at 37°C. 5 mM ATP (or equal volume of water in ‐ATP reaction) and 80 nM trap oligo were added to initiate the reactions. The reactions were stopped after 15‐min incubation at 37°C with a buffer containing 0.1% SDS, 10 mM EDTA, 5% glycerol, 10 U/ml Proteinase K and bromophenol blue. The reactions were run on 10% TBE PAGEr Gold Precast Gels (Lonza) at 170 V for 70 min. The gel was imaged on Typhoon laser imager (GE Healthcare).
Primer extension assay
Primed template was prepared by annealing 500 nM oligonucleotide (sequence: 5′‐GAATAATGGAAGGGTTAGAACCTACCAT) to 50 nM M13mp18 ssDNA (New England Biolabs) in 10 mM Tris–HCl pH 7.6, 100 mM NaCl and 5 mM EDTA. The mixture was heated to 75°C and gradually cooled to room temperature. Unannealed oligonucleotide was removed using S400 column (GE Healthcare). The primer extension reaction was performed at 37°C in a buffer containing 25 mM HEPES‐KOH (pH 7.6), 100 mM potassium glutamate, 0.01% NP‐40‐S, 1 mM DTT, 10 mM Mg(OAc) 2 , 0.1 mg/ml BSA, 3 mM ATP, 400 μM CTP, GTP, UTP, 30 μM dATP, dCTP, dGTP, dTTP, 33 nM α‐[ 32 P]‐dCTP. 1 nM primed templated was pre‐incubated with 250 nM RPA for 5 min. 20 nM PCNA and 4 nM RFC were added, and the reaction was initiated by the addition of 20 nM Pol ε. Aliquots were removed at the indicated time points and stopped with 50 mM EDTA. Unincorporated nucleotide was removed with illusta MicroSpin G‐50 columns (GE Healthcare), and samples were run on 0.6% alkaline agarose gel at 23 V for 16 h. The gel was fixed with cold 5% trichloroacetic acid and dried onto Whatman paper. The gel was exposed on BAS‐IP MS Storage Phosphor Screen (GE Healthcare), and screen was developed on a Typhoon laser imager (GE Healthcare). Glycerol gradient preparation Buffer A (40 mM HEPES‐NaOH, pH 7.5, 150 mM NaOAc, 0.5 mM TCEP, 500 μM AMP‐PNP, 3 mM Mg(OAc) 2 and 10% v/v glycerol) was layered on top of an equal volume of Buffer B (Buffer A + 30% v/v glycerol) in a 2.2 ml TLS‐55 tube (Beranek Laborgerate) to prepare un‐crosslinked samples. For the generation of crosslinked samples, fresh Buffer B was supplemented with 0.16% glutaraldehyde (Sigma) and 2 mM bis(sulfosuccinimidyl)suberate (BS 3 , ThermoFisher). Gradients were prepared using a gradient‐making station (Biocomp Instruments, Ltd.) and cooled for 30 min at 4°C. Replisome assembly for cryo‐EM The reconstitution reaction was set up to yield a final volume of 550 μl, containing 100 nM CMG with a 1.5‐fold molar excess of other components in reconstitution buffer (25 mM HEPES‐NaOH pH 7.6, 150 mM NaOAc, 0.5 mM TCEP, 500 µM AMP‐PNP, 10 mM Mg(OAc) 2 ). Firstly, CMG was incubated with the fork DNA for 30 min on ice. Next, the additional proteins were added in the following order: AND‐1, TIMELESS/TIPIN, Pol ε and CLASPIN, and the volume adjusted to 550 μl. CLASPIN was omitted at this stage for the minus‐CLASPIN sample. The reaction was incubated for 30 min on ice prior to being loaded onto a gradient. 183 μl of the reconstitution reaction was loaded onto each gradient: one lacking crosslinker and two containing crosslinker. Samples were separated by centrifugation (Beckman TLS‐55 rotor, 200,000 g , 4°C, 2 h) and 100 μl fractions collected manually. Silver‐stained SDS–PAGE of samples +/− crosslinker was used to identify fractions containing the complete core replisome. The selected fractions from the crosslinked gradients were pooled and buffer exchanged into cryo‐EM buffer (reconstitution buffer lacking glycerol + 100 μM AMP‐PNP and 0.005% v/v Tween‐20 (Sigma, Cat#P8341)) through six rounds of concentration via centrifugation (21,000 g , 4°C, 1 min/round) and re‐dilution in a 0.5 ml 30K MWCO centrifugal filter (Amicon). Finally, the sample was concentrated to ˜30 μl and used for cryo‐EM grid preparation. Cryo‐EM grid preparation Quantifoil R2/2, Cu‐400 mesh cryo‐EM grids pre‐coated with an ultra‐thin (3–5 nm) amorphous carbon (produced in‐house and by electron microscopy sciences) were glow discharged for 5 s at a plasma current of 15 mA (PELCO easiGlow). 3 μl of sample was applied and incubated for 45 s at 4°C before manually blotting with filter paper for 8 s and plunge‐freezing in liquid ethane.
Data collection Complete replisome
Three datasets were collected on the same FEI Titan Krios microscope (LMB Krios1), operating at 300 keV with the specimen at cryogenic temperatures (approximately −180°C), with images recorded at a defocus of between −1.5 and −3.5 μm. A total of 4,923 movies were acquired across two collections using the K2 Summit direct electron detector (Gatan) in electron counting mode with a GIF Quantum energy filter slit width of 20 eV, using a calibrated pixel size of 1.145 Å/pixel. These data were collected using the EPU software package (ThermoFisher) and the dose fractionated into 40 frames per movie, with an exposure time of 10 s to achieve a total dose of 39.8 e ‐ /Å 2 . An additional 2,400 movies were acquired using the Falcon III direct electron detector (ThermoFisher) in electron counting mode using a calibrated pixel size of 1.07 Å/pixel. 75 movie frames were recorded over 60 s to give a total dose of 37.5 e − /Å 2 . Minus CLASPIN replisome 2998 movies were collected on a Titan Krios microscope (LMB Krios2), operated as described for the complete core replisome sample. Images were acquired at a defocus of between −1.5 and −3.5 μm using the K2 Summit direct electron detector (Gatan) in electron counting mode with a GIF Quantum energy filter slit width of 20 eV, using a calibrated pixel size of 1.1 Å/pixel. The total dose was fractionated into 40 frames, with an exposure time of 10 s to achieve a total dose of 39.2 e − /Å 2 .
Data processing Complete core replisome
Image processing was carried out using RELION 3.1 (Zivanov et al , 2018 ) unless otherwise stated. All refinements were performed using independent data half‐sets (gold standard refinement), and resolutions were determined based on the Fourier shell correlation (FSC = 0.143) criterion. The gain‐corrected movies were aligned using 5 × 5 patches in MotionCor2 (Zheng et al , 2017 ) with dose weighting. CTF estimation was carried out using CTFFIND‐4.1 (Rohou & Grigorieff, 2015 ). After manual inspection of the aligned micrographs for the complete replisome datasets, 331 micrographs were discarded due to the presence of crystalline ice. No micrographs were discarded from the minus CLASPIN dataset. Gautomatch ( https://www2.mrc‐lmb.cam.ac.uk/research/locally‐developed‐software/zhang‐software/#gauto ) was used to pick particles from the complete replisome micrographs. Initially, a subset of 500 micrographs were picked using 2D references generated from the previously published yeast replisome structure (Baretić et al , 2020 ). 20,214 particles were picked from this subset and submitted for two rounds of 2D classification. Five 2D classes were then selected from the results of this processing that contained high‐resolution features and represented diverse molecular views of the particle. These 2D classes were subsequently used as the templates to pick the entire complete replisome and minus CLASPIN datasets. For the complete replisome data, a total of 490,110 particles were picked using Gautomatch. These particles were extracted and down‐sampled by a factor of four into a box of 100 pixels and submitted for one round of 2D classification. 360,349 particles were selected following 2D classification and submitted for 3D classification into four classes using a regularisation parameter of 4 and a 3D reference derived from the previously published structure of the yeast replisome. A single class was selected from the results of this 3D classification, comprising 280,190 particles, and the particles re‐extracted and down‐sampled by a factor of 2 into a box of 200 pixels. These particle images were then submitted for three further rounds of 3D classification, with classes being taken forward if they contained all replisome components and displayed structural features, e.g. helical density. Using these criteria, 138,400 particles were selected to be un‐binned into a box of 380 pixel diameter (435.5 Å) and submitted for 3D auto‐refinement. The results of the refinement were post‐processed, generating a reconstruction at a resolution of 3.8 Å. The data were then polished (Zivanov et al , 2019 ) and the CTF parameters refined, before being re‐submitted for 3D auto‐refinement and post‐processing, generating a reconstruction at 3.4 Å resolution. Using 3D classification without alignment, a subset of 110,266 particles was identified that displayed high‐resolution features. This subset was refined to 3.2 Å resolution and sharpened using a B‐factor of −35 Å 2 . This map was used to build atomic models for CMG, TIMELESS, TIPIN and DNA.
Multi‐body refinement
(Nakane et al , 2018 ) was performed by generating soft masks, generated in UCSF Chimera (Pettersen et al , 2004 ), around the MCM2‐7 N‐ and C‐tiers, TIMELESS‐TIPIN and DNA, AND‐1 and a complex of CDC45/GINS and Pol ε, the results of which were used to build the model of the Pol ε non‐cat module. An additional multi‐body refinement was carried out using masks covering a complex of CDC45/GINS and AND‐1, and the remainder of the map which significantly improved the density of AND‐1, permitting model building. In order to recover density for the catalytic domain of Pol ε, the entire dataset was re‐picked using the Laplacian‐of‐Gaussian autopicking feature within Relion‐3.1. 560,443 particles that were auto‐picked were extracted and binned by a factor of four, into a box of 100 pixels. These particle images were classified using one round of 2D classification, resulting in 388,320 particles that were further classified in 3D. Following four rounds of 3D classification to remove low‐resolution classes and those lacking replisome components, 100,988 particles from two 3D classes were selected for refinement. The selected particle images were re‐extracted and binned by a factor of two, to boost the signal‐to‐noise of regions of weak density, into a box of 160 pixels. The data were submitted for 3D‐auto‐refinement which, following post‐processing, generated a reconstruction at 4.9 Å resolution. A soft mask was generated in UCSF Chimera covering the Pol ε non‐catalytic module, and signal subtraction was carried out to remove any signal outside of the mask boundary. The data were recentred on the mask and then submitted for 3D classification without alignment using a 3D reference of the complete core human replisome, recentred on the Pol ε non‐catalytic module. Of the ten classes generated, the best three, displaying secondary structure features were selected as representative of classes incorporating high‐quality Pol ε particles. The 87,877 signal‐subtracted particle images from the selected 3D classes were reverted to their original non‐signal‐subtracted parent images, re‐extracted into a larger box of 550 pixels (629.75 Å) and re‐submitted for 3D auto‐refinement and post‐processing, generating a reconstruction at 6.8 Å resolution. In order to identify density for the Pol ε catalytic domain, three soft masks were generated which represented putative regions of catalytic domain density: one covering the disordered density between AND‐1 and the Pol‐ε non‐cat module which appears during consensus refinement, a second mask representing the linear configuration of Pol ε identified in yeast (Yuan et al , 2020b ) (EMD‐21707) and a third close to the MCM2‐7 C‐tier. These three masks were aligned on, and were merged with, the original mask covering the human Pol ε non‐catalytic module. Signal subtraction and 3D classification were then carried out as previously described in this section. Of the 15 classes generated, two contained additional density in the linear configuration. The 6,303 particles presented by these selected classes were reverted to their original.star file and refined and post‐processed to a resolution of 10 Å. The resulting map was used to dock in the structure of the complete yeast Pol ε holoenzyme. cryoSPARC processing Human replisome dataset #1, in the presence of CLASPIN, was additionally processed using cryoSPARC‐3 (Punjani et al , 2017 ). 3422 previously motion‐corrected micrographs were imported into the cryoSPARC pipeline and their CTF parameters estimated using the Patch CTF estimation, 5 × 5. The Blob‐Gaussian picking feature identified 602,412 particles. Following particle screening, 503,188 particle images were extracted and down‐sampled 4×. These images were classified in 2D and classes were selected that best resembled previous 2D classes obtained using Relion‐3.1. This resulted in 288,073 particles being submitted for two rounds of 3D classification via heterogeneous refinement, using four copies of an identical 3D ab initio model as a reference. Classes were selected based upon the presence of high‐resolution features and whether they contained the full complement of replisome proteins. The resulting 158,465 particles were refined to 3.3 Å resolution using homogenous refinement. Minus CLASPIN replisome For the minus‐CLASPIN replisome data, a total of 482,101 particles were picked by Gautomatch, using 2D references generated from the complete replisome dataset. These particles were extracted and down‐sampled by a factor of four into a box of 100 pixels and submitted for two rounds of 3D classification into four classes using a regularisation parameter of 4 and a 3D reference derived from the complete replisome data. Two classes were selected from the results of this 3D classification, comprising 107,833 particles based upon their protein composition and the presence of high‐resolution features. These selected particles were re‐extracted, un‐binned, into a box for 400 pixels (440 Å) and submitted for 3D auto‐refinement. The results of the refinement were post‐processed, generating a reconstruction at a resolution of 3.8 Å. The data were then polished and the CTF parameters refined, before re‐refinement and post‐processing which generated a reconstruction at a resolution of 3.4 Å.
Model building and refinement
In order to begin building a model for the complete core human replisome, previously published atomic models for various replisome components were rigid‐body‐docked into the consensus refinement map at 3.2 Å resolution. Models for the MCM2‐7 N‐tier and both CDC45 and GINS came from the previous cryo‐EM structure of hsCMG (PDB: 6XTX) (Rzechorzek et al , 2020 ). As the C‐tier configuration of the structure of hsCMG differed to that of the human replisome structure presented here, the C‐tier region of each MCM2‐7 subunit (PDB: 6XTX) was docked individually into the density and both the linkers between the N‐ and C‐tier domains and the AMP‐PNP ligands removed. The crystal structure of the N‐terminal domain of TIMELESS (PDB: 5MQI) (Holzer et al , 2017 ) was docked into the map and this ensemble was used as the starting point for model building. First models were refined against the map density in real‐space using Phenix real‐space‐refine (Afonine et al , 2018 ) in the absence of secondary structure restraints. The models were then manually refined in Coot (Emsley et al , 2010 ) using the local refinement and regularisation tools incorporating stereochemical restraints. Where the density was of sufficient quality, we were able to expand the coverage of the starting models by building into the density de novo using Coot. For TIMELESS, we were able to build the previously absent MCM‐plugin (residues 239–332) and extend the C‐terminal region of the protein (residues 464–803) containing both DNA‐binding motifs and the TIPIN interaction domain. TIMELESS residues 527–684 were not visualised in this study. A homology model was generated for TIPIN (residues 68–132) using I‐TASSER (Yang et al , 2015 ), based on the structure of Csm3 and rigid body‐docked into the density. The N‐ and C‐terminal regions were expanded to cover residues 62–147 manually in Coot. For the MCM2‐7 subunits, the MCM6 N‐terminus is extended (residues 1–14) and interacts extensively with the core of TIMELESS. An additional 11 residues of the N‐terminal extension of MCM4 is visualised (residues 146–157) interacting with the wedge feature of the TIMELESS MCM‐plugin. The first 14 residues of MCM3 in the published human hsCMG model (PDB: 6XTX) (Rzechorzek et al , 2020 ) are re‐assigned to MCM3 residues 524–533. In MCM7, an additional, flexibly linked helix (residues 100–114) is identified. The N‐terminal hairpin of MCM7 (residues 283–290) was built as a short helix. The N/C‐tier flexible linkers were re‐built for each subunit. The MCM2‐7 C‐tier was re‐built to accommodate an alternative DNA‐binding mode, with the PS1 loops, helix H2 and H2I loops extensively remodelled. A homology model was generated for the winged‐helix (WH) of MCM4 (residues 798–857) which was rigid body docked into the lower resolution density sat within the C‐tier pore and subjected to real‐space‐refinement in Phenix. The placement of this domain was guided by the reasonable resolution density for the first helix of the MCM4 WH domain. AMP‐PNP/Mg 2+ was built in well resolved density at the MCM2/6, 2/5 and 3/5 interfaces with side chains visible for WalkerA, WalkerB, Arg‐finger and Sensor2 motifs. Eleven nucleotides of ssDNA within the C‐tier were built de novo whereas the duplex portion of the DNA was rigid body docked as an idealised B‐form duplex. Sequence register was assigned based on the sequence of our fork DNA assuming no unwinding occurred. DNA at the fork junction was refined manually in Coot and the first nucleotides following strand separation built manually. The crystal structure of the AND‐1 SepB domain (PDB: 5OGS) (Kilkenny et al , 2017 ) was docked into the AND‐1 trimer density within the multi‐body refinement map containing CDC45/GINS and AND‐1. The position of residues at the interface between AND‐1 and CDC45/GINS was adjusted manually in Coot and the fit to density optimised using Phenix real‐space‐refine. A homology model for the non‐catalytic module of Pol ε (POLE1 residues 1,371–2,280 and POLE2 residues 1–527) was generated using I‐TASSER and rigid body docked into the multi‐body refinement map containing CDC45/GINS and Pol ε. Two of the top threading templates were a crystal structure of human POLE2 in complex with a C‐terminal region of POLE1 (PDB: 5VBN) (Baranovskiy et al , 2017 ) and an NMR structure of the N‐terminal helical domain of POLE2 (PDB: 2V6Z) (Nuutinen et al , 2008 ). Despite the existence of the NMR structure covering this region, residues 1–85 of POLE2, comprising the N‐terminal helical domain and flexible linker, were manually built manually using Coot due to the high quality of the data. The fit‐to‐density of the resulting homology model was optimised using ISOLDE and residues at the interfaces with CMG were manually optimised in Coot followed by real‐space‐refinement in Phenix. The resulting model displayed high levels of structural homology with previously published structures: RMSD of 1.21 Å for 5VBN (Baranovskiy et al , 2017 ) and 1.23 Å for 2V6Z (Nuutinen et al , 2008 ). AlphaFold (Jumper et al , 2021 ; Tunyasuvunakool et al , 2021 ) was used to identify candidate regions of CLASPIN to dock into CLASPIN‐dependent densities 1–3. CLASPIN‐dependent density 1 consists of two α‐helical segments of density, connected by a linker. The shorter of the two α‐helices comprises approximately 5 amino acids and contains density for three large, bulky residues. The longer of the two helices comprises approximately 15 residues. To estimate the length of the linker region between the two helices, a 13‐residue poly‐alanine model was manually built into the density. Manual inspection of the AlphaFold predicted model for H. sapiens CLASPIN identified only one region of sequence, residues 277–318, which satisfied these structural requirements. Rigid‐body docking of the AlphaFold model for CLASPIN residues 277–318 into CLASPIN‐dependent density 1 resulted in an excellent fit‐to‐density, with clear side‐chain density correctly positioned for CLASPIN H315, F317, F318. The model fit‐to‐density was improved manually using COOT and automatically using both ISOLDE and PHENIX real‐space‐refinement. The resulting model displayed clear side‐chain density for residues in the linker region between the two helices, particularly P305, Y306, H307 and P309. It also correctly oriented the larger of the two α‐helices, residues 284–299, displaying clear side‐chain density for R298 which interacts with Y474 of TIMELESS. In addition to the excellent fit‐to‐density, the interactions predicted by the model for CLASPIN make energetically favourable and chemically feasible interactions. CLASPIN residues F317 and F318 extend into a conserved hydrophobic pocket in TIMELESS, L304 and L302 contact another hydrophobic patch on TIMELESS and polar residues in the longer of the two α‐helices form charged interactions at a third site on TIMELESS. Finally, the equivalent region of Mrc1, the S. cerevisiae ortholog of CLASPIN, can be docked into previously unmodelled density present in the analogous position to site 1 in a yeast replisome reconstruction (EMD‐10227) (Baretić et al , 2020 ), with clear side‐chain density present for Mrc1 residues F325, F326, F331 and F335. CLASPIN‐dependent density 2 consists of a single α‐helix approximately 12–15 residues in length. This helical segment docks onto a highly hydrophobic pocket on the C‐tier of MCM6. Inspection of the density indicates the presence of three large bulky residues within the helix. There is only one candidate helix present in the AlphaFold predicted model that satisfies these requirements, spanning residues 526–539. Rigid‐body docking of this helix into CLASPIN‐dependent density 2 following by fit optimisation using COOT, ISOLDE and PHENIX resulted in an excellent fit‐to‐density. There is clear side‐chain density for residues H538, W536, F535, K532, R534 and L531. Furthermore, this helix positions F535 and L531 into the hydrophobic pocket on MCM6 while K532 and R534 project away from the replisome, satisfying the chemical requirements of the interface. CLASPIN‐dependent density 3 consists of a single α‐helix approximately 26‐residues in length. The AlphaFold predicted model for H. sapiens CLASPIN reveals only three candidate helices of sufficient length the occupy this density. Each of the three candidate helices was rigid‐body‐docked into the density and the fit optimised using COOT, ISOLDE and PHENIX. The fit to density for the helix comprising CLASPIN residues 592–625 was excellent and far superior to the other two candidate helices: residues 1,091–1,121 and residues 1,205–1,221. There is clear side‐chain density for residues K593, Q595, V596, K598, K600, Q602 and M605. There is also clear density for CLASPIN residues L594, L597 and L601 which contact a hydrophobic patch on MCM2. The model for CLASPIN site 3 also predicts many residues forming chemically favourable interactions with both TIMELESS, MCM2 and MCM6. Furthermore, the other two candidate helices are in the C‐terminal region of CLASPIN, which is not predicted to interact with this region of the replisome based upon cross‐linking mass spectrometry data of the budding yeast replisome (Baretić et al , 2020 ). Finally, the relative positioning of the helices occupying CLASPIN sites 2 and 3 is in agreement with the AlphaFold model, with there being no intervening helices between them. Minus CLASPIN replisome For the minus CLASPIN replisome, the model for the complete replisome was rigid body docked into the density (minus the candidate CLASPIN poly‐alanine chain) and the fit optimised using Phenix real‐space‐refine and manual editing in Coot. Combine focussed maps The complete replisome model, consensus refinement map at 3.2 Å and the two multi‐body refinement maps used to build Pol ε and AND‐1 were submitted to the combine focussed maps feature of the Phenix software package. Combine‐focussed‐maps uses map‐to‐model correlation to determine which are the highest resolution regions of each map, and the relationships between the models in the different maps. This information is then used to superimpose the highest resolution regions of each map to generate a single composite map. This permitted the refinement of the complete replisome model within a single map using real‐space‐refinement in Phenix and ISOLDE, coupled to manual optimisation in Coot.
Model to cryo‐EM map validation Fourier shell correlation
(FSC) between the fully refined models +/− CLASPIN and the respective unsharpened sums of their two half maps was calculated using XMIPP (Sorzano et al , 2004 ). Multiple sequence alignments Amino acid sequences were retrieved from UniProt and protein sequence alignments carried out using Clustal Omega (Sievers & Higgins, 2014 ). Alignments were rendered using ESPript3.0 ( http://espript.ibcp.fr ) (Robert & Gouet, 2014 ).
Structural analysis and visualisation
All figures of structures were generated in either Chimera or ChimeraX. Calculations of buried surface area were performed using PDBePISA (Krissinel & Henrick, 2007 ).
Supporting information Appendix Click here for additional data file. Expanded View Figures PDF Click here for additional data file.
📊 Figures
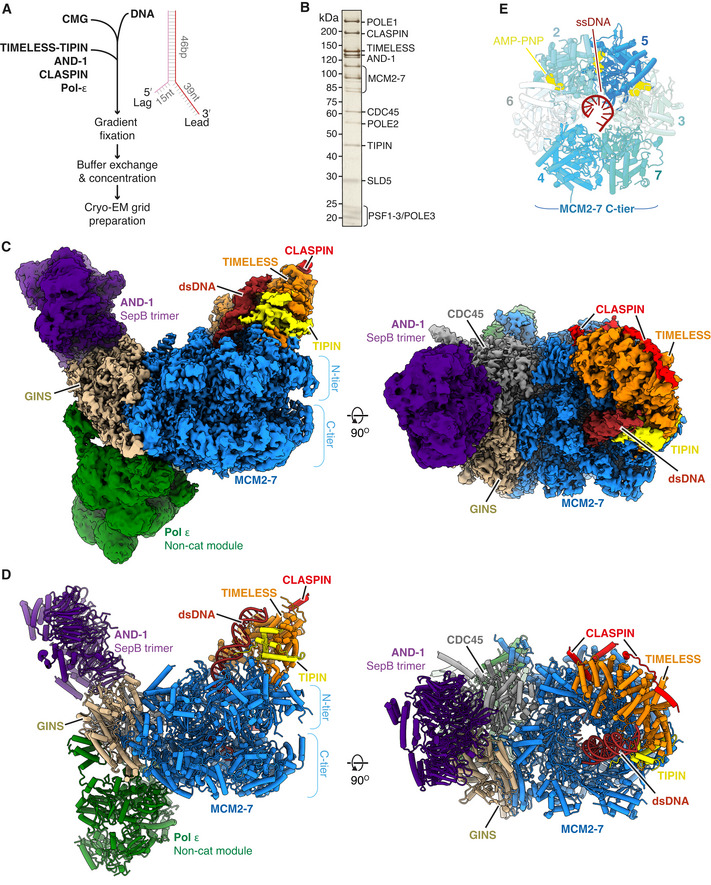
Figure 1
Cryou2010EM structure of the core human replisome
A Schematic illustrating the inu00a0vitro reconstitution method of sample preparation for cryou2010EM experiments. B Silveru2010stained SDSu2013PAGE of a peak fraction from a native glycerol gradient ...
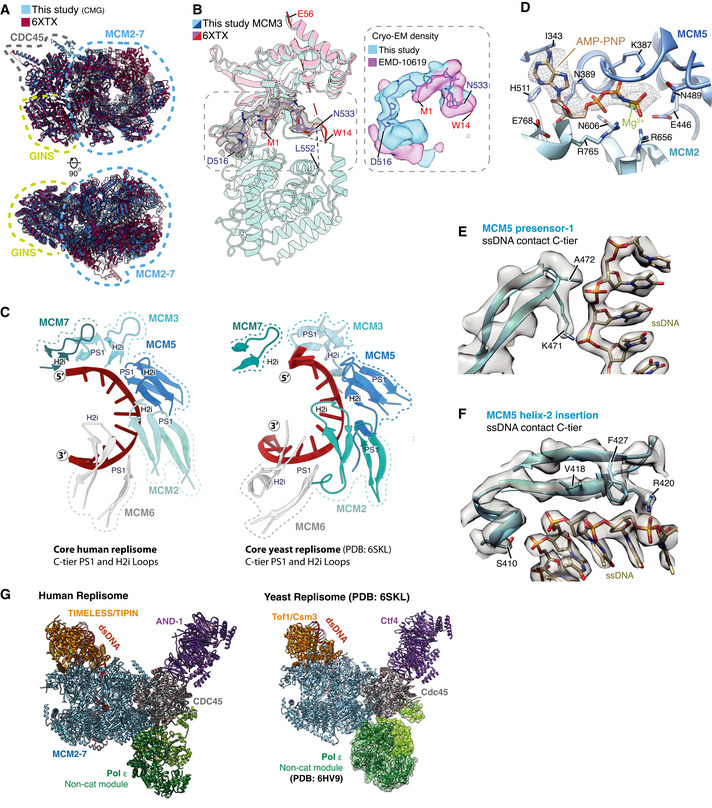
Figure EV1
(Related to Fig 1 ). MCM2u20107 engagement with ssDNA in the Cu2010tier
A Comparison of the MCM Nu2010tier, GINS and CDC45 between the core replisome structure from this study (blue) (PDB: 7PFO) and the hsCMG:ssDNA structure (red) (PDB: 6XTX) (Rzechorzek etu00a0al , 2020 ...
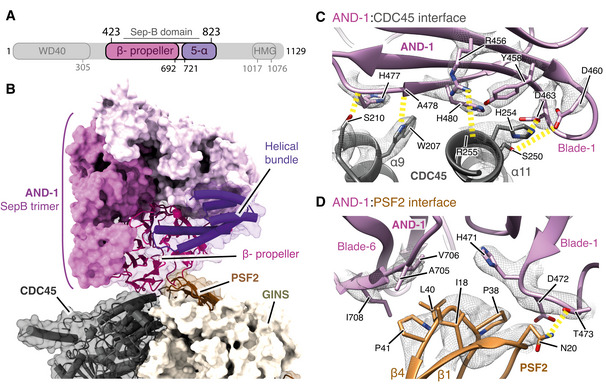
Figure 2
Structure of ANDu20101 in the replisome
Schematic for the domain architecture of ANDu20101. Regions visualised in this structure are coloured, with domain boundaries demarcated by primary sequence numbering. Model of the ANDu20101 SepB doma...
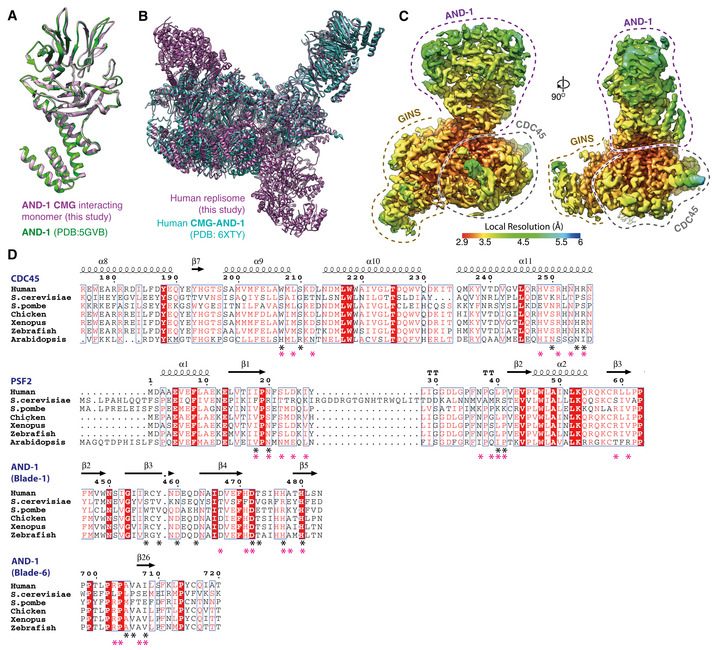
Figure EV2
(Related to Fig 2 ). Structure of ANDu20101 in the replisome
Comparison of the ANDu20101 SepB domain from the core replisome (this study, purple) with the crystal structure of the isolated protein (PDB: 5GVB, green) (Guan etu00a0al , 2017 ). Comparison of the p...
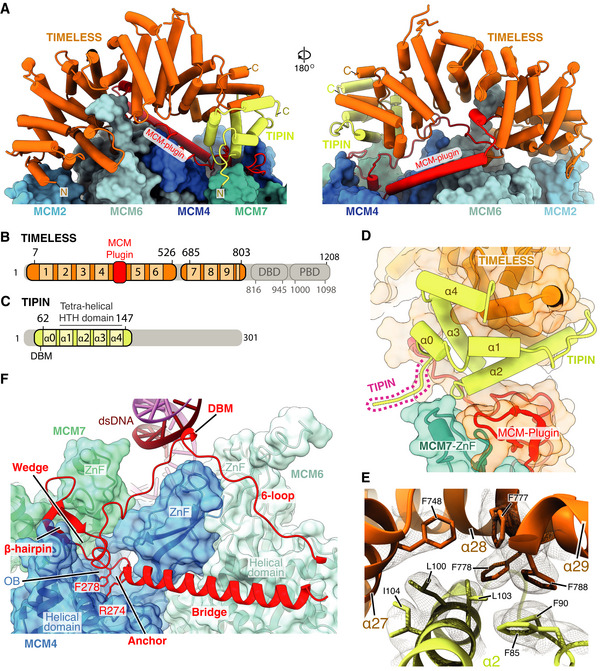
Figure 3
Structure of TIMELESSu2010TIPIN in the human replisome
Atomic model for TIMELESSu2010TIPIN bound to MCM displayed using stubs and cylinders, with Nu2010 and Cu2010termini labelled. Models for the MCM2, 6, 4 and 7 subunits are displayed using surface rende...
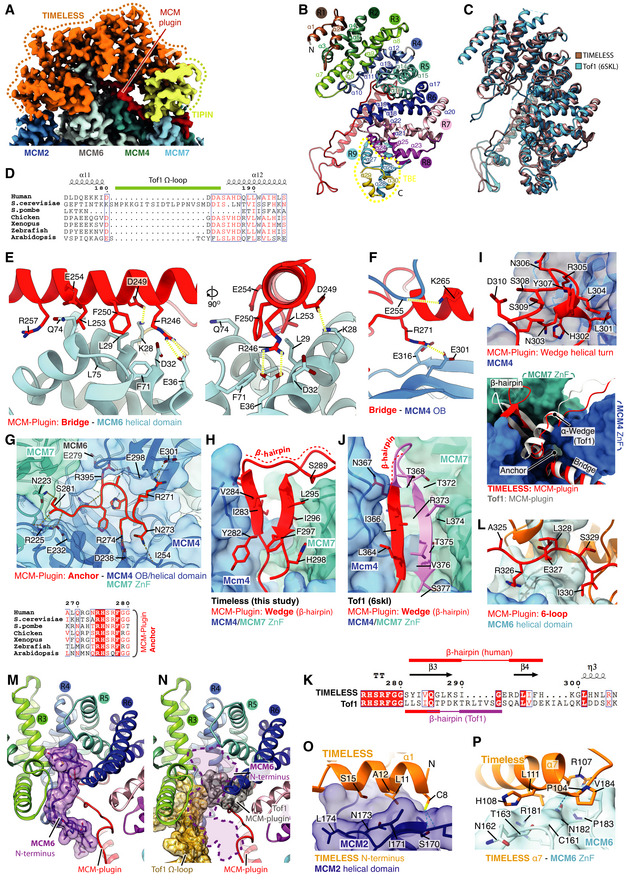
Figure EV3
(Related to Fig 3 ). Structure of TIMELESSu2010TIPIN
A Cryou2010EM density coloured according to protein chain occupancy, except for the TIMELESS u201cMCMu2010pluginu201d element which is highlighted in red. For clarity DNA density is not shown. B Assig...
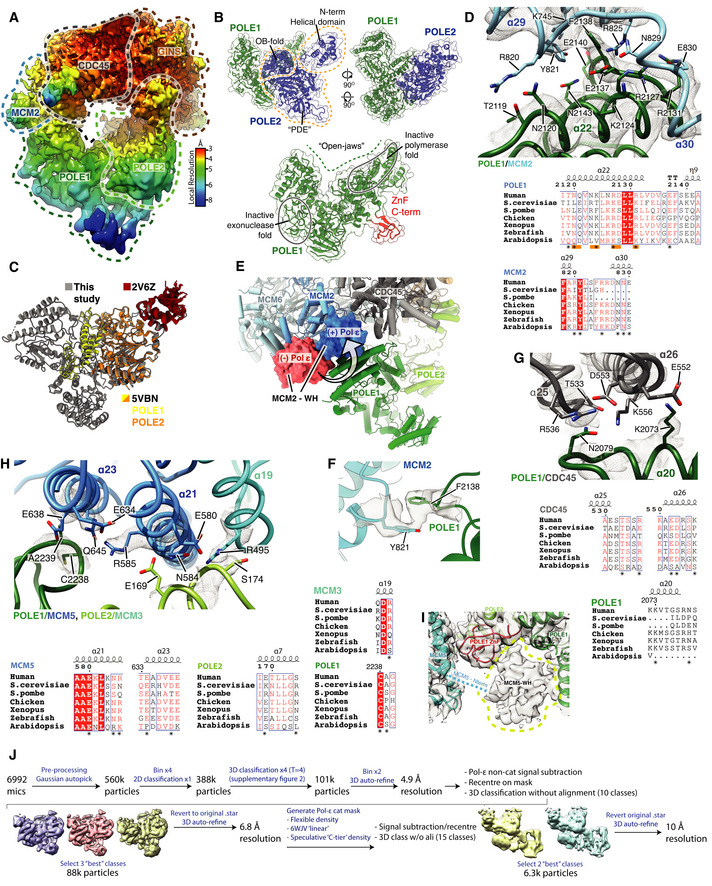
Figure EV4
(Related to Fig 4 ). Structure of Pol u03b5
Cryou2010EM map obtained using MultiBody refinement (Nakane etu00a0al , 2018 ) masking over the Pol u03b5 nonu2010catalytic module, CDC45 and GINS. Map coloured by local resolution according to inset ...
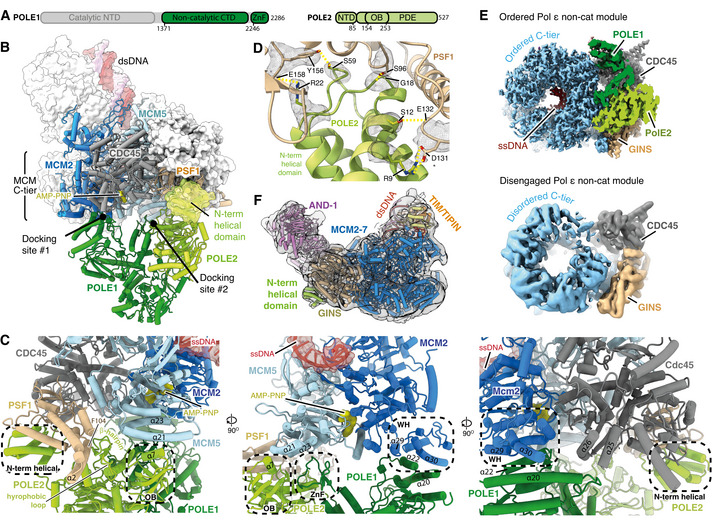
Figure 4
Structure and attachment of the Pol u03b5 nonu2010cat module
Primary structure diagram for POLE1 and POLE2. Regions of the protein visualised in this study are coloured and domain boundaries are demarcated using primary sequence numbering. Overview of the inter...
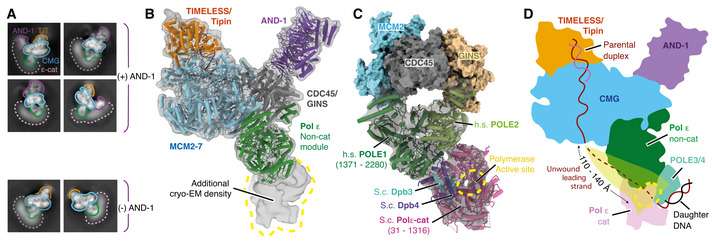
Figure 5
Position of the Pol u03b5 catalytic domain in the replisome
2D classes for the core human replisome for particles containing and lacking ANDu20101 density as indicated. Additional diffuse density that we attribute to the Pol u03b5u00a0catalytic domain is indic...
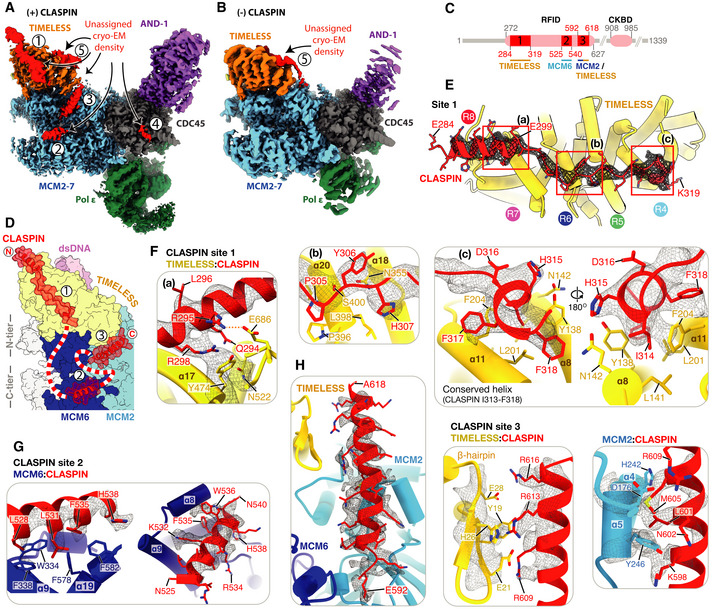
Figure 6
CLASPIN binding in the human replisome
A Cryou2010EM map of the complete core replisome coloured as in Fig 1C showing regions of density, labelled 1u20135 (red), that remained unassigned after initial model building. B Cryou2010EM map of a...
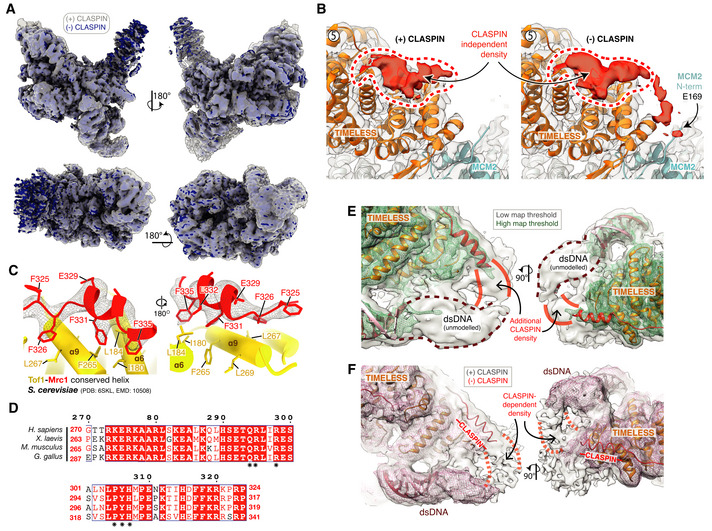
Figure EV5
(Related to Fig 6 ). Identification of CLASPIN docking sites on the human replisome
Cryou2010EM reconstruction of the core human replisome in the presence of CLASPIN (grey) rigidu2010bodyu2010docked into the cryou2010EM reconstruction in the absence of CLASPIN (blue) using UCSF Chime...
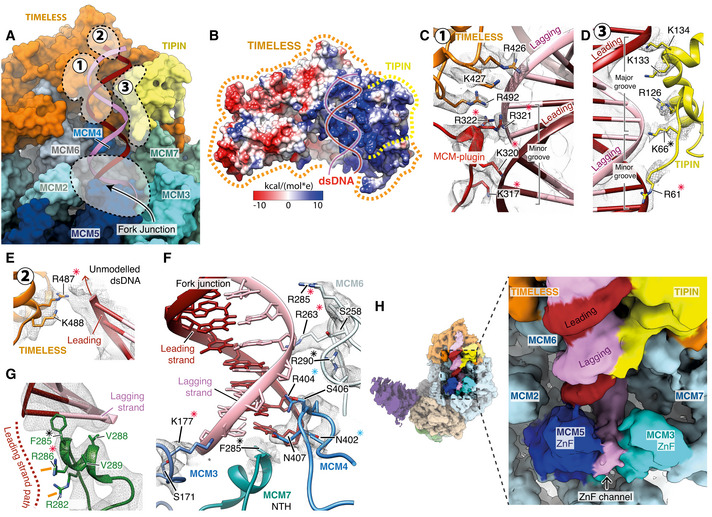
Figure 7
Coordination of replication fork DNA during template unwinding
A Overview of the interactions between the MCM2u20107 Nu2010tier and TIMELESSu2010TIPIN with the parental DNA duplex and fork junction. Key regions of proteinu2013DNA contacts are circled with dashed ...
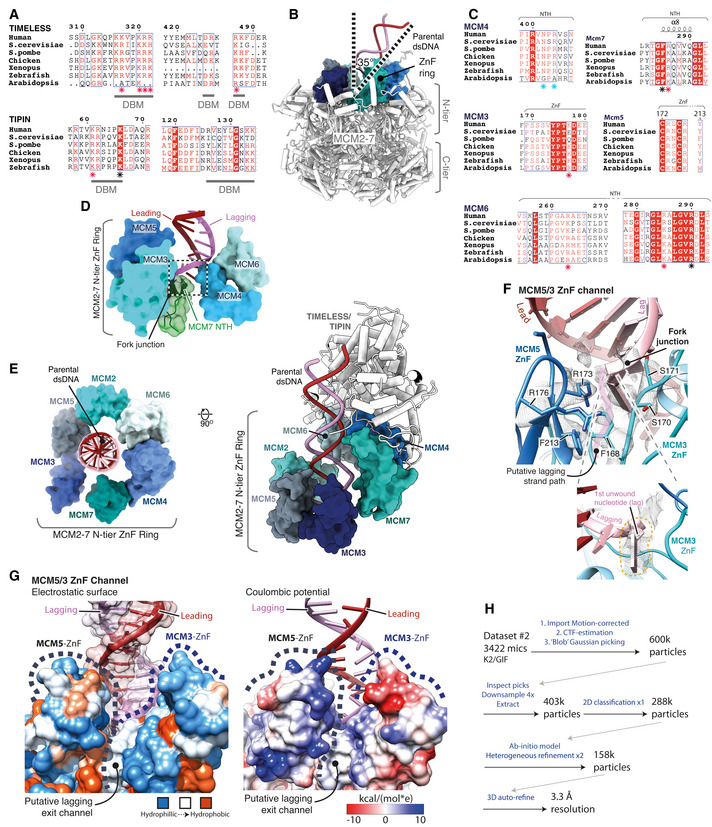
Figure EV6
(Related to Fig 7 ). Interactions between the human replisome and fork DNA
Multiple sequence alignment for regions in TIMELESS (top) and TIPIN (bottom) involved in DNA binding. Specific residues seen to be interacting with dsDNA in the structure are demarcated as part of a D...
Figure images are served from the NIH/NLM PubMed Central Open Access Subset or Europe PMC; copyright remains with the publishers and authors.
💬 Discussion
0 commentsNo comments yet. Be the first to start a discussion!
Leave a Comment