Abstract
Abstract The structure of chromatin plays pivotal roles in regulating gene transcription, DNA replication and repair, and chromosome segregation. This structure, however, remains elusive. Here, using cryo-FIB and cryo-ET, we delineate the 3D architecture of native chromatin fibres in intact interphase human T-lymphoblasts and determine the in situ structures of nucleosomes in different conformations. These chromatin fibres are not structured as uniform 30 nm one-start or two-start filaments but are composed of relaxed, variable zigzag organizations of nucleosomes connected by straight linker DNA. Nucleosomes with little H1 and linker DNA density are distributed randomly without any spatial preference. This work will inspire future high-resolution investigations on native chromatin structures in situ at both a single-nucleosome level and a population level under many different cellular conditions in health and disease.
🔬 Techniques
🔭 Microscopes
✨ Fluorophores
🧪 Sample Preparation
🔬 Cell Lines
🏭 Microscope Brands
🧪 Reagent Suppliers
📷 Detectors
💻 Software Details
💻 Code & Software
💾 Data Repositories
🏛️ Research Organizations (ROR)
Affiliated research institutions:
📋 Methods
Cell culture and vitrification CEM CD4+
T-cells (catalogue ARP-117, HIV reagents program) were cultured in DMEM (Gibco) supplemented with 10% FBS, 2 mM L-glutamine (Gibco) and 1% MEM non-essential amino acids (Gibco), at 37 °C and 5% CO 2 . CEM cells at 3 × 10 6 cells/ml after 10 passages were pelleted at 200 x g for 5 min at 20 °C and resuspended in PBS mixed with 10% glycerol. An aliquot of 3 µl cell suspension was applied to the glow-discharged holey carbon-coated copper (R 2/1, 200 mesh) (Quantifoil) and blotted for 9 seconds by Leica GP2 (Leica Microsystems), followed by plunge freezing in liquid ethane. Cryo-FIB milling Vitrified cells were further processed by cryo-FIB milling for the preparation of lamellae. A dual-beam microscope FIB/SEM Aquilos 2 (Thermo Fisher Scientific) equipped with a cryo-transfer system (Thermo Fisher Scientific) and rotatable cryo-stage cooled at −191 °C by an open nitrogen circuit was used to carry out the thinning. Prior to the milling, the grids were mounted on the shuttle and transferred onto the cryo-stage, followed by the coating with an organometallic Platinum layer using the GIS system (Thermo Fisher Scientific) for 5–6 s. Then, cells positioned approximately in the centres of grid squares were selected for thinning. The thinning was conducted by the automated milling software AutoTEM 5 (Thermo Fisher Scientific) in a stepwise manner from current 0.5 μA to 30 pA at 30 kV, and the final thickness of lamellae was set to 120 nm.
Cryo-ET data collection
Cellular lamellae were transferred to FEI Titan Krios G2 (Thermo Fisher Scientific) electron microscope operated at 300 kV and equipped with a Gatan BioQuantum energy filter and post-GIF K3 detector (Gatan, Pleasanton, CA). A 100 µm objective aperture was inserted. Areas that include nuclei were selected for the data acquisition. Tilt series were recorded using Tomography 5 software (Thermo Fisher Scientific) with a nominal magnification of 42k and a physical pixel size of 2.18 Å/pixel. All tilt series were collected with a zero-loss imaging filter with a 20 eV-wide slit. The defocus value was set from -3.5 to -5 µm. The pre-tilt of the lamellae was determined at + 9°, and a dose-symmetric scheme was applied for all tilt series, ranging from -45° to +63° with an increment of 3°. A total of 37 projection images with 10 movie frames each were collected for each tilt series and the dose rate was set at 1.5 e/Å 2 /s with an exposure time of 2 s, resulting in a total dose of 111 e/Å 2 . The correlated double sampling (CDS) in super-resolution mode was applied and frames were saved in LZW compressed tif format with no gain normalization. A total of 26 tilt series were collected from 22 lamellae.
Show full methods section
Cell culture and vitrification CEM CD4+
T-cells (catalogue ARP-117, HIV reagents program) were cultured in DMEM (Gibco) supplemented with 10% FBS, 2 mM L-glutamine (Gibco) and 1% MEM non-essential amino acids (Gibco), at 37 °C and 5% CO 2 . CEM cells at 3 × 10 6 cells/ml after 10 passages were pelleted at 200 x g for 5 min at 20 °C and resuspended in PBS mixed with 10% glycerol. An aliquot of 3 µl cell suspension was applied to the glow-discharged holey carbon-coated copper (R 2/1, 200 mesh) (Quantifoil) and blotted for 9 seconds by Leica GP2 (Leica Microsystems), followed by plunge freezing in liquid ethane. Cryo-FIB milling Vitrified cells were further processed by cryo-FIB milling for the preparation of lamellae. A dual-beam microscope FIB/SEM Aquilos 2 (Thermo Fisher Scientific) equipped with a cryo-transfer system (Thermo Fisher Scientific) and rotatable cryo-stage cooled at −191 °C by an open nitrogen circuit was used to carry out the thinning. Prior to the milling, the grids were mounted on the shuttle and transferred onto the cryo-stage, followed by the coating with an organometallic Platinum layer using the GIS system (Thermo Fisher Scientific) for 5–6 s. Then, cells positioned approximately in the centres of grid squares were selected for thinning. The thinning was conducted by the automated milling software AutoTEM 5 (Thermo Fisher Scientific) in a stepwise manner from current 0.5 μA to 30 pA at 30 kV, and the final thickness of lamellae was set to 120 nm.
Cryo-ET data collection
Cellular lamellae were transferred to FEI Titan Krios G2 (Thermo Fisher Scientific) electron microscope operated at 300 kV and equipped with a Gatan BioQuantum energy filter and post-GIF K3 detector (Gatan, Pleasanton, CA). A 100 µm objective aperture was inserted. Areas that include nuclei were selected for the data acquisition. Tilt series were recorded using Tomography 5 software (Thermo Fisher Scientific) with a nominal magnification of 42k and a physical pixel size of 2.18 Å/pixel. All tilt series were collected with a zero-loss imaging filter with a 20 eV-wide slit. The defocus value was set from -3.5 to -5 µm. The pre-tilt of the lamellae was determined at + 9°, and a dose-symmetric scheme was applied for all tilt series, ranging from -45° to +63° with an increment of 3°. A total of 37 projection images with 10 movie frames each were collected for each tilt series and the dose rate was set at 1.5 e/Å 2 /s with an exposure time of 2 s, resulting in a total dose of 111 e/Å 2 . The correlated double sampling (CDS) in super-resolution mode was applied and frames were saved in LZW compressed tif format with no gain normalization. A total of 26 tilt series were collected from 22 lamellae.
Alignment of tilt series and tomogram reconstruction
The frames of each tilt series were corrected for beam-induced motion using MotionCor2 47 . The gain correction was performed in parallel with the motion correction run by a home-brewed script. New stacks were generated and aligned using IMOD 48 version 4.11 by patch tracking, and tomograms were reconstructed at bin6 with a pixel size of 13.08 Å/pixel. For visualisation and segmentation, reconstructed tomograms were corrected for missing wedge and denoised by IsoNet 49 version 0.2, applying default parameters. Template matching To localise individual nucleosomes in the tomogram, template matching was carried out using emClarity 50 version 1.5.0.2. To supress the template-induced bias, a featureless nucleosome template was generated by low-pass filtering the published structure EMD-26339 44 to 40 Å. A total number of 5 tomograms with low residual errors in the alignment were selected for template matching, and 10000 particles in total were extracted. In parallel, ribosomes were picked using the low-pass-filtered structure EMD-16196 51 , and 200 particles were extracted from each tomogram for the segmentation.
Subtomogram averaging
Prior to aligning the particles, CTF correction was performed for each tomogram by emClarity 50 version 1.5.3.10, and particles were checked by overlaying the reconstructed tomograms with corresponding picked particles in Chimera. Particles that lay outside the nucleus were then removed. The remaining particles were first aligned at bin6 and bin5 by emClarity version 1.5.3.10, followed by iterative reconstructions and alignments at lower binning (2–4) in RELION 52 version 4.0. To further clean up the particles, 3D classification was conducted at bin 6 in RELION 52 version 4.0, and 6,790 particles remained after the cleaning. The final resolution of the nucleosome was determined at 12.0 Å (0.143 cut-off). Using that structure as the reference, another round of 3D classification in RELION 52 was performed at bin6 with the number of classes set as 10. Class 1, 3, 4, 5, 6, 7, 8, and 9 showed prominent linker DNA densities while class 2 and 10 did not, thus particles from class 1, 3, 4, 5, 6, 7, 8, 9 were combined as one class (Class 1: 5,578 particles), particles from class 2 and 10 were combined as the other class (Class 2: 1,212 particles) (Supplementary Fig. 1c ). These two classes were then aligned iteratively, and the final resolution of class 1 was determined at 12.5 Å (gold-standard 0.143 cut-off) (Supplementary Fig. 1b , blue line) while class 2 was resolved at 15 Å (gold-standard 0.143 cut-off). Map fitting was performed in ChimeraX 53 , and the PDB 7DBP 54 and PDB 6ESF 55 were compared with class 1 and class 2, respectively.
Analysis of nucleosome population
The distance between adjacent nucleosomes was calculated according to the coordinates of their centres after the refinement. Paired nucleosomes with a centre-to-centre distance shorter than 60 Å were regarded as duplicates and removed. The angle between non-duplicate neighbouring nucleosomes was calculated using an in-house-developed script ( https://github.com/fnight128/MagpiEM ).
Segmentation and visualization
The segmentation was performed on IsoNet 49 -processed tomograms at bin6. The initial membrane detection and segmentation were done by TomoSegMemTV 56 , and the successive rendering was accomplished by ChimeraX 53 . Nucleosomes were mapped back according to their refined coordinates and orientations, using the subtomogram averaged nucleosome structure as the model. Ribosomes were mapped back to the tomogram as well, using a low-pass-filtered structure of EMD-16196 51 (80 S human ribosome structure) as the model. Positions and orientations of ribosomes were based on the outputs from template matching. Reporting summary Further information on research design is available in the Nature Portfolio Reporting Summary linked to this article.
Supplementary information Supplementary Information Peer Review File Description of Additional Supplementary Files Supplementary Movie 1 Supplementary Movie 2 Supplementary Movie 3 Reporting Summary
📊 Figures
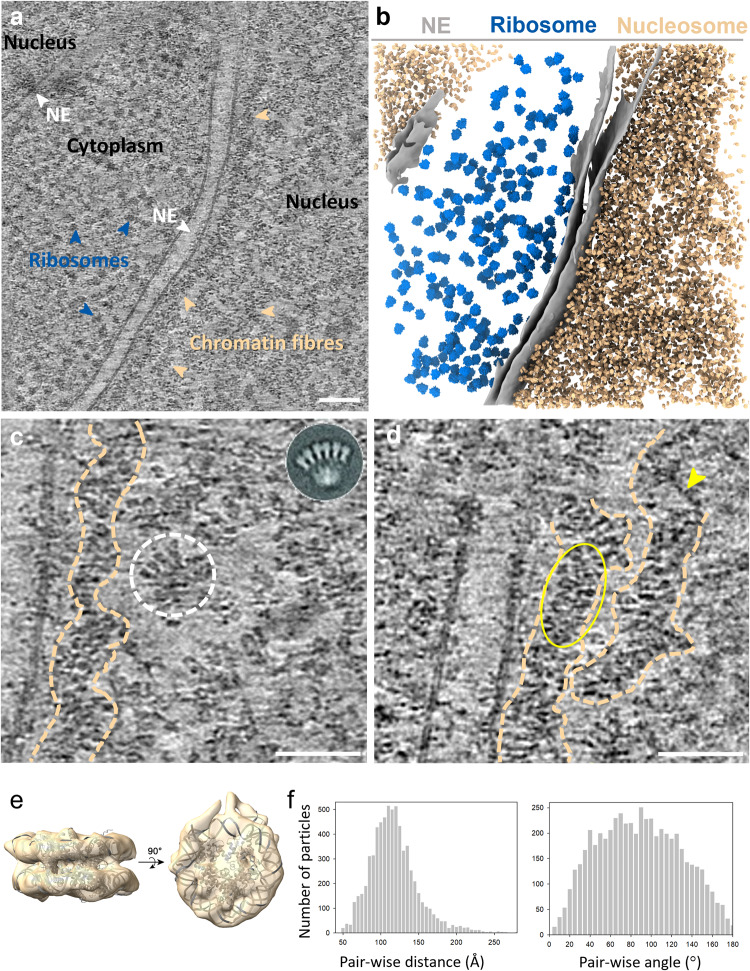
Fig. 1
Cryo-ET of native chromatin fibres and subtomogram average of nucleosomes.
a A representative tomographic slice of the CEM cell (from n =u20095). Scale bar = 100u2009nm. The tomogram is reconstructed with SIRT-like filtering in IMOD 4.11. The nucleus, chromatin fibres, nucle...
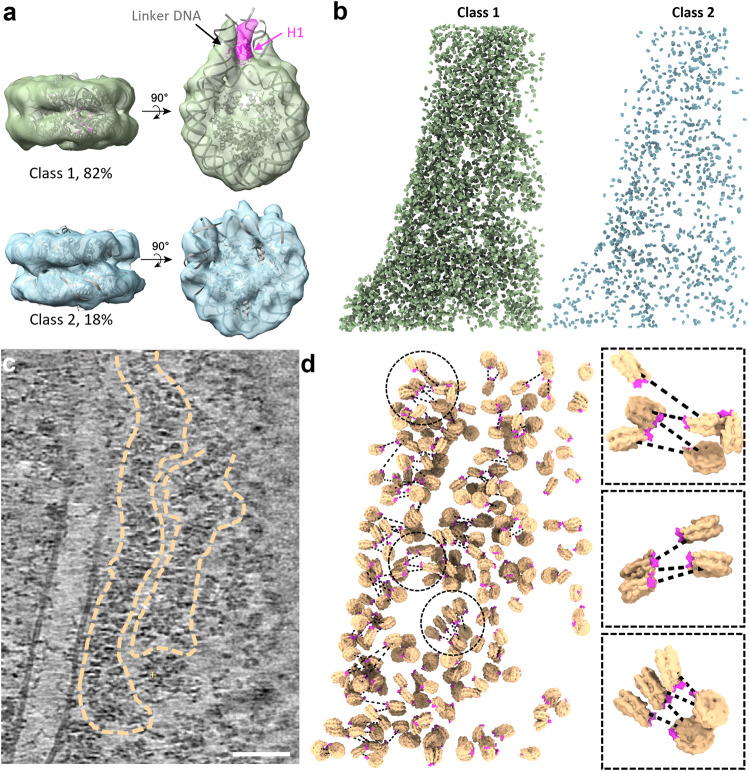
Fig. 2
3D Organization of nucleosomes in native chromatin fibres.
a Two distinct classes of native nucleosomes. Class 1 (top) (82% of the total population, n =u20095578) is fitted with the nucleosome crystal structure PDB 7DBP, with H1 density coloured in magenta. C...
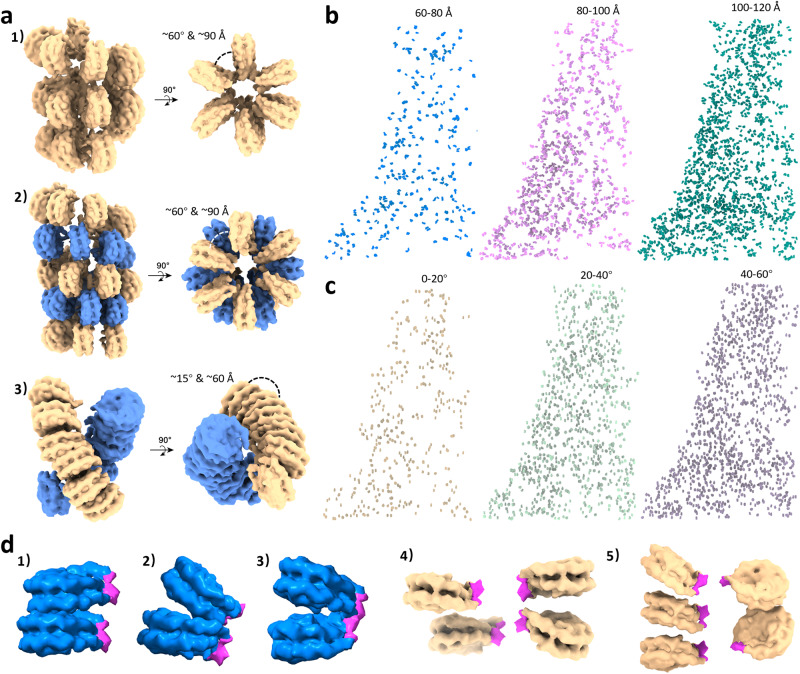
Fig. 3
Chromatin models and mapping of different subpopulations of the native nucleosome.
a Uniformed chromatin fibre models constructed based on previous works: (1) Ideal one-start solenoid model, (2) Ideal two-start twisted crossed-linker zigzag model, (3) EM-based compact two-start twis...
Figure images are served from the NIH/NLM PubMed Central Open Access Subset or Europe PMC; copyright remains with the publishers and authors.
💬 Discussion
0 commentsNo comments yet. Be the first to start a discussion!
Leave a Comment