Abstract
AbstractThe pyruvate dehydrogenase complex (PDHc) links glycolysis to the citric acid cycle by converting pyruvate into acetyl-coenzyme A. PDHc encompasses three enzymatically active subunits, namely pyruvate dehydrogenase, dihydrolipoyl transacetylase, and dihydrolipoyl dehydrogenase. Dihydrolipoyl transacetylase is a multidomain protein comprising a varying number of lipoyl domains, a peripheral subunit-binding domain, and a catalytic domain. It forms the structural core of the complex, provides binding sites for the other enzymes, and shuffles reaction intermediates between the active sites through covalently bound lipoyl domains. The molecular mechanism by which this shuttling occurs has remained elusive. Here, we report a cryo-EM reconstruction of the native E. coli dihydrolipoyl transacetylase core in a resting state. This structure provides molecular details of the assembly of the core and reveals how the lipoyl domains interact with the core at the active site.
🔬 Techniques
🧬 Organisms
💻 Software
🧪 Sample Preparation
🔬 Cell Lines
🏭 Microscope Brands
🧪 Reagent Suppliers
📷 Detectors
💻 Software Details
💾 Data Repositories
🏛️ Research Organizations (ROR)
Affiliated research institutions:
📋 Methods
Protein preparation
The pyruvate dehydrogenase complex was isolated from E. coli K12 cells in an attempt to isolate the multienzyme complex synthetizing ubiquinone. The E. coli K12 cells containing a genome FLAG tag on the UbiF gene (GenScript, Piscataway, NJ, USA) were cultured in the LEX bioreactor (Epiphyte3 Inc., Toronto, Canada) for 24 h at 37 °C in the M9 medium with 0.5% succinate as the sole carbon source, yielding approx. 3 g of cells per 1 l of cell culture. Wild-type E. coli K12 cells were grown similarly in a small-scale 1 l culture in M9 medium with 0.5% succinate in a 5 l Erlenmeyer flask for 24 h at 37 °C while shaking at 180 rpm. The cells were disrupted by sonication in the lysis buffer (45 ml of lysis buffer per 10 g of cells), containing 20 mM Hepes pH 7.5, 150 mM NaCl, complete EDTA-free protease inhibitor cocktail (Roche, Basel, Switzerland) with a pinch of lysozyme and DNAse (both from Sigma Aldrich, St. Louis, MO, USA) and the lysate was ultracentrifuged (150,000× g , 60 min, 4 °C). The supernatant was incubated for 1.5 h at 4 °C tumbling with the anti-FLAG affinity gel (50 μl slurry per 10 ml of lysate, Sigma Aldrich, St. Louis, MO, USA) equilibrated in the lysis buffer. The resin was sedimented by centrifugation (3000× g , 3 min, 4 °C), washed twice with 100 resin volumes of purification buffer, and eluted in two steps with a total of 2 resin volumes of lysis buffer without protease inhibitors supplemented with the 3× FLAG peptide (Sigma Aldrich, St. Louis, MO, USA) as follows. In each elution step, the resin was tumbled for 30 min at 4 °C in a sealed spin column, followed by centrifugation of the spin column (3000× g , 3 min, 4 °C). The eluted protein was pooled and concentrated on 100 kDa MWCO spin concentrators (10,000× g , 4 °C) to approx. 3 mg/ml (assuming the absorbance at 280 nm = 1 for a 1 mg/ml solution), and immediately used for cryo-EM grid preparation, or flash frozen in liquid nitrogen and stored at −80 °C for further use in the activity assay, silver-stained SDS-PAGE, and mass spectrometry analysis. The yield was about 10 μg of the pyruvate dehydrogenase complex per 1 l of cell culture.
Show full methods section
Protein preparation
The pyruvate dehydrogenase complex was isolated from E. coli K12 cells in an attempt to isolate the multienzyme complex synthetizing ubiquinone. The E. coli K12 cells containing a genome FLAG tag on the UbiF gene (GenScript, Piscataway, NJ, USA) were cultured in the LEX bioreactor (Epiphyte3 Inc., Toronto, Canada) for 24 h at 37 °C in the M9 medium with 0.5% succinate as the sole carbon source, yielding approx. 3 g of cells per 1 l of cell culture. Wild-type E. coli K12 cells were grown similarly in a small-scale 1 l culture in M9 medium with 0.5% succinate in a 5 l Erlenmeyer flask for 24 h at 37 °C while shaking at 180 rpm. The cells were disrupted by sonication in the lysis buffer (45 ml of lysis buffer per 10 g of cells), containing 20 mM Hepes pH 7.5, 150 mM NaCl, complete EDTA-free protease inhibitor cocktail (Roche, Basel, Switzerland) with a pinch of lysozyme and DNAse (both from Sigma Aldrich, St. Louis, MO, USA) and the lysate was ultracentrifuged (150,000× g , 60 min, 4 °C). The supernatant was incubated for 1.5 h at 4 °C tumbling with the anti-FLAG affinity gel (50 μl slurry per 10 ml of lysate, Sigma Aldrich, St. Louis, MO, USA) equilibrated in the lysis buffer. The resin was sedimented by centrifugation (3000× g , 3 min, 4 °C), washed twice with 100 resin volumes of purification buffer, and eluted in two steps with a total of 2 resin volumes of lysis buffer without protease inhibitors supplemented with the 3× FLAG peptide (Sigma Aldrich, St. Louis, MO, USA) as follows. In each elution step, the resin was tumbled for 30 min at 4 °C in a sealed spin column, followed by centrifugation of the spin column (3000× g , 3 min, 4 °C). The eluted protein was pooled and concentrated on 100 kDa MWCO spin concentrators (10,000× g , 4 °C) to approx. 3 mg/ml (assuming the absorbance at 280 nm = 1 for a 1 mg/ml solution), and immediately used for cryo-EM grid preparation, or flash frozen in liquid nitrogen and stored at −80 °C for further use in the activity assay, silver-stained SDS-PAGE, and mass spectrometry analysis. The yield was about 10 μg of the pyruvate dehydrogenase complex per 1 l of cell culture.
Protein sample characterization
Protein sample purity was analyzed by silver-stained SDS-PAGE on 4–12% Bis–Tris NuPAGE™ gel in NuPAGE™ MOPS SDS running buffer (200 V, 45 min; Thermo Fisher Scientific, Waltham, MA, USA). The molecular weight standard was PageRuler™ Plus Prestained Protein Ladder (4 μl; Thermo Fisher Scientific, Waltham, MA, USA) and 8 μg of the protein sample were loaded on the gel. The identity of the protein complex was verified by mass-spectrometry analysis (LC-Orbitrap MS/MS) at the Mass Spectrometry Based Proteomics Facility, Uppsala University using standard protocols. Briefly, 10 µg of the frozen purified protein sample were reduced, alkylated, in-solution trypsin-digested, purified by ZipTip ® (Sigma Aldrich, St. Louis, MO, USA) and dried. Dried peptides were resolved in 30 µl of 0.1% formic acid, 4× diluted, separated in reversed-phase on a C18-column, and electrosprayed online to a QExactive Plus Orbitrap mass spectrometer (Thermo Finnigan, Waltham, MA, USA) with 150 min gradient. Tandem mass spectrometry was performed applying HCD. Database searches were performed using the Sequest algorithm, embedded in Proteome Discoverer 1.4 (Thermo Fisher Scientific, Waltham, MA, USA) against the database of Escherichia coli strain K12 proteome extracted from Uniprot (release March 2020).
Activity assay
The pyruvate degydrogenase and α-ketoglutarate dehydrogenase complex activities were assayed based on a previously described method 11 . Briefly, 150 µl of assay buffer (5 mM pyruvate or α-ketoglutarate, 2.5 mM NAD, 0.2 mM thiamine pyrophosphate, 0.1 mM CoA, 0.3 mM dithiothreitol, 1 mM MgCl 2 , 150 mM NaCl, and 20 mM Hepes-NaOH pH 7.5) were added to a microcuvette. The reaction was started after 1 min of following NADH production at 340 nm when 30 µl of the enzyme complex at the concentration of 0.3 mg/ml in the sample buffer (20 mM Hepes pH 7.5, 150 mM NaCl) were added. The reaction was monitored for 3 min. Specific activity was determined based on the protein concentration (absorbance at 280 nm = 1 for a 1 mg/ml solution) and an NADH extinction coefficient of 6.22 mM −1 cm −1 . The specific activity is the average of two measurements.
Western blot analysis
For the immunoblot analysis, 2.5 µl of each fraction from the purification were boiled for 3 min in an equal volume of sample buffer (100 mM Tris·HCl pH 6.8, 4% SDS, 20% glycerol, 0.2% bromophenol blue, and 100 mM DTT added fresh) and run on a 16% polyacrylamide, 0.2% bisacrylamide gel (30 mA, 50 min) together with the PageRuler™ Prestained Protein Ladder, 10–180 kDa (Thermo Fisher Scientific, Waltham, MA, USA). Proteins were subsequently transferred to a nitrocellulose membrane (Amersham TM Protan ® Premium Western blotting membranes, GE Healthcare, Chicago, IL, USA; 100 mA, 90 min) and treated with anti-lipoate antibody (a kind gift from Dr. Luke Szweda) diluted 1:500 in 5% skim milk powder (Sigma Aldrich, St. Louis, MO, USA) in TBS for 16 h at 4 °C. The membranes were washed in TBS before the secondary antibody (horseradish peroxidase-conjugated goat anti-rabbit antibody; cat no. #1705046, Bio-Rad, Hercules, CA, USA) diluted 1:10,000 in 5% skim milk powder (Sigma Aldrich, St. Louis, MO, USA) in TBS was applied (1 h, 23 °C). After another TBS wash, the membranes were developed using enhanced chemiluminiscence substrate (WesternBright Quantum, Advansta, Menlo Park, CA, USA) and Fusion FX7 imaging system (Vilber, Collégien, France). Raw Western blot image and membrane preview are provided in the source data file. Mass spectrometry analysis of protein lipoylation Approx. 1 µg of purified PDHc was subjected to digestion using the SP3 method 85 . Acetonitrile was added to a final concentration of 50% and beads with captured proteins were washed twice with 70% ethanol. Ten microliters of trypsin/LysC digestion solution, containing 250 ng of trypsin (Sigma Aldrich, St. Louis, MO, USA) and 250 ng of LysC (Fujifilm Wako Chemicals USA, Richmond, VA, USA) in 100 mM Hepes, pH 8.5, were added and digestion was performed for 2 or 4 h. Generated peptides were washed twice with acetonitrile (200 µl) and peptides were eluted in 5% DMSO. The samples were acidified using formic acid to a final concentration of 2% and acetonitrile was added to a final concentration of 2%. The instrumentation consisted of a nano LC 1200 chromatographic system coupled via a nano-spray ionization source to an Exploris 480 mass spectrometer (Thermo Fisher Scientific, Waltham, MA, USA). For peptide separation a 75 µm inner diameter in-house packed column (PoroShell 2.8 µm, Agilent Technologies, Santa Clara, CA, USA) was utilized and a binary solvent-based gradient (Thermo Fisher Scientific, Waltham, MA, USA) was applied as follows. The buffer B (80% acetonitrile in 0.1% formic acid) content was increased linearly from 5 to 30% within 70 min and further ramped to 45% within 10 min. Then, buffer B content was increased to 95% in a linear manner within 5 min and held there further for 5 min. Prior injection of the next sample, the column was re-equilibrated using 8 µl of buffer A (0.1% formic acid). MS1 spectra were acquired using a resolution of 60,000 at 200 m / z . The mass spectrometer operated in a data-dependent mode targeting the Top12 most intense peaks for quadrupole isolation and MS/MS spectra acquisition. The isolation window was set to 1.2 Th and the AGC target was defined as 500% and the resolution was set to 30,000 at 200 m / z . Dynamic exclusion was set to 20 s. The transfer capillary temperature was set to 275 °C and the Funnel RF level was set to 55. Mass-spectrometry data analysis The MaxQuant software with the implemented Andromeda search engine 86 , 87 were used for the analysis of acquired MS/MS spectra. The Fasta file for the protein ( aceF gene from E. coli strain K12) was downloaded from the Uniprot database (accession code P06959 , April 2021). The following lipoylation modification states were defined: oxidized form, reduced form, 1× acetylated form, 2× alkylated (carbamidomethylated) form, and also the potential 1× acetylated/1× alkylated form. The minimal Andromeda score for a modification was 25 and a localization probability above 0.9. The “modificationSpecificPeptide” and the lipoylation site tables were used for visualization of the results. InstantClue was utilized for visualization of the data 88 .
Cryo-EM sample preparation and data collection
Quantifoil holey carbon grids (Quantifoil Micro Tools, Jena, Germany) were glow discharged (20 mA, 60 s, GloQube ® Plus Glow Discharge System, Quorum Technologies, Laughton, UK) and 3 μl of protein sample diluted in 20 mM Hepes pH 7.5, 150 mM NaCl were applied onto each grid using the Vitrobot blotting robot (FEI, Hillsboro, OR, USA) at 4 °C and 100% humidity with 15 s of sample equilibration time before blotting for 3 s with the blot force set to 0. Grids were clipped, stored in liquid nitrogen, and screened on a Talos Arctica microscope operating at 200 kV and equipped with a Falcon III direct electron detector (FEI, Hillsboro, OR, USA) at the Stockholm node of the Swedish National Cryo-EM facility (SciLifeLab, Stockholm, Sweden). Three data sets were acquired on a Titan Krios microscope (FEI, Hillsboro, OR, USA) operating at 300 kV and equipped with a K2 BioQuantum 4k × 4k direct electron detector (Gatan, Pleasaston, CA, USA) at the Umeå node of the Swedish National Cryo-EM facility (Umeå University, Umeå, Sweden), using similar data collection parameters (see Supplementary Table 2 ) and the EPU software version 2.7. For dataset 1, a Quantifoil R2/2 Cu 300 mesh holey carbon grid was used and the protein concentration was 0.6 mg/ml. For dataset 2, a Quantifoil R1.2/1.3 Cu 300 mesh holey carbon grid was used and the protein concentration was 1.4 mg/ml. For dataset 3, a Quantifoil R2/2 Cu 300 mesh holey carbon grid pre-coated with a 0.2 mg/ml suspension of graphene oxide (Sigma-Aldrich, St. Louis, MO, USA) after glow discharge (40 mA, 90 s, GloQube ® Plus Glow Discharge System, Quorum Technologies, Laughton, UK) and 2.5 μl of the protein sample at the concentration of 0.7 mg/ml were used.
Cryo-EM data processing and model building
All the data processing was carried out in cryoSPARC version 2.15 89 , 90 (Supplementary Figs. 4 and 5 ). A total of 20,133 movies were recorded, 3,708 in dataset 1, 3,558 in dataset 2, and 12,867 in dataset 3. A total of 799,790 particles were automatically template-picked from a total of 20,078 movies (the box size was 300 px), and after four rounds of particle filtering using 2D classification, 42,266 particles were selected for 3D classification and refinement. Heterogeneous 3D refinement (3D classification) was performed, where 12,832 particles were excluded, because they were lacking the lipoyl domains. The remaining 29,434 particles were included in the final 3D volume refinement with imposed O symmetry, which yielded the final map at 3.16 Å resolution, calculated based on the gold-standard Fourier shell correlation (FSC) of 0.143 91 (Supplementary Fig. 5 ). The E. coli pyruvate dehydrogenase complex E2p core model was built into the map using a combination of automated docking of the crystal structure of the E. coli E2p catalytic domain (PDB 4n72 37 ), and the NMR solution structure of the E. coli E2p innermost lipoyl domain (PDB 1qjo 39 ) using Phenix version 1.16 92 and manual building in Coot version 0.8.9.1 93 together with real space refinement in Phenix and CCPEM version 1.4.1 94 . The cryo-EM data collection, refinement, and validation statistics are listed in Supplementary Table 2 . The model coordinates and cryo-EM maps were deposited to the Protein Data Bank (accession code 7b9k) and to the Electron Microscopy Data Bank (accession code EMD-12104). For an additional analysis of the whole pyruvate dehydrogenase complex (Supplementary Fig. 4 ), a box size of 600 px was used for particle extraction, followed by particle down-sampling to a box size of 300 px. A total of 28,674 down-sampled particles were included in the 3D classification and refinement without any symmetry imposed. For the 2D classification of the outer shell of the pyruvate dehydrogenase complex, a mask covering the E2p core was used for particle subtraction and the subtracted particles (28,674) were 2D classified to visualize the E1p and/or E3 components. The quality of the final E2p model was evaluated using Phenix version 1.16 92 and the MolProbity server 95 , sequence alignments were made using the Clustal Omega server 96 , the Dali 97 and PISA 98 servers were used for structure analysis, and all structure and volume representation figures were created in the PyMOL Molecular Graphics System version 2.2.3 (Schrödinger, LLC) and UCSF Chimera version 1.13.1 99 , respectively. Reporting summary Further information on research design is available in the Nature Research Reporting Summary linked to this article.
Supplementary information Supplementary Information Peer Review File Reporting Summary
📊 Figures
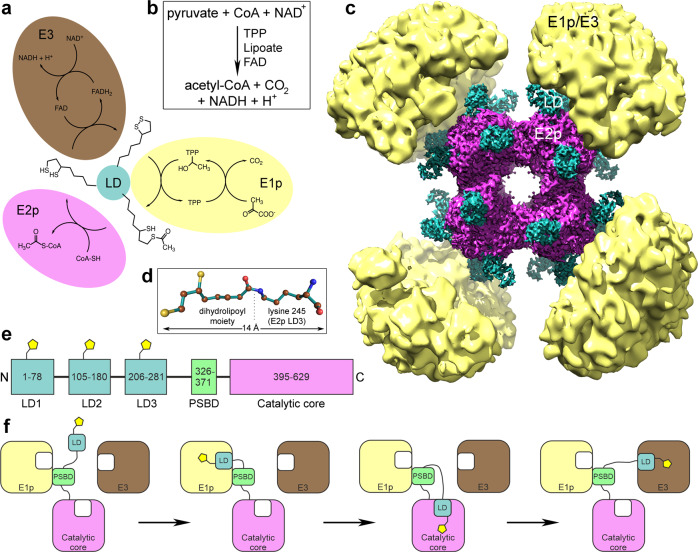
Fig. 1
Reaction mechanism and cryo-EM reconstruction of E. coli PDHc.
a Scheme of the reactions catalyzed by the individual components of PDHc. b Overall reaction catalyzed by PDHc. c High-resolution cryo-EM reconstruction of the inner E2p core in alignment with the low...
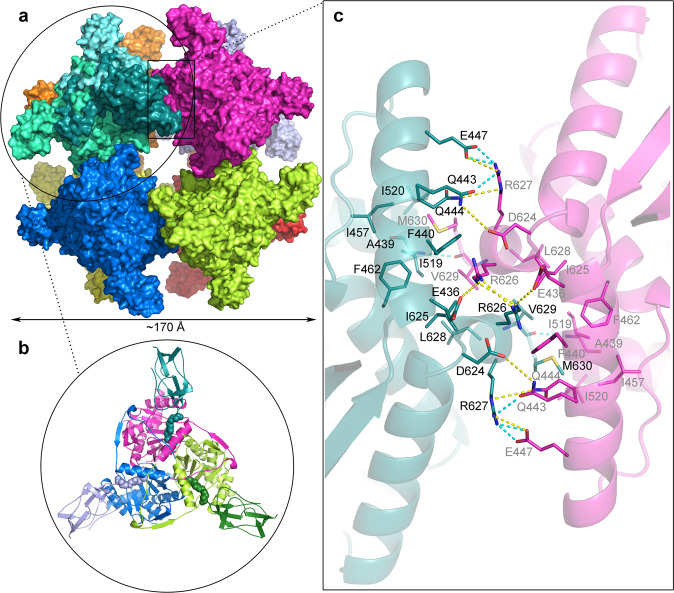
Fig. 2
Structure of the 24-mer of E. coli dihydrolipoyl transacetylase (E2p).
a Surface representation of the overall structure of the E2p cubic core with each E2p trimer shown in a different color; E2p monomers in the top left E2p trimer are shown in different shades of cyan. ...
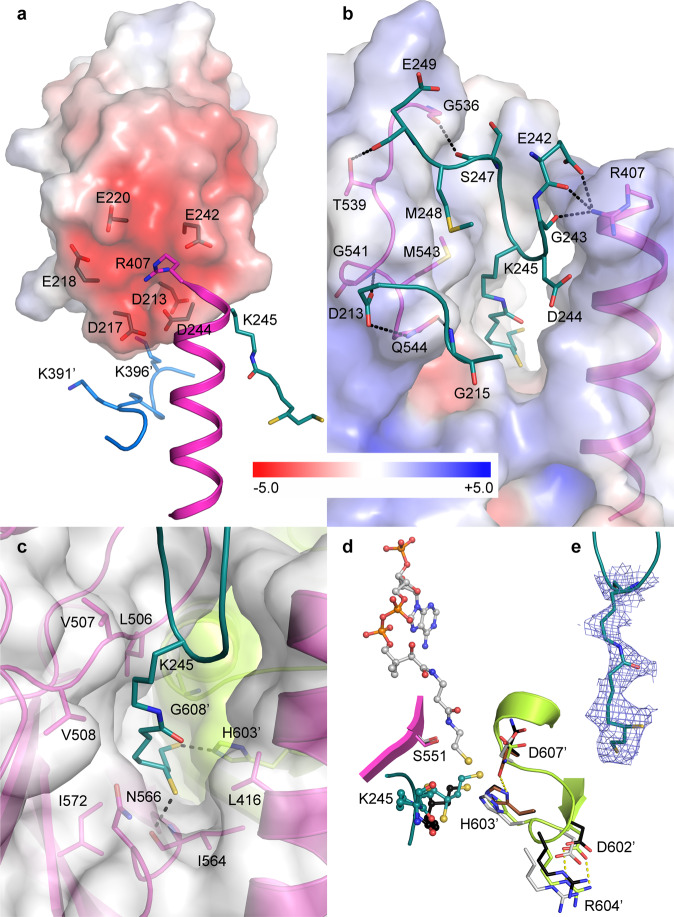
Fig. 3
Interaction of the lipoyl domain with the catalytic domain of E. coli dihydrolipoyl transacetylase.
The color code for the individual domains corresponds to Fig. 2b . a Acidic patch on the surface of lipoyl domain interacts with the positive dipole and an arginine residue in the N-terminal tip of th...
Figure images are served from the NIH/NLM PubMed Central Open Access Subset or Europe PMC; copyright remains with the publishers and authors.
💬 Discussion
0 commentsNo comments yet. Be the first to start a discussion!
Leave a Comment