Abstract
Numerous interventions are in clinical development for respiratory syncytial virus (RSV) infection, including small molecules that target viral transcription and replication. These processes are catalyzed by a complex comprising the RNA-dependent RNA polymerase (L) and the tetrameric phosphoprotein (P). RSV P recruits multiple proteins to the polymerase complex and, with the exception of its oligomerization domain, is thought to be intrinsically disordered. Despite their critical roles in RSV transcription and replication, structures of L and P have remained elusive. Here, we describe the 3.2-Å cryo-EM structure of RSV L bound to tetrameric P. The structure reveals a striking tentacular arrangement of P, with each of the four monomers adopting a distinct conformation. The structure also rationalizes inhibitor escape mutants and mutations observed in live-attenuated vaccine candidates. These results provide a framework for determining the molecular underpinnings of RSV replication and transcription and should facilitate the design of effective RSV inhibitors.
🔬 Techniques
🔭 Microscopes
🧬 Organisms
💻 Software
✨ Fluorophores
🧪 Sample Preparation
🔬 Cell Lines
🏭 Microscope Brands
🧪 Reagent Suppliers
💻 Software Details
💾 Data Repositories
🏛️ Research Organizations (ROR)
Affiliated research institutions:
📋 Methods
Key Resources Table REAGENT or RESOURCE SOURCE IDENTIFIER
Bacterial and Virus Strains
E. coli DH10Bac ThermoFisher Scientific Cat#10361012 Chemicals, Peptides, and Recombinant Proteins Recombinant Human RSV L-P protein This study N/A 33 P CTP ARC Cat: ARP 0154-1 mCi 3 H-SAM Perkin-Elmer Adenosyl-L-methionine, S-[methyl- 3 H]-. NET155H001MC Scintillation fluid Perkin-Elmer BETAPLATE SCINT.
Cat#1205-440 DEAE filtermats Perkin-Elmer Cat#1450-522 Deposited Data
Cryo-EM map of RSV L–P complex
This study EMDB: EMD-20536 Coordinates for RSV L–P complex structure This study PDB ID: 6PZK Experimental Models: Cell Lines Spodoptera frugiperda (Sf9) Thermofisher Scientific CAT # 11496015 BSRT7/5 Dr KK Conzelmann, Department of Clinical Virology, Federal Research Center for Virus Diseases of Animals, D-72076 Tübingen, Germany. Buchholz et al., 1999 . Oligonucleotides 5′-pACGC Deval et al., 2016 https://journals.plos.org/plosone/article?id=10.1371/journal.pone.0154097 5′-UUUGUUCGCGU Deval et al., 2016 https://journals.plos.org/plosone/article?id=10.1371/journal.pone.0154097 5′-biotin-ACGC Deval et al., 2016 https://journals.plos.org/plosone/article?id=10.1371/journal.pone.0154097 5′-Gppp GGG AC (RSV5), 5′-Gppp GGG ACA AAA (RSV9), 5′-Gppp GGG ACA AAA UGG AUC (RSV15) Dr. Françoise DEBART and Dr. J-Jacques VASSEUR. IBMM, CNRS, Université Montpellier, ENSCM, Campus Triolet, Montpellier, France Paesen et al., 2015 Recombinant DNA pFastbac Dual Thermofisher Scientific CAT#10712024 pFastbac Dual L-P This Study N/A pMT/Luc Minigenome Dr J.-F. Eléouët, VIM, INRA, 78350 Jouy en Josas, France Tran et al., 2009 Software and Algorithms cryoSPARC v2 Punjani et al., 2017 https://cryosparc.com/ Chimera Pettersen et al., 2004 https://www.cgl.ucsf.edu/chimera/ COOT Emsley and Cowtan, 2004 https://www2.mrc-lmb.cam.ac.uk/personal/pemsley/coot/ Phenix Adams et al., 2002 , Afonine et al., 2018 https://www.phenix-online.org/ ISOLDE Croll, 2018 https://isolde.cimr.cam.ac.uk/what-isolde/ ChimeraX Goddard et al., 2018 https://www.rbvi.ucsf.edu/chimerax/ ImageQuant TL v8.1 GE Healthcare Life Sciences http://www.gelifesciences.com/en/us Other Streptavidin Flashplate Perkin Elmer Cat#SMP103A001PK Strep-Tactin Superflow Plus Cartridge QIAGEN Cat#30060 HiTrap Heparin HP GE Healthcare Cat#17-0406-01 Superose 6 Increase GE Healthcare Cat#29091596 Measuring luciferase Tecan, Männedorf, Switzerland Infinite 200 Pro microplate reader Generation of P mutants Stratagene Quikchange site-directed mutagenesis kit Lead Contact and Materials Availability Further information and requests for materials should be directed to and will be fulfilled by lead contact Jason S. McLellan ( jmclellan@austin.utexas.edu ). Method Details Protein production and purification Human RSV L protein (strain A2) with an N-terminal dual StrepTag and RSV P protein (strain A2) with a C-terminal 6x His-tag were co-expressed in Sf9 insect cells using pFASTbac Dual transfer vector (Life Technologies). The Sf9 cells expressing the L–P polymerase complex were lysed by two passes through a microfluidizer in Strep Buffer A (50 mM Tris-HCl, 300 mM NaCl, 10% glycerol, and 1 mM Tris (2-carboxyethyl) phosphine (TCEP), pH 8.0) supplemented with Complete EDTA-free Protease Inhibitor Cocktail (Roche) and 1 U/mL Benzonase (EMD Millipore). After clarification by high-speed centrifugation, the cell lysate was loaded onto a Strep-Tactin column (QIAGEN), and the bound protein was eluted using 10 mM desthiobiotin in Strep Buffer A. The eluted L–P complex was pooled and diluted with an equal volume of heparin buffer A (50 mM Tris-HCl, 10% glycerol, and 1 mM TCEP, pH 8.0), and was further purified using a heparin column (GE Healthcare). The L–P complex was eluted from the heparin column using a NaCl gradient to a final concentration of 500 mM. The protein was concentrated with an Amicon Ultra centrifugal filter, then loaded on to a size-exclusion column (Superpose 6 Increase 10/300, GE healthcare) equilibrated in 50 mM Tris-HCl, 500 mM NaCl, 10% glycerol, and 1 mM TCEP, pH 8.0. The fractions near the maximum height of the peak were combined, flash-frozen, and stored at −80°C.
Show full methods section
Key Resources Table REAGENT or RESOURCE SOURCE IDENTIFIER
Bacterial and Virus Strains
E. coli DH10Bac ThermoFisher Scientific Cat#10361012 Chemicals, Peptides, and Recombinant Proteins Recombinant Human RSV L-P protein This study N/A 33 P CTP ARC Cat: ARP 0154-1 mCi 3 H-SAM Perkin-Elmer Adenosyl-L-methionine, S-[methyl- 3 H]-. NET155H001MC Scintillation fluid Perkin-Elmer BETAPLATE SCINT.
Cat#1205-440 DEAE filtermats Perkin-Elmer Cat#1450-522 Deposited Data
Cryo-EM map of RSV L–P complex
This study EMDB: EMD-20536 Coordinates for RSV L–P complex structure This study PDB ID: 6PZK Experimental Models: Cell Lines Spodoptera frugiperda (Sf9) Thermofisher Scientific CAT # 11496015 BSRT7/5 Dr KK Conzelmann, Department of Clinical Virology, Federal Research Center for Virus Diseases of Animals, D-72076 Tübingen, Germany. Buchholz et al., 1999 . Oligonucleotides 5′-pACGC Deval et al., 2016 https://journals.plos.org/plosone/article?id=10.1371/journal.pone.0154097 5′-UUUGUUCGCGU Deval et al., 2016 https://journals.plos.org/plosone/article?id=10.1371/journal.pone.0154097 5′-biotin-ACGC Deval et al., 2016 https://journals.plos.org/plosone/article?id=10.1371/journal.pone.0154097 5′-Gppp GGG AC (RSV5), 5′-Gppp GGG ACA AAA (RSV9), 5′-Gppp GGG ACA AAA UGG AUC (RSV15) Dr. Françoise DEBART and Dr. J-Jacques VASSEUR. IBMM, CNRS, Université Montpellier, ENSCM, Campus Triolet, Montpellier, France Paesen et al., 2015 Recombinant DNA pFastbac Dual Thermofisher Scientific CAT#10712024 pFastbac Dual L-P This Study N/A pMT/Luc Minigenome Dr J.-F. Eléouët, VIM, INRA, 78350 Jouy en Josas, France Tran et al., 2009 Software and Algorithms cryoSPARC v2 Punjani et al., 2017 https://cryosparc.com/ Chimera Pettersen et al., 2004 https://www.cgl.ucsf.edu/chimera/ COOT Emsley and Cowtan, 2004 https://www2.mrc-lmb.cam.ac.uk/personal/pemsley/coot/ Phenix Adams et al., 2002 , Afonine et al., 2018 https://www.phenix-online.org/ ISOLDE Croll, 2018 https://isolde.cimr.cam.ac.uk/what-isolde/ ChimeraX Goddard et al., 2018 https://www.rbvi.ucsf.edu/chimerax/ ImageQuant TL v8.1 GE Healthcare Life Sciences http://www.gelifesciences.com/en/us Other Streptavidin Flashplate Perkin Elmer Cat#SMP103A001PK Strep-Tactin Superflow Plus Cartridge QIAGEN Cat#30060 HiTrap Heparin HP GE Healthcare Cat#17-0406-01 Superose 6 Increase GE Healthcare Cat#29091596 Measuring luciferase Tecan, Männedorf, Switzerland Infinite 200 Pro microplate reader Generation of P mutants Stratagene Quikchange site-directed mutagenesis kit Lead Contact and Materials Availability Further information and requests for materials should be directed to and will be fulfilled by lead contact Jason S. McLellan ( jmclellan@austin.utexas.edu ). Method Details Protein production and purification Human RSV L protein (strain A2) with an N-terminal dual StrepTag and RSV P protein (strain A2) with a C-terminal 6x His-tag were co-expressed in Sf9 insect cells using pFASTbac Dual transfer vector (Life Technologies). The Sf9 cells expressing the L–P polymerase complex were lysed by two passes through a microfluidizer in Strep Buffer A (50 mM Tris-HCl, 300 mM NaCl, 10% glycerol, and 1 mM Tris (2-carboxyethyl) phosphine (TCEP), pH 8.0) supplemented with Complete EDTA-free Protease Inhibitor Cocktail (Roche) and 1 U/mL Benzonase (EMD Millipore). After clarification by high-speed centrifugation, the cell lysate was loaded onto a Strep-Tactin column (QIAGEN), and the bound protein was eluted using 10 mM desthiobiotin in Strep Buffer A. The eluted L–P complex was pooled and diluted with an equal volume of heparin buffer A (50 mM Tris-HCl, 10% glycerol, and 1 mM TCEP, pH 8.0), and was further purified using a heparin column (GE Healthcare). The L–P complex was eluted from the heparin column using a NaCl gradient to a final concentration of 500 mM. The protein was concentrated with an Amicon Ultra centrifugal filter, then loaded on to a size-exclusion column (Superpose 6 Increase 10/300, GE healthcare) equilibrated in 50 mM Tris-HCl, 500 mM NaCl, 10% glycerol, and 1 mM TCEP, pH 8.0. The fractions near the maximum height of the peak were combined, flash-frozen, and stored at −80°C.
Primer-extension assay
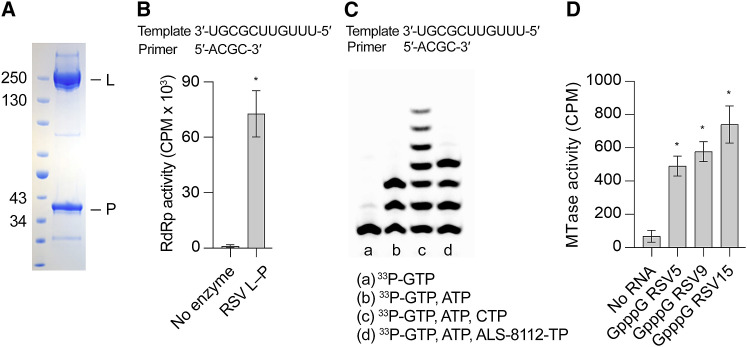
Primer-extension reactions contained 10 nM RSV L–P complex, incubated with 200 nM RNA (5′-UUUGUUCGCGU) and 4 μM 5′ biotin-labeled RNA primer (5′-biotin-pACGC) mixed in a buffer containing 20 mM Tris-HCl pH 7.5, 10 mM KCl, 6 mM MgCl 2 , 10% dimethyl sulfoxide (DMSO), 2 mM dithiothreitol (DTT), 10 μM GTP, 10 μM ATP, and 25 nM α 33 P-CTP. Each 10 μL reaction was incubated at 30°C for 2 hours and quenched with the addition of 0.1 M EDTA. Quenched reactions were transferred to a Flashplate (Perkin Elmer SMP103A001PK) and incubated for 1 hour at room temperature. The quenched reactions were then washed two times with 0.1% Tween-20, aspirated and read on a Microbeta Trilux (Perkin Elmer).
Nucleotide-incorporation assay
Each reaction contained 0.2 μM recombinant RSV L–P, 0.2 μM of an oligonucleotide template sequence derived from the RSV leader promoter (5′ UUUGUUCGCGU 3′) and 400 μM 5′-pACGC primer, mixed in a buffer containing 20 mM Tris-HCl pH 7.5, 10 mM KCl, 2 mM DTT, 0.01% Triton X-100, 10% DMSO, 0.2 U/μL RNasin (Ambion), and 6 mM MgCl 2 . Reactions were started by adding 100 nM α 33 P-GTP tracer with specific NTPs as described in the figure legend to a final volume of 10 μL, and incubated for 30 minutes at 30°C. Reactions were quenched by adding an equal volume of gel-loading buffer (Ambion). Samples were denatured at 95°C for 5 minutes and run on a 22.5% polyacrylamide urea sequencing gel for 1.5 hours at 80 W. The gel was dried, exposed to a phosphor screen, scanned on a Typhoon phosphorimager (GE Healthcare), and quantified using ImageQuant (GE Healthcare).
MTase activity assay
The methyltransferase activity was measured using a filter-binding assay, performed according to the method described previously ( Paesen et al., 2015 ). A 50 nM solution of RSV L–P complex was incubated with 1.8 μM purified synthetic RNA, 0.17 μM S-adenosyl methionine (SAM) and 0.8 μM 3 H-SAM (Perkin Elmer) in 50 mM Tris-HCl pH 8.0. After 3 h incubation at 30°C, reactions were quenched by a 20-fold dilution in cold water. Samples were transferred to DEAE filtermats (Perkin Elmer) using a Filtermat Harvester (Packard Instruments). The RNA-retaining mats were washed twice with 10 mM ammonium formate pH 8.0, twice with water and once with ethanol. They were then soaked with scintillation fluid (Perkin Elmer), and 3 H-methyl transfer to the RNA substrates was determined using a Wallac MicroBeta TriLux Liquid Scintillation Counter (Perkin Elmer).
RNA synthesis
RNAs were chemically synthesized on a solid support using the method described previously ( Paesen et al., 2015 ). After RNA elongation with 2′ O -pivaloyloxymethyl phosphoramidite monomers (Chemgenes, USA), the 5′-hydroxyl group was phosphorylated and the resulting H -phosphonate derivative was oxidized and activated into a phosphoroimidazolidate derivative to react with pyrophosphate (pppRNA) or guanosine diphosphate (GpppRNA). After deprotection and release from the solid support, RNA molecules were purified by IEX-HPLC (> 95% pure) and their identity was confirmed by MALDI-TOF (Matrix-Assisted Laser Desorption/Ionization Time-of-Flight) spectrometry.
Cryo-EM data collection
A cryo-EM dataset of the RSV L–P complex was collected on a Titan Krios operating at 300kV and equipped with a K2 Summit detector. An initial dataset was collected on samples frozen in 1.2/1.3 holey carbon grids, but the resolution was limited to 3.7 Å. In an effort to improve the resolution, a second dataset was collected using UltrAuFoil 1.2/1.3 grids ( Russo and Passmore, 2014 ). UltrAuFoil 1.2/1.3 grids (Electron Microscopy Sciences) were plasma cleaned for 30 s using a Gatan Solarus 950 with a 4:1 O 2 :H 2 ratio. A 0.57 mg/mL solution of L–P complex in 50 mM Tris-HCl pH 8.0, 500 mM NaCl, 1 mM TCEP and 10% glycerol was diluted with an equal volume of 20 mM Tris-HCl pH 8.0, 200 mM NaCl immediately before 3 μL was deposited onto grids and plunge-frozen in liquid ethane using a Vitrobot Mark IV (Thermo Scientific) set to 100% humidity and 4°C, with a wait time of 0.5 s, a blot time of 4 s and a blot force of 1. Data were collected at 22,500x magnification, corresponding to a calibrated pixel size of 1.075 Å. A total of 30 frames were collected for each micrograph, with defocus values ranging from −1.5 μm to −2.5 μm, a total exposure time of 9 s, and a total electron dose of ∼48 e − /Å 2 .
Cryo-EM data processing
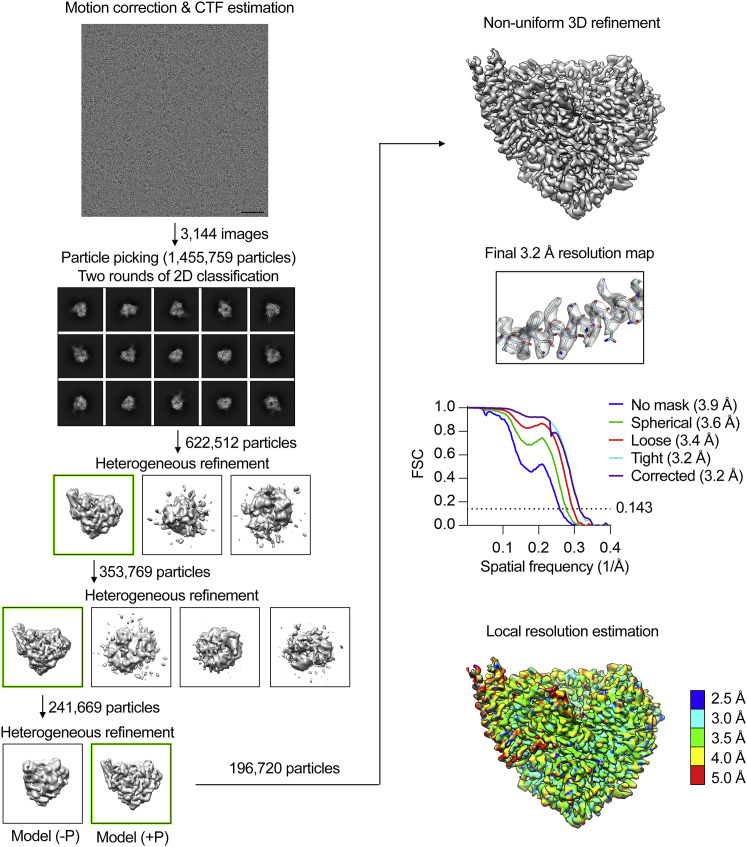
Motion correction, CTF estimation, template-based picking, 2D classification, heterogeneous 3D refinement, local motion correction, homogeneous 3D refinement, and non-uniform 3D refinement were performed in cryoSPARC v2 ( Punjani et al., 2017 , Rohou and Grigorieff, 2015 , Rubinstein and Brubaker, 2015 , Vilas et al., 2018 ). After motion correction and CTF estimation, a total of 3,144 micrographs were selected for subsequent processing. Template-based picking identified 1,455,759 particles, which was reduced to 622,521 particles after 2D classification and 241,669 particles after two iterative rounds of heterogeneous 3D refinement. Local motion correction was performed on the final particle stack ( Rubinstein and Brubaker, 2015 ), followed by homogeneous 3D refinement, which resulted in a 3.4 Å map. Upon initial building of the L protein model and docking of the closely related hMPV P oligomerization domain structure in our map, it was possible to identify the portions of the map that corresponded to the P protein monomers. We then generated a map in which these regions were deleted using Chimera ( Pettersen et al., 2004 ). This map, as well as the unmodified map, were low-pass filtered and used as input volumes for a final round of heterogenous 3D refinement to remove particles in which the tetrameric P protein had dissociated. The resulting stack of 196,720 particles was subjected to homogeneous non-uniform 3D refinement that yielded the final 3.2 Å map. The VSV L structure was used to guide manual building of RSV L ( Liang et al., 2015 ). The map clearly revealed a coiled-coil tetramerization domain, which allowed placement of the hMPV P protein oligomerization domain into our map ( Leyrat et al., 2013 ). The sharpened map was used for the majority of model building, with the exception of the C-terminal portions of two P monomers, which were built using both the sharpened and unsharpened maps. The region N-terminal to the RdRp Motif A that connects the palm and finger subdomains could not be accurately built in our model, but additional volume likely corresponding to residues ∼665–672 of RSV L was visible in the map. This region is predicted to contain a small α-helix that is visible in the related VSV structure. Manual model building was carried out using Coot ( Emsley and Cowtan, 2004 ) and refinement of the coordinates was performed using Phenix ( Adams et al., 2002 , Afonine et al., 2018 ). Additional model optimization was performed using ISOLDE ( Croll, 2018 ), accessed through ChimeraX ( Goddard et al., 2018 ).
Minigenome assay
Plasmids for eukaryotic expression of the hRSV N, P, M2-1, and L proteins designated pN, pP, pM2-1 and pL, have been described previously ( Fix et al., 2011 , Tran et al., 2007 ). The pM/Luc subgenomic minigenome, which encodes the firefly luciferase (Luc) reporter gene under the control of the M/SH gene start sequence, was derived from the pM/SH subgenomic replicon ( Hardy and Wertz, 1998 ) and has been described previously ( Tran et al., 2009 ). Point mutations were introduced in pP by site-directed mutagenesis, using the Quikchange site-directed mutagenesis kit (Stratagene). Sequence analysis was carried out to check the integrity of all the constructs. Cells at 90% confluence in 48-well dishes were transfected with a plasmid mixture containing 125 ng of pM/Luc, 125 ng of pN, 125 ng of pP, 62.5 ng of pL, and 31 ng of pM2-1, as well as 31 ng of pRSV-β-Gal (Promega) to normalize transfection efficiencies ( Tran et al., 2009 ). Transfections were done in triplicate, and each independent transfection was performed three times. Cells were harvested 24 h post-transfection, then lysed in luciferase lysis buffer (30 mM Tris-HCl pH 7.9, 10 mM MgCl 2 , 1 mM DTT, 1% Triton X-100, and 15% glycerol). The luciferase activities were determined for each cell lysate with an Infinite 200 Pro (Tecan, Männedorf, Switzerland) and normalized based on β-galactosidase (β-Gal) expression. Data and Code Availability Data Resources Atomic coordinates for the RSV L–P complex structure have been deposited in the Protein Data Bank and assigned PDB: 6PZK . Cryo-EM maps have been deposited in the EMDB and assigned code EMD-20536.
Lead Contact and Materials Availability
Further information and requests for materials should be directed to and will be fulfilled by lead contact Jason S. McLellan ( jmclellan@austin.utexas.edu ).
Method Details Protein production and purification Human RSV L protein (strain A2) with an N-terminal dual StrepTag and RSV P protein (strain A2) with a C-terminal 6x His-tag were co-expressed in Sf9 insect cells using pFASTbac Dual transfer vector (Life Technologies). The Sf9 cells expressing the L–P polymerase complex were lysed by two passes through a microfluidizer in Strep Buffer A (50 mM Tris-HCl, 300 mM NaCl, 10% glycerol, and 1 mM Tris (2-carboxyethyl) phosphine (TCEP), pH 8.0) supplemented with Complete EDTA-free Protease Inhibitor Cocktail (Roche) and 1 U/mL Benzonase (EMD Millipore). After clarification by high-speed centrifugation, the cell lysate was loaded onto a Strep-Tactin column (QIAGEN), and the bound protein was eluted using 10 mM desthiobiotin in Strep Buffer A. The eluted L–P complex was pooled and diluted with an equal volume of heparin buffer A (50 mM Tris-HCl, 10% glycerol, and 1 mM TCEP, pH 8.0), and was further purified using a heparin column (GE Healthcare). The L–P complex was eluted from the heparin column using a NaCl gradient to a final concentration of 500 mM. The protein was concentrated with an Amicon Ultra centrifugal filter, then loaded on to a size-exclusion column (Superpose 6 Increase 10/300, GE healthcare) equilibrated in 50 mM Tris-HCl, 500 mM NaCl, 10% glycerol, and 1 mM TCEP, pH 8.0. The fractions near the maximum height of the peak were combined, flash-frozen, and stored at −80°C.
Primer-extension assay
Primer-extension reactions contained 10 nM RSV L–P complex, incubated with 200 nM RNA (5′-UUUGUUCGCGU) and 4 μM 5′ biotin-labeled RNA primer (5′-biotin-pACGC) mixed in a buffer containing 20 mM Tris-HCl pH 7.5, 10 mM KCl, 6 mM MgCl 2 , 10% dimethyl sulfoxide (DMSO), 2 mM dithiothreitol (DTT), 10 μM GTP, 10 μM ATP, and 25 nM α 33 P-CTP. Each 10 μL reaction was incubated at 30°C for 2 hours and quenched with the addition of 0.1 M EDTA. Quenched reactions were transferred to a Flashplate (Perkin Elmer SMP103A001PK) and incubated for 1 hour at room temperature. The quenched reactions were then washed two times with 0.1% Tween-20, aspirated and read on a Microbeta Trilux (Perkin Elmer).
Nucleotide-incorporation assay
Each reaction contained 0.2 μM recombinant RSV L–P, 0.2 μM of an oligonucleotide template sequence derived from the RSV leader promoter (5′ UUUGUUCGCGU 3′) and 400 μM 5′-pACGC primer, mixed in a buffer containing 20 mM Tris-HCl pH 7.5, 10 mM KCl, 2 mM DTT, 0.01% Triton X-100, 10% DMSO, 0.2 U/μL RNasin (Ambion), and 6 mM MgCl 2 . Reactions were started by adding 100 nM α 33 P-GTP tracer with specific NTPs as described in the figure legend to a final volume of 10 μL, and incubated for 30 minutes at 30°C. Reactions were quenched by adding an equal volume of gel-loading buffer (Ambion). Samples were denatured at 95°C for 5 minutes and run on a 22.5% polyacrylamide urea sequencing gel for 1.5 hours at 80 W. The gel was dried, exposed to a phosphor screen, scanned on a Typhoon phosphorimager (GE Healthcare), and quantified using ImageQuant (GE Healthcare).
MTase activity assay
The methyltransferase activity was measured using a filter-binding assay, performed according to the method described previously ( Paesen et al., 2015 ). A 50 nM solution of RSV L–P complex was incubated with 1.8 μM purified synthetic RNA, 0.17 μM S-adenosyl methionine (SAM) and 0.8 μM 3 H-SAM (Perkin Elmer) in 50 mM Tris-HCl pH 8.0. After 3 h incubation at 30°C, reactions were quenched by a 20-fold dilution in cold water. Samples were transferred to DEAE filtermats (Perkin Elmer) using a Filtermat Harvester (Packard Instruments). The RNA-retaining mats were washed twice with 10 mM ammonium formate pH 8.0, twice with water and once with ethanol. They were then soaked with scintillation fluid (Perkin Elmer), and 3 H-methyl transfer to the RNA substrates was determined using a Wallac MicroBeta TriLux Liquid Scintillation Counter (Perkin Elmer).
RNA synthesis
RNAs were chemically synthesized on a solid support using the method described previously ( Paesen et al., 2015 ). After RNA elongation with 2′ O -pivaloyloxymethyl phosphoramidite monomers (Chemgenes, USA), the 5′-hydroxyl group was phosphorylated and the resulting H -phosphonate derivative was oxidized and activated into a phosphoroimidazolidate derivative to react with pyrophosphate (pppRNA) or guanosine diphosphate (GpppRNA). After deprotection and release from the solid support, RNA molecules were purified by IEX-HPLC (> 95% pure) and their identity was confirmed by MALDI-TOF (Matrix-Assisted Laser Desorption/Ionization Time-of-Flight) spectrometry.
Cryo-EM data collection
A cryo-EM dataset of the RSV L–P complex was collected on a Titan Krios operating at 300kV and equipped with a K2 Summit detector. An initial dataset was collected on samples frozen in 1.2/1.3 holey carbon grids, but the resolution was limited to 3.7 Å. In an effort to improve the resolution, a second dataset was collected using UltrAuFoil 1.2/1.3 grids ( Russo and Passmore, 2014 ). UltrAuFoil 1.2/1.3 grids (Electron Microscopy Sciences) were plasma cleaned for 30 s using a Gatan Solarus 950 with a 4:1 O 2 :H 2 ratio. A 0.57 mg/mL solution of L–P complex in 50 mM Tris-HCl pH 8.0, 500 mM NaCl, 1 mM TCEP and 10% glycerol was diluted with an equal volume of 20 mM Tris-HCl pH 8.0, 200 mM NaCl immediately before 3 μL was deposited onto grids and plunge-frozen in liquid ethane using a Vitrobot Mark IV (Thermo Scientific) set to 100% humidity and 4°C, with a wait time of 0.5 s, a blot time of 4 s and a blot force of 1. Data were collected at 22,500x magnification, corresponding to a calibrated pixel size of 1.075 Å. A total of 30 frames were collected for each micrograph, with defocus values ranging from −1.5 μm to −2.5 μm, a total exposure time of 9 s, and a total electron dose of ∼48 e − /Å 2 .
Cryo-EM data processing
Motion correction, CTF estimation, template-based picking, 2D classification, heterogeneous 3D refinement, local motion correction, homogeneous 3D refinement, and non-uniform 3D refinement were performed in cryoSPARC v2 ( Punjani et al., 2017 , Rohou and Grigorieff, 2015 , Rubinstein and Brubaker, 2015 , Vilas et al., 2018 ). After motion correction and CTF estimation, a total of 3,144 micrographs were selected for subsequent processing. Template-based picking identified 1,455,759 particles, which was reduced to 622,521 particles after 2D classification and 241,669 particles after two iterative rounds of heterogeneous 3D refinement. Local motion correction was performed on the final particle stack ( Rubinstein and Brubaker, 2015 ), followed by homogeneous 3D refinement, which resulted in a 3.4 Å map. Upon initial building of the L protein model and docking of the closely related hMPV P oligomerization domain structure in our map, it was possible to identify the portions of the map that corresponded to the P protein monomers. We then generated a map in which these regions were deleted using Chimera ( Pettersen et al., 2004 ). This map, as well as the unmodified map, were low-pass filtered and used as input volumes for a final round of heterogenous 3D refinement to remove particles in which the tetrameric P protein had dissociated. The resulting stack of 196,720 particles was subjected to homogeneous non-uniform 3D refinement that yielded the final 3.2 Å map. The VSV L structure was used to guide manual building of RSV L ( Liang et al., 2015 ). The map clearly revealed a coiled-coil tetramerization domain, which allowed placement of the hMPV P protein oligomerization domain into our map ( Leyrat et al., 2013 ). The sharpened map was used for the majority of model building, with the exception of the C-terminal portions of two P monomers, which were built using both the sharpened and unsharpened maps. The region N-terminal to the RdRp Motif A that connects the palm and finger subdomains could not be accurately built in our model, but additional volume likely corresponding to residues ∼665–672 of RSV L was visible in the map. This region is predicted to contain a small α-helix that is visible in the related VSV structure. Manual model building was carried out using Coot ( Emsley and Cowtan, 2004 ) and refinement of the coordinates was performed using Phenix ( Adams et al., 2002 , Afonine et al., 2018 ). Additional model optimization was performed using ISOLDE ( Croll, 2018 ), accessed through ChimeraX ( Goddard et al., 2018 ).
Minigenome assay
Plasmids for eukaryotic expression of the hRSV N, P, M2-1, and L proteins designated pN, pP, pM2-1 and pL, have been described previously ( Fix et al., 2011 , Tran et al., 2007 ). The pM/Luc subgenomic minigenome, which encodes the firefly luciferase (Luc) reporter gene under the control of the M/SH gene start sequence, was derived from the pM/SH subgenomic replicon ( Hardy and Wertz, 1998 ) and has been described previously ( Tran et al., 2009 ). Point mutations were introduced in pP by site-directed mutagenesis, using the Quikchange site-directed mutagenesis kit (Stratagene). Sequence analysis was carried out to check the integrity of all the constructs. Cells at 90% confluence in 48-well dishes were transfected with a plasmid mixture containing 125 ng of pM/Luc, 125 ng of pN, 125 ng of pP, 62.5 ng of pL, and 31 ng of pM2-1, as well as 31 ng of pRSV-β-Gal (Promega) to normalize transfection efficiencies ( Tran et al., 2009 ). Transfections were done in triplicate, and each independent transfection was performed three times. Cells were harvested 24 h post-transfection, then lysed in luciferase lysis buffer (30 mM Tris-HCl pH 7.9, 10 mM MgCl 2 , 1 mM DTT, 1% Triton X-100, and 15% glycerol). The luciferase activities were determined for each cell lysate with an Infinite 200 Pro (Tecan, Männedorf, Switzerland) and normalized based on β-galactosidase (β-Gal) expression.
📊 Figures
Figureu00a01
The Recombinant RSV L-P Complex Is Biochemically Active (A) SDS-PAGE of the purified L-P complex. Molecular weights (in kilodaltons) of the ladder are shown on the left, and the L and P bands are labe...
Figureu00a0S1
Cryo-EM Data Processing, Related to Figureu00a02 Flow chart shows the data processing scheme used to obtain the 3.2u00a0u00c5 resolution map for the RSV Lu2013P complex. A cutout of the cryo-EM map is...
Figureu00a02
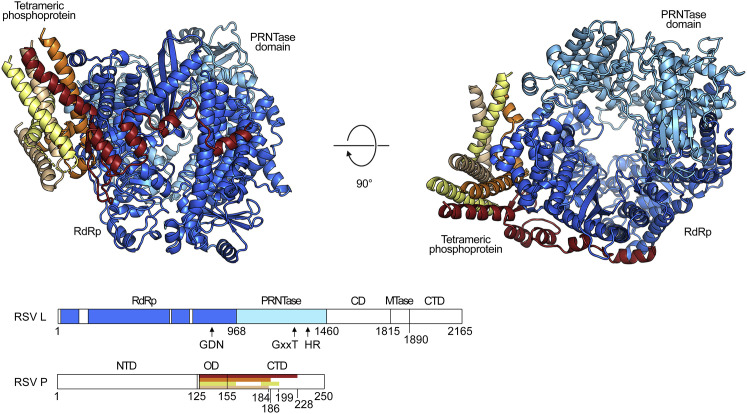
Structure of the RSV L Core Bound to Tetrameric P RSV L is shown in ribbons colored in cool colors, and each monomer of tetrameric P is shown in ribbons colored in a unique warm color. The RNA-depende...
Figureu00a0S2
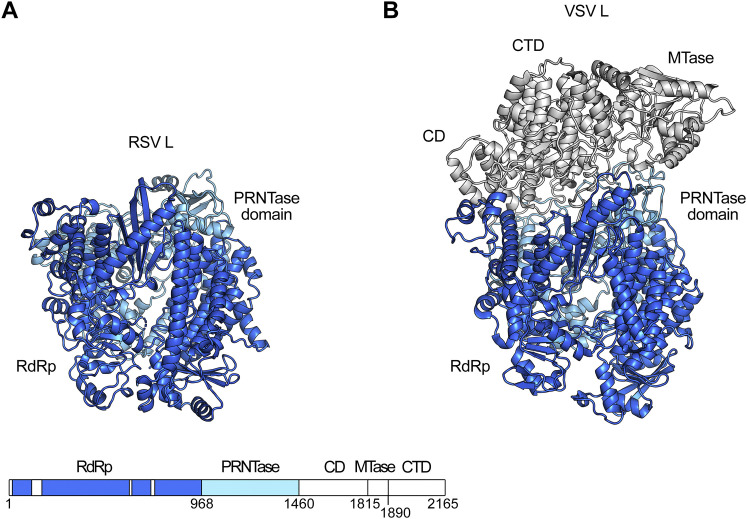
The CD, MTase, and CTD Are Absent in the Cryo-EM Map, Related to Figureu00a02 (A) The model built for the L protein core of RSV and (B) the published structure of VSV L ( Liang etu00a0al., 2015 ) are ...
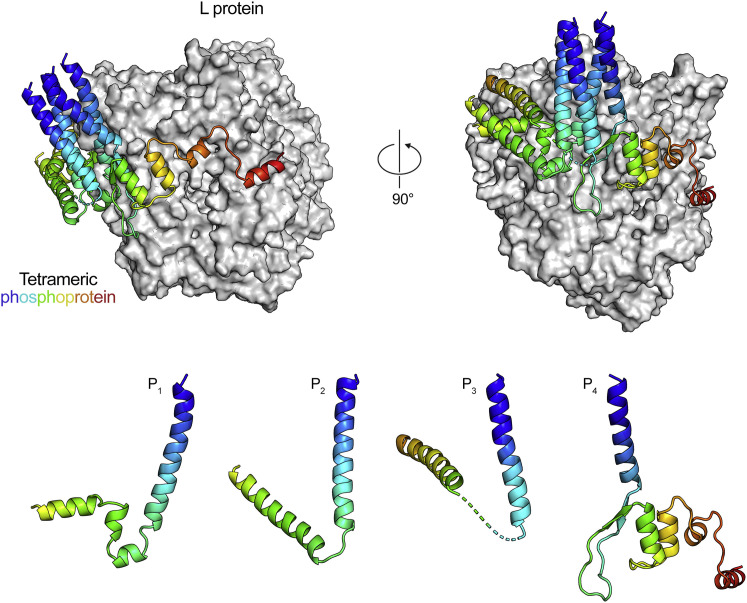
Figureu00a03
The RSV P Tetramer Wraps around L in a Tentacular Fashion RSV L is shown as a white molecular surface, and P monomers are shown as ribbons. The P 4 monomer is colored as a rainbow (blue to red, N to C...
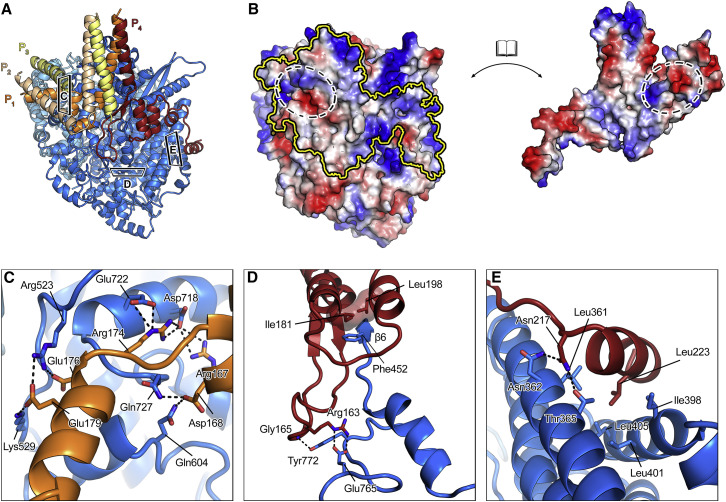
Figureu00a04
Two Phosphoprotein Monomers Contact Three Discrete Regions on the RdRp Domain of RSV L (A) RSV L and P are colored as in Figureu00a02 but are rotated by 90u00b0 about the vertical axis. The three wind...
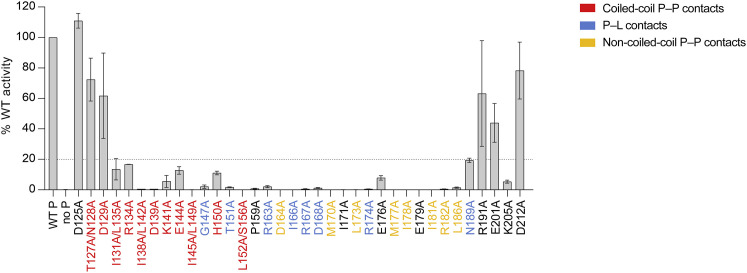
Figureu00a0S3
Residues Involved in P-L and P-P Contacts Are Critical for Polymerase Function, Related to Figureu00a04 BSRT7/5 cells ( Buchholz etu00a0al., 1999 ) were transfected with plasmids encoding the wild-typ...
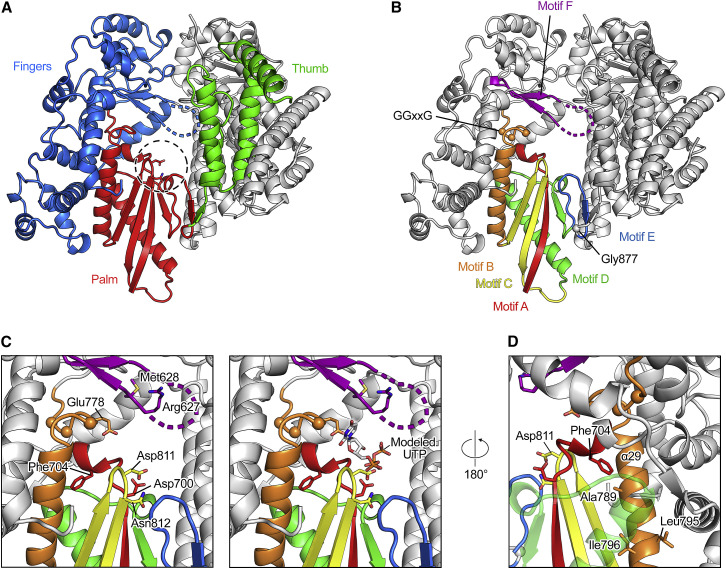
Figureu00a05
Structure of the RSV L RdRp Domain (A) The RdRp domain is shown in ribbons, with the fingers in blue, the thumb in green, the palm in red, and the remaining structural support of the RdRp domain in wh...
Figureu00a0S4
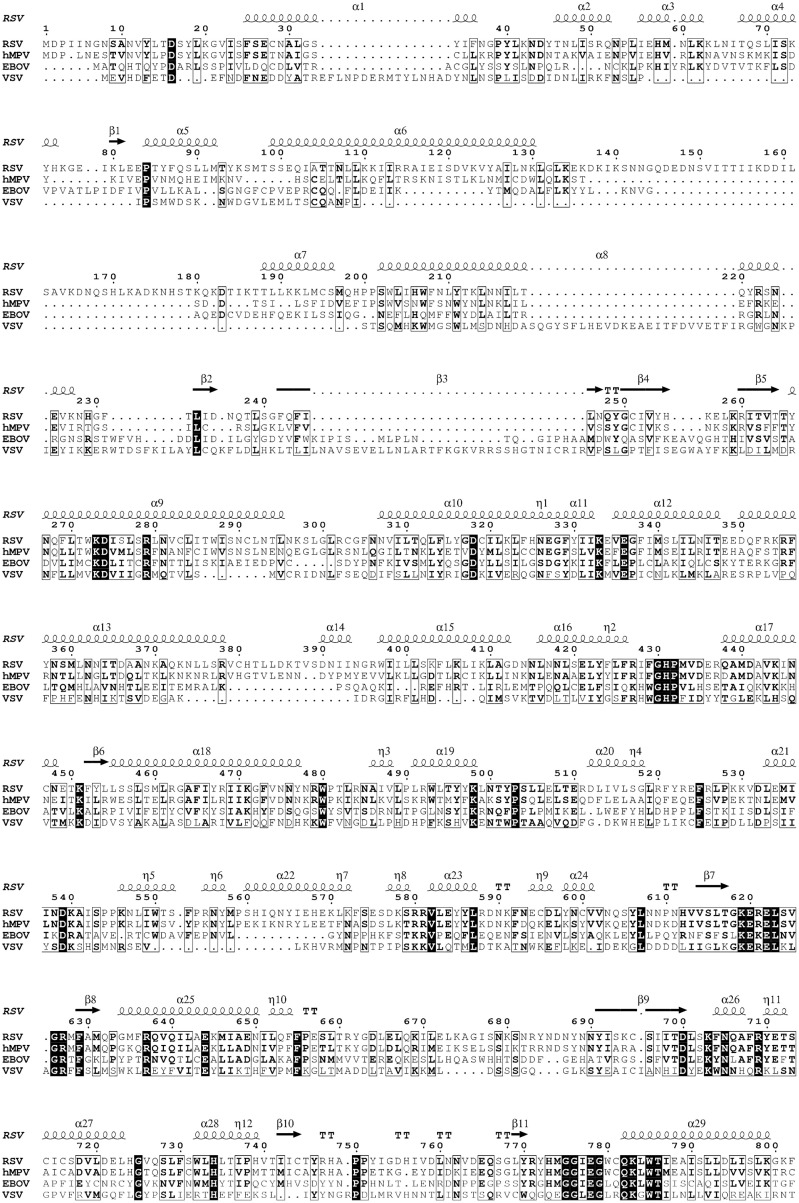
Amino Acid Sequence Alignment of L Proteins, Related to Figureu00a02 The amino acid sequences of L from RSV strain A2 ( P28887 ), human metapneumovirus ( Q91L20 ), Zaire ebolavirus strain Mayinga-76 (...
Figureu00a0S5
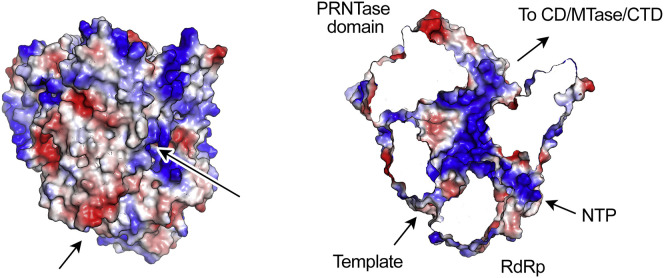
Positively Charged Channels on the RSV L Core, Related to Figureu00a05 L is shown as molecular surfaces colored by electrostatic potential (positive in blue, negative in red). Arrows highlight two pos...
Figureu00a06
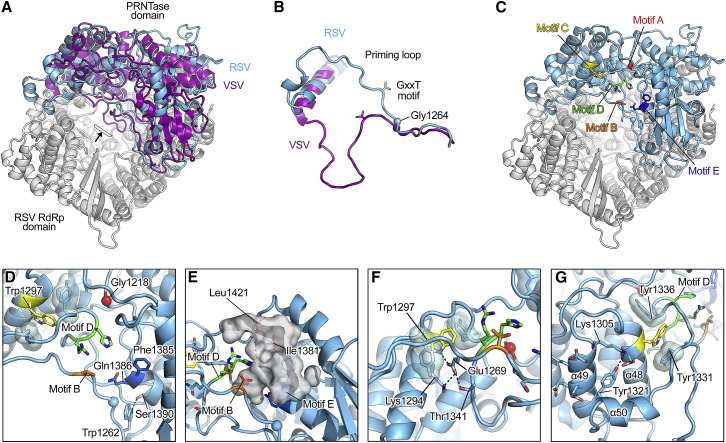
Structure of the RSV L PRNTase Domain (A) The RSV L protein is shown as ribbons, with the RdRp domain in white and the PRNTase domain in light blue. The PRNTase domain of VSV L is aligned to that of R...
Figureu00a0S6
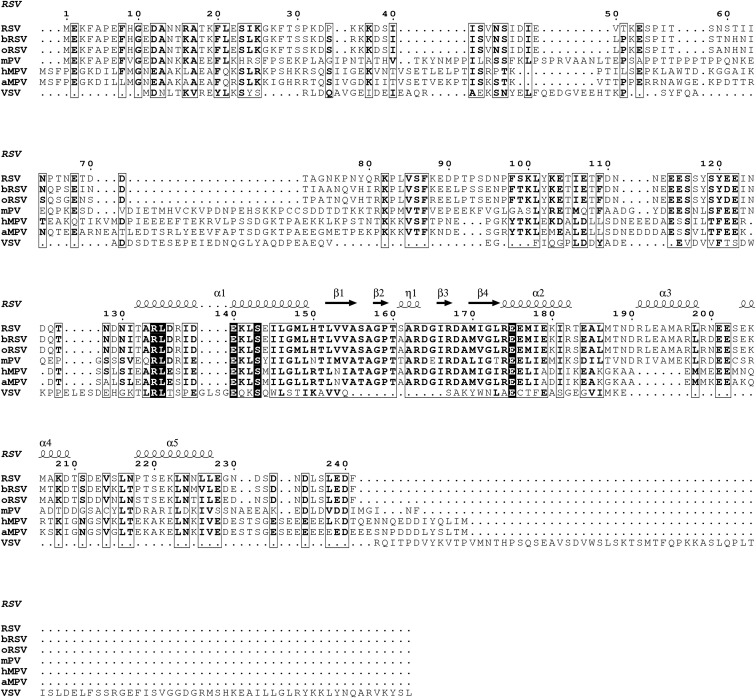
Amino Acid Sequence Alignment of Phosphoproteins, Related to Figureu00a03 The amino acid sequences of P from RSV strain A2 ( P03421 ), bovine RSV strain A51908 ( P33454 ), ovine RSV strain WSU 83-1578...
Figureu00a0S7
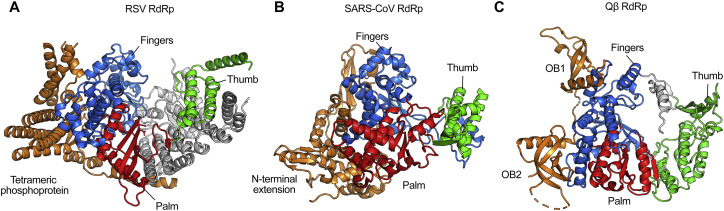
Structural Similarity in Binding Modes of RSV P, SARS-CoV RdRp N-Terminal Extension, and Bacteriophage Qu03b2 Accessory Protein, Related to Figureu00a03 (A) The RdRp domain of RSV L is shown as ribbon...
Figure images are served from the NIH/NLM PubMed Central Open Access Subset or Europe PMC; copyright remains with the publishers and authors.
💬 Discussion
0 commentsNo comments yet. Be the first to start a discussion!
Leave a Comment