Abstract
In motile cilia, a mechanoregulatory network is responsible for converting the action of thousands of dynein motors bound to doublet microtubules into a single propulsive waveform. Here, we use two complementary cryo-EM strategies to determine structures of the major mechanoregulators that bind ciliary doublet microtubules in Chlamydomonas reinhardtii. We determine structures of isolated radial spoke RS1 and the microtubule-bound RS1, RS2 and the nexin-dynein regulatory complex (N-DRC). From these structures, we identify and build atomic models for 30 proteins, including 23 radial-spoke subunits. We reveal how mechanoregulatory complexes dock to doublet microtubules with regular 96-nm periodicity and communicate with one another. Additionally, we observe a direct and dynamically coupled association between RS2 and the dynein motor inner dynein arm subform c (IDAc), providing a molecular basis for the control of motor activity by mechanical signals. These structures advance our understanding of the role of mechanoregulation in defining the ciliary waveform.
🔬 Techniques
🧬 Organisms
💻 Software
✨ Fluorophores
🏭 Microscope Brands
🧪 Reagent Suppliers
📷 Detectors
💻 Software Details
💾 Data Repositories
🏛️ Research Organizations (ROR)
Affiliated research institutions:
📋 Methods
Chlamydomonas reinhardtii culture
We used wild-type Chlamydomonas reinhardtii cells (strain CC-125) as the source for doublet microtubules and wild-type Chlamydomonas cells (strain CC-1690) as the source from which to isolate radial spokes. Both strains were obtained from the Chlamydomonas Resource Center at the University of Minnesota. For doublet microtubule preparation, Chlamydomonas cells were spread onto 5 Tris-Acetate-Phosphate (TAP) agar plates at a starting density of 8 × 10 6 cells/plate and grown for 2 days at 25°C to reach a final density of 1.28 × 10 8 cells/plate. Cells from the 5 plates were resuspended in 80 mL of M-N/5 medium 56 and incubated at 25°C for 2 h to allow flagellar assembly. For radial spoke preparation, Chlamydomonas cells (strain CC-1690) were grown in TAP medium at room temperature for 4-5 days and were harvested before the 8 th light hour of a 12 h/12 h light-dark cycle at a concentration of ~3-5 × 10 6 cells/mL.
Flagella isolation and radial spoke purification
Flagella were isolated following a modified version of a published protocol 57 , as described in detail in Supplementary Note 1 . Radial spoke purification from isolated flagella is also described in Supplementary Note 1 .
Mass-spectrometry analysis
The fraction from the monoQ elution corresponding to RS1 was denatured with SDS-loading buffer and loaded onto a 4-20% precast polyacrylamide gel (Bio-Rad). The gel was run for 3 min and then silver stained. The band was cut and sent for mass spectrometry analysis at the Taplin Mass Spectrometry Facility at Harvard Medical School. The annotated mass spectrometry data are provided as Supplementary Data 1 . Mass spectrometry analysis of the doublet microtubule sample is reported in 21 . Negative-stain microscopy 4 μl of purified RS1 at a concentration of 0.03 mg/mL was applied onto a glow discharged continuous carbon grid (Electron Microscopy Sciences, Inc.). After one minute of adsorption, the grid was blotted with filter paper to remove excess sample, immediately washed twice with 4 μl of 1.5% uranyl formate solution and incubated with 4 μl of 1.5% uranyl formate solution for an additional one minute. The grid was then further blotted with filter paper to remove the uranyl formate solution, air-dried at room temperature, and examined with a Tecnai T12 electron microscope (Thermo Fisher Scientific) equipped with an LaB6 filament and operated at 120-kV acceleration voltage, using a nominal magnification of 52,000× at a pixel size of 2.13 Å. Images were recorded using a Gatan 4k × 4k CCD camera with an exposure of 20–30 e − /Å 2 . The defocus for data acquisition was set to between −1 μm and −3 μm. RELION-3.0 58 was used for all image processing steps. Firstly, ~500 particles were picked manually and subjected to two-dimensional (2D) classification. Good classes were selected and used as references to automatically pick particles from all micrographs. 3,293 particles were picked from 54 micrographs and three rounds of reference-free 2D classification were performed to select good particles. These particles were used to generate an initial three-dimensional (3D) density map using RELION-3.0 and for a round of 3D refinement in which the initial model was used as a reference.
Show full methods section
Chlamydomonas reinhardtii culture
We used wild-type Chlamydomonas reinhardtii cells (strain CC-125) as the source for doublet microtubules and wild-type Chlamydomonas cells (strain CC-1690) as the source from which to isolate radial spokes. Both strains were obtained from the Chlamydomonas Resource Center at the University of Minnesota. For doublet microtubule preparation, Chlamydomonas cells were spread onto 5 Tris-Acetate-Phosphate (TAP) agar plates at a starting density of 8 × 10 6 cells/plate and grown for 2 days at 25°C to reach a final density of 1.28 × 10 8 cells/plate. Cells from the 5 plates were resuspended in 80 mL of M-N/5 medium 56 and incubated at 25°C for 2 h to allow flagellar assembly. For radial spoke preparation, Chlamydomonas cells (strain CC-1690) were grown in TAP medium at room temperature for 4-5 days and were harvested before the 8 th light hour of a 12 h/12 h light-dark cycle at a concentration of ~3-5 × 10 6 cells/mL.
Flagella isolation and radial spoke purification
Flagella were isolated following a modified version of a published protocol 57 , as described in detail in Supplementary Note 1 . Radial spoke purification from isolated flagella is also described in Supplementary Note 1 .
Mass-spectrometry analysis
The fraction from the monoQ elution corresponding to RS1 was denatured with SDS-loading buffer and loaded onto a 4-20% precast polyacrylamide gel (Bio-Rad). The gel was run for 3 min and then silver stained. The band was cut and sent for mass spectrometry analysis at the Taplin Mass Spectrometry Facility at Harvard Medical School. The annotated mass spectrometry data are provided as Supplementary Data 1 . Mass spectrometry analysis of the doublet microtubule sample is reported in 21 . Negative-stain microscopy 4 μl of purified RS1 at a concentration of 0.03 mg/mL was applied onto a glow discharged continuous carbon grid (Electron Microscopy Sciences, Inc.). After one minute of adsorption, the grid was blotted with filter paper to remove excess sample, immediately washed twice with 4 μl of 1.5% uranyl formate solution and incubated with 4 μl of 1.5% uranyl formate solution for an additional one minute. The grid was then further blotted with filter paper to remove the uranyl formate solution, air-dried at room temperature, and examined with a Tecnai T12 electron microscope (Thermo Fisher Scientific) equipped with an LaB6 filament and operated at 120-kV acceleration voltage, using a nominal magnification of 52,000× at a pixel size of 2.13 Å. Images were recorded using a Gatan 4k × 4k CCD camera with an exposure of 20–30 e − /Å 2 . The defocus for data acquisition was set to between −1 μm and −3 μm. RELION-3.0 58 was used for all image processing steps. Firstly, ~500 particles were picked manually and subjected to two-dimensional (2D) classification. Good classes were selected and used as references to automatically pick particles from all micrographs. 3,293 particles were picked from 54 micrographs and three rounds of reference-free 2D classification were performed to select good particles. These particles were used to generate an initial three-dimensional (3D) density map using RELION-3.0 and for a round of 3D refinement in which the initial model was used as a reference.
Cryo-EM sample preparation
Doublet microtubules. Cryo-EM grids of doublet microtubules were prepared as described 21 . Isolated RS1. Cryo-EM grids of isolated radial spokes were prepared using a Vitrobot Mark IV (Thermo Fisher Scientific). 3 μl of purified RS1 at a concentration between 0.50 mg/mL to 0.75 mg/mL was applied onto glow discharged C-flat holy carbon grids (R1.2/1.3, 400 mesh copper, Electron Microscopy Sciences) or Quantifoil holy carbon grids (R1.2/1.3, 400 mesh copper or gold, Quantifoil Micro Tools). The grids were blotted for 7 s with a blot force of 16 and 100% humidity before being plunged into liquid ethane cooled by liquid nitrogen.
Cryo-EM data collection
On-doublet complexes. To improve the resolution of RS1 and RS2 bound to doublet microtubules from our previous report 21 , we collected ~9,600 additional micrographs with the same imaging conditions. All data were collected using a 300 keV Titan Krios microscope equipped with a Cs-corrector (Thermo Fisher Scientific) and a BioQuantum Energy Filter (Gatan) at the Washington University in St. Louis Center for Cellular Imaging (WUCCI). All movies were recorded with a K2 Summit direct electron detector (Gatan) in counting mode, with an exposure rate of 8.5 electrons/pixel/s on the detector camera. The images were recorded at a nominal magnification of 81,000×, corresponding to a calibrated pixel size of 1.403 Å. A total exposure time of 9 s, corresponding to a total dose of 38.9 electrons/Å 2 on the specimen, was fractionated into 30 movie frames. A defocus range from −1.0 to −3.5 μm was set during data acquisition. The data were collected automatically using EPU software (Thermo Fisher Scientific). Isolated RS1. Images of purified RS1 were acquired on a Titan Krios microscope at the Harvard Cryo-EM Center for Structural Biology operating at an acceleration voltage of 300 kV and equipped with a BioQuantum K3 Imaging Filter (slit width 25 eV) and a K3 direct electron detector (Gatan). Images were recorded at a defocus range of −1 to −3.2 μm with a nominal magnification of 81,000×, corresponding to a calibrated pixel size of 1.09 Å. This pixel size was calibrated based on the density map of the on-doublet RS1 spokehead obtained from the Titan Krios at the WUCCI. Each image was dose-fractionated into 50 movie frames with a total exposure time of 2.5 s and a frame exposure time of 0.05 s, resulting in a total dose of ~60 electrons per Å 2 . SerialEM was used for data collection 59 .
Image processing
On-doublet complexes. The data were initially processed following the scheme described in 21 . Briefly, segments of the doublet microtubules were first extracted as non-overlapping 8-nm particles and classified into six classes using Class3D in RELION-3.1. One class, corresponding to the 48-nm repeat of the doublet microtubule, was arbitrarily selected and further classified into two classes, with each class corresponding to one half of the 96-nm repeat. Particles from one of the classes (referred to as 96-nm particles) were used for further processing. In the next step, during particle re-extraction in RELION-3.1, the coordinates of the centers of the 96-nm particles were shifted so that the feature of interest (e.g. RS1 spokehead/stalk, RS2 spokehead/stalk, RSP1-RSP1 interface, RS3S, IDA c, or N-DRC baseplate/lobe) was centered in the 3D reconstruction from these particles ( Extended Data Fig. 1b ). When possible, a smaller box size (256 or 384 instead of 512 pixels) was used to speed up data processing. In total, ~202,000 center-shifted 96-nm particles, with the doublet microtubule signal subtracted, were used to compute the structure of various 96-nm repeat features ( Table 1 ). This is approximately double the number of particles from our previous report 21 . Subsequent 3D classification was performed using Class3D in RELION 3.1 to select a more homogeneous subset of particles for further refinement. For the RS1 and RS2 bases and N-DRC baseplate, the microtubule signal was helpful for image alignment and was therefore not subtracted from the raw particle images, and a customized soft-edged binary mask covering protofilaments A1-A3 was used during refinement. Following post-processing in RELION-3.1, all maps were resolved to between 3.4 and 6.3 Å except for the distal lobe of N-DRC and RS3S, which were resolved to 7.0 Å and 14.4 Å resolution, respectively ( Extended Data Fig. 2a ). Further refinement using polished particles did not improve the resolution or map quality. To generate a composite map for model building and refinement, the maps of the RS2 stalk, IDA c , N-DRC baseplate and the microtubule protofilaments to which they are attached were aligned using the fit in map command in Chimera 60 by maximizing the overlapped density between these maps. These maps were then merged using the vop maximum command in Chimera. The 6.1 Å map of the proximal region of the RS1 stalk was not included in the composite map due to its lower resolution than surrounding maps. Isolated RS1. A total of 14,391 movie stacks were motion corrected and electron-dose weighted using MotionCor2 61 . The CTF parameters were estimated from the motion-corrected micrographs using CTFFIND4 62 . 12,331 micrographs were selected for further processing based on visual inspection of the micrographs and their corresponding power spectra. Particles were automatically selected using CrYOLO 63 or Laplacian-of-Gaussian picker implemented in RELION-3.0. All subsequent 2D and 3D analyses were performed using RELION-3.0 or RELION-3.1. 256,239 particles were selected after several rounds of 2D classification from 2,320,543 auto-picked particles. Since most 2D classes centered at the head of the radial spoke, we re-centered the particles using a similar strategy as in 64 . Another round of 2D classification was performed to check that re-centering had worked. The data were then subjected to 3D classification. The density map generated with the negative-stain data was low-pass filtered to 30 Å and used as the initial model. 221,836 particles were selected after 3D classification for 3D refinement. After refinement, CTF refinement and Bayesian polishing was performed, followed by another 3D refinement, yielding a 3.7 Å density “consensus” map ( Extended Data Fig. 5g , left). To further improve the density map, several rounds of multi-body refinement 65 , signal subtraction, and re-centering were performed ( Extended Data Fig. 5g ). First, we did a multi-body refinement with two masks, one that covered the spokehead and one that covered the neck and stalk. Signal subtraction was then performed and the density corresponding to each body were re-centered and extracted with a smaller boxsize of 480 pixel instead of 560 pixel for the consensus refinement. Masks with a soft edge of 6 pixels surrounding the two bodies were used for both multi-body refinement and signal subtraction. The signal-subtracted particles were centered on projections of the mass center of the masks. Individual 3D refinements were then performed on the spokehead and the neck/stalk. Since the spokehead has two-fold rotational symmetry, C2 symmetry was imposed during refinement, yielding a 3.2 Å density map. To improve the density of the extended domains of the spokehead, we used symmetry expansion 66 , subtracted the density of half of the spokehead, performed a 3D classification to select 311,578 good particles from the 443,672 symmetry-expanded particles and applied local masks during refinement. To further improve the density for the globular N-terminal domain of RSP1, we did signal subtraction, and re-centered and extracted the RSP1 density with a smaller boxsize of 200 pixel. Refinement of the subtracted RSP1 density yielded a 3.6 Å density map. For the neck and stalk, 3D classification with local mask on the neck was performed after refinement. Selected particles were used for subsequent refinement, with a local mask of the neck applied, yielding a 3.6 Å density map. A similar strategy was used to improve the lower part of the stalk. The composite map for the complete isolated radial spoke was generated using the vop maximum command in Chimera, as described for the on-doublet complexes. Briefly, three improved maps within the local masks of each asymmetric unit were combined with the central part of the C2 map, constituting the spokehead map. The local maps for the neck and the lower part of the stalk were combined with the central part of the overall neck and stalk map, constituting the composite neck and stalk map. Then the two maps were aligned with the consensus map and combined, generating the complete density map of the isolated radial spoke.
Analysis of RS1 dynamics by deep neural networks
CryoDRGN v0.0.19 67 models were trained on single-particle images of isolated RS1 down-sampled to an image size of 256x256 (2.40625 Å/pix) with their corresponding poses assigned from a consensus reconstruction in RELION. All reconstructions used a 1024x3 (nodes/layer x layer) fully connected architecture for the encoder and decoder networks. The latent variable dimension was 10. Training was performed in minibatches of 8 images using the Adam optimizer and a learning rate of 0.0001. For particle filtering, the initial stack of 221,836 images was randomly split into two halves of 110,918 particles, which were then processed separately. A cryoDRGN model was trained on each half stack for 50 epochs. Based on an analysis of the latent space, an interactive lasso tool was used to select particles corresponding to the full complex, resulting in 55,110 and 53,976 particles for each half stack, respectively. Excluded regions in the latent space corresponded to component variability in the spokehead dimer and particle images with edge artifacts. The observed heterogeneity was reproducible across replicate runs with different training hyperparameters (not shown). For the final reconstruction, a cryoDRGN model was trained on 98,177 particle images from the filtered half stacks for 50 epochs. After training, a continuous trajectory depicting the spokehead tilting was produced by generating 10 structures along the first principle component of the latent space data manifold at equally spaced points between the 5 th and 95 th percentile PC1 values. Analysis of radial spoke dynamics by multi-body analysis On-doublet complexes. RELION-3.1 was used to perform multi-body analysis 65 . To analyze the on-doublet movement between the spokehead and stalk regions of RS1/RS2, we started from a consensus refinement that was focused on the spokehead and used two generous masks that separately covered the spokehead and stalk. To analyze the movement between the stalk of RS1 and the doublet microtubule, we started from a consensus refinement that focused on the stalk and used two masks covering the RS1 stalk and doublet microtubule. To analyze the movements between the stalk of RS2, IDA c and the doublet microtubule, we used three masks covering each different region. The results were analyzed using relion_flex_analyse . Movements from the top three eigenvectors were examined. Isolated RS1. After a consensus 3D refinement of isolated RS1, two masks were applied during multi-body analysis. One mask covered the spokehead and the other covered the neck and stalk. The results were analyzed using relion_flex_analyse . Movements from the top three eigenvectors were examined. Model building All model building was performed in Coot 68 . Model building of the proximal regions of the stalks used the on-doublet maps of RS1 (EMD-22480) and RS2 (EMD-22481). Model building of the neck and spokehead used the composite map of isolated RS1 (EMD-22475). Interpretation of the on-doublet microtubules maps started with fitting of the model of the Chlamydomonas doublet microtubule (PDB 6U42) 21 . An accurate model of the CCDC39/40 coiled coil was then built. The RSPs were identified within the maps using one or more of the following strategies: 1) manual fold recognition, 2) automated density-guided fold recognition, 3) secondary structure assignment, 4) de novo sequence assignment, 5) prior knowledge, and 6) bioinformatic prediction (see Supplementary Note 1 for details). How each protein was identified, and the accuracy and completeness of the resulting models are summarized in Supplementary Table 1 . Flagellar associated proteins (FAPs) are numbered according to 69 .
Refinement
Atomic models for individual subunits were refined during model building using real-space refinement in Coot with torsion, planar peptide and Ramachandran restraints applied 68 . After model building, the subunits were combined into three separate PDB files corresponding to: 1) isolated RS1 (PDB 7JTK), 2) on-doublet RS2 stalk/N-DRC baseplate/IDA c (PDB 7JU4), and 3) on-doublet RS1 stalk (PDB 7JTS). These atomic models were then refined into their corresponding composite maps using Phenix.real_space_refine v1.18.2-3874 70 . Secondary structure, Ramachandran and rotamer restraints were applied during refinement of the models of isolated RS1 (resolution cutoff 3.7 Å) and the on-doublet RS2 stalk/N-DRC baseplate/IDA c (resolution cutoff 4.1 Å). A round of manual model correction in Coot was performed between rounds of real-space refinement in Phenix. The final refinement was performed for two or three macro cycles with strategies of minimization_global and local_grid_search . The model of the on-doublet RS1 stalk was refined using rigid body fitting only in Phenix as the resolution of the map was 6.1 Å. The quality of the refined models was analyzed by MolProbity 71 , with their statistics reported in Table 1 . Figures Figures were generated using Chimera 60 , ChimeraX 72 or PyMOL 73 . Maps colored by local resolution were generated using RELION 3.1 58 . Software used in the project by members of the Brown laboratory were installed and configured by SBGrid 74 . Further information on experimental design is available in the Nature Research Reporting Summary linked to this article.
Code Availability
Code used for the initial separation of singlet and doublet microtubules is available on request from Rui Zhang ( zhangrui@wustl.edu ).
Data availability
Composite cryo-EM maps and atomic models have been deposited in the Electron Microscopy Data Bank (EMDB) and wwPDB, respectively, with accession codes EMD-22475 and PDB 7KTK (isolated RS1); and EMD-22481 and PDB 7JU4 (on-doublet RS2 stalk/IDA c /N-DRC). Constituent maps, and the masks that were applied during reconstruction, are associated with these depositions as additional files. Cryo-EM maps have been deposited with accession codes EMD-22480 (on-doublet RS1 stalk), with associated atomic model PDB 7JTS; EMD-22482 (on-doublet RS1 spokehead); EMD-22483 (on-doublet RS2 spokehead), and EMD-22486 (on-doublet RSP1 dimer).
Supplementary Material 1 1633129_Sup_Vid_1
📊 Figures
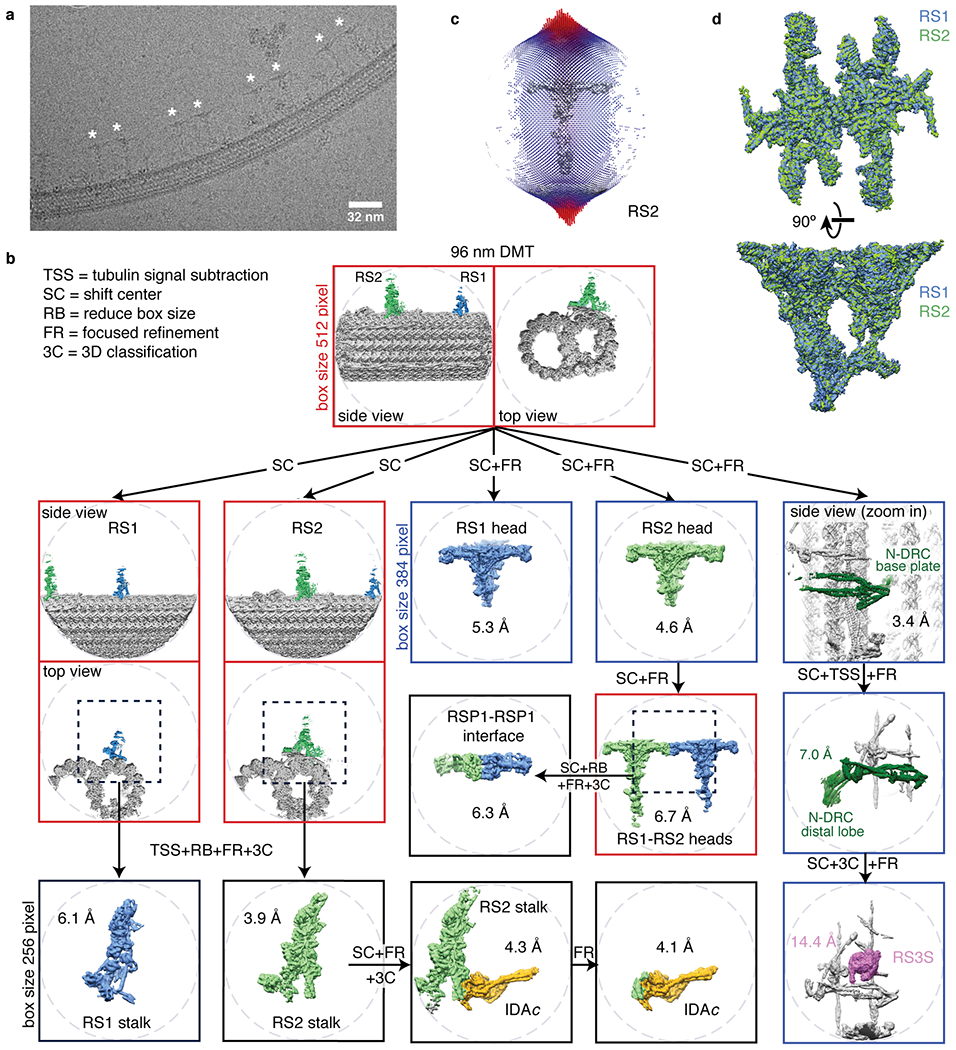
Extended Data Fig. 1 |
Data collection and processing for the on-doublet mechanoregulatory complexes.
a , Section of an electron micrograph showing radial spokes (marked with an asterisk) bound to a doublet microtubule in vitreous ice. b , Processing scheme used to generate reconstructions of mechanor...

Extended Data Fig. 2 |
Global and local resolution of on-doublet mechanoregulatory complexes.
a , Fourier shell correlation (FSC) curves calculated between masked independent half maps for on-doublet structures. Left panel, FSC curves are shown for focused refinements of the RS1 spokehead and ...
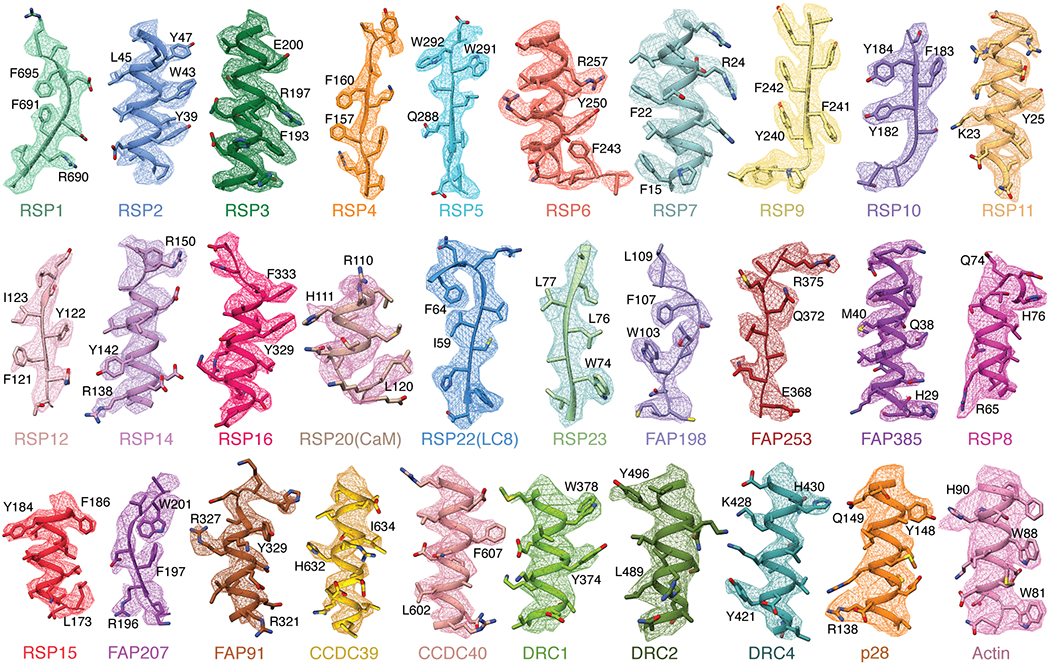
Extended Data Fig. 3 |
Map quality.
Examples of map density for all 30 non-tubulin proteins identified in this study. The first 19 proteins show density from isolated RS1 contoured at 0.009-0.013. The remaining 11 proteins (starting fro...
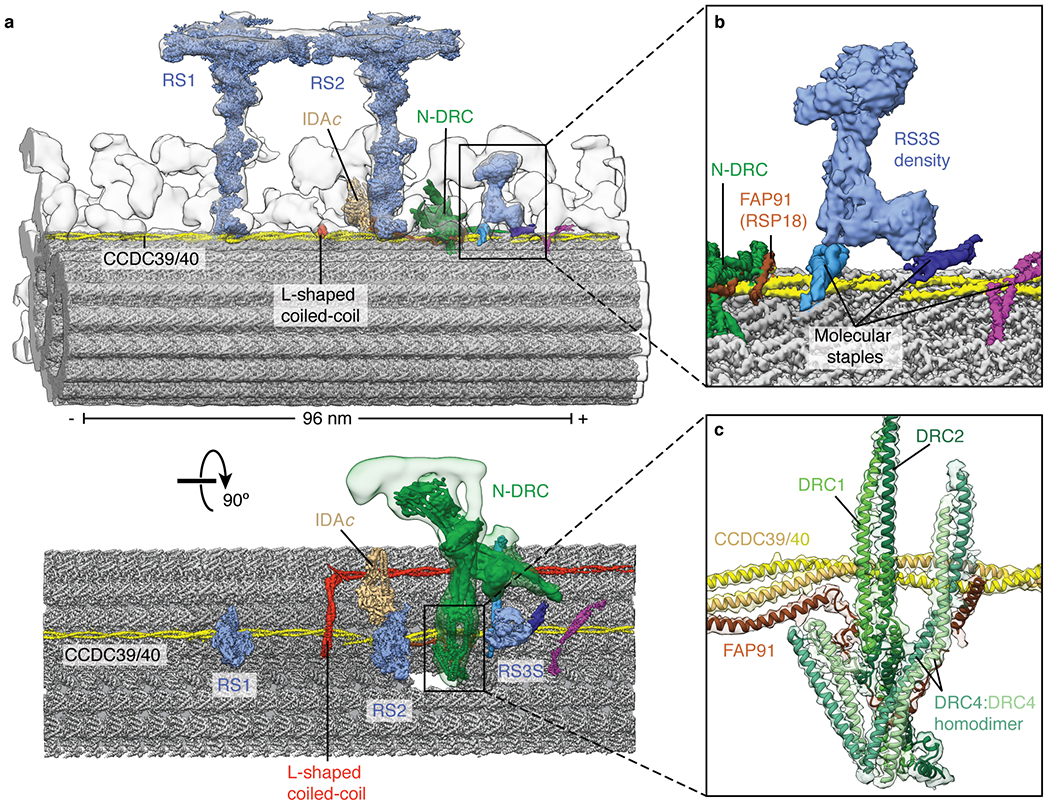
Extended Data Fig. 4 |
Single-particle cryo-EM maps docked into a subtomogram average of the axoneme.
a , Two views showing the single-particle cryo-EM maps of RS1, RS2, RS3S, N-DRC, and IDA c docked into the subtomogram average of the 96-nm repeat of the Chlamydomonas axoneme (EMD-6872). The subtomog...
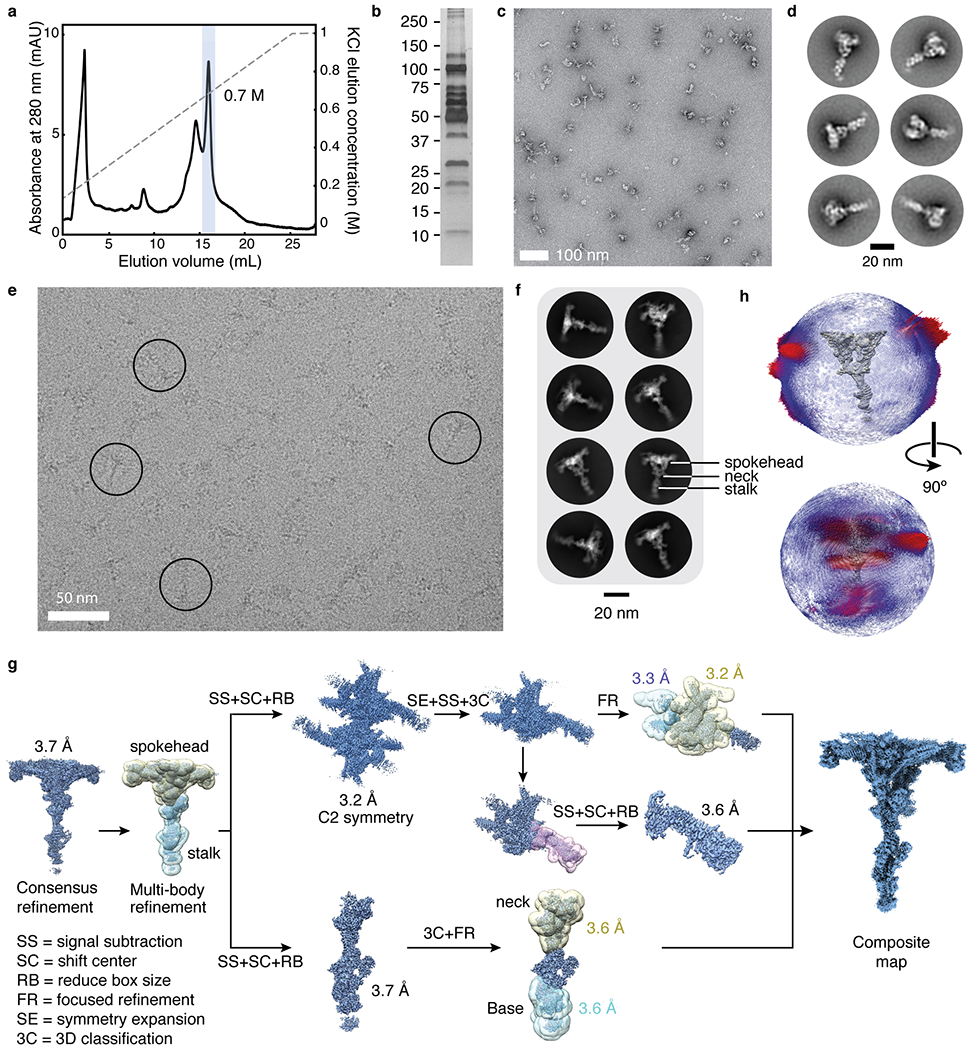
Extended Data Fig. 5 |
Data collection and processing for isolated RS1.
a , Chromatogram showing the elution of RS1 from an anion-exchange column using a KCl gradient. The peak fraction containing RS1 is highlighted and elutes at ~0.7 M KCl. b , Silver-stained SDS-PAGE ge...
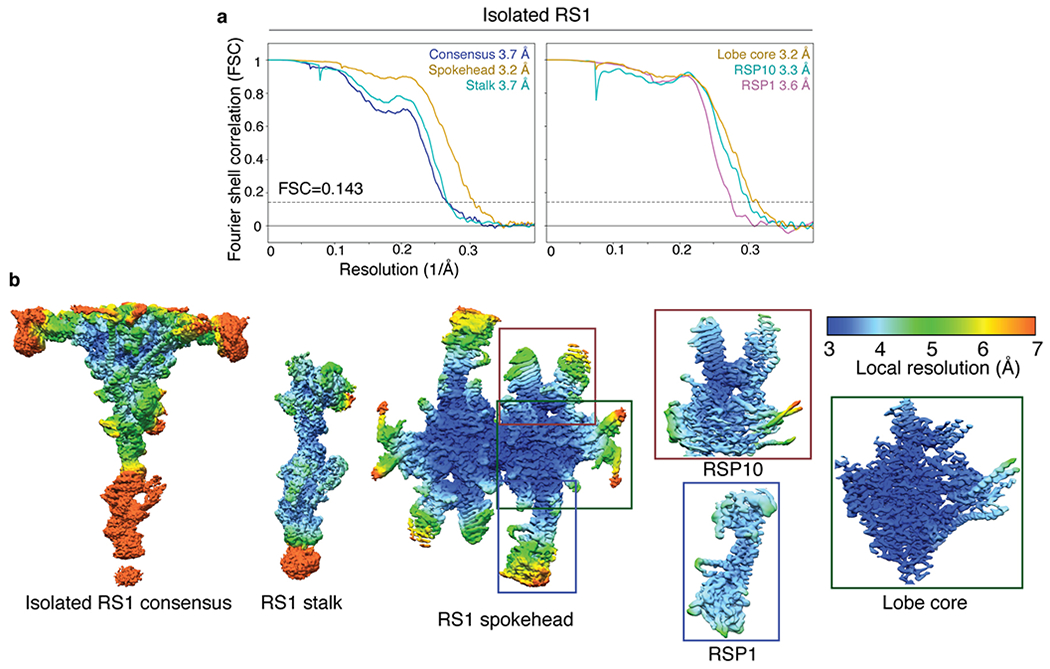
Extended Data Fig. 6 |
Global and local resolution of isolated RS1.
a , FSC curves calculated between masked independent half maps for isolated RS1. Left panel, FSC curves are shown for the consensus refinement of isolated RS1, focused refinement of the stalk, and foc...
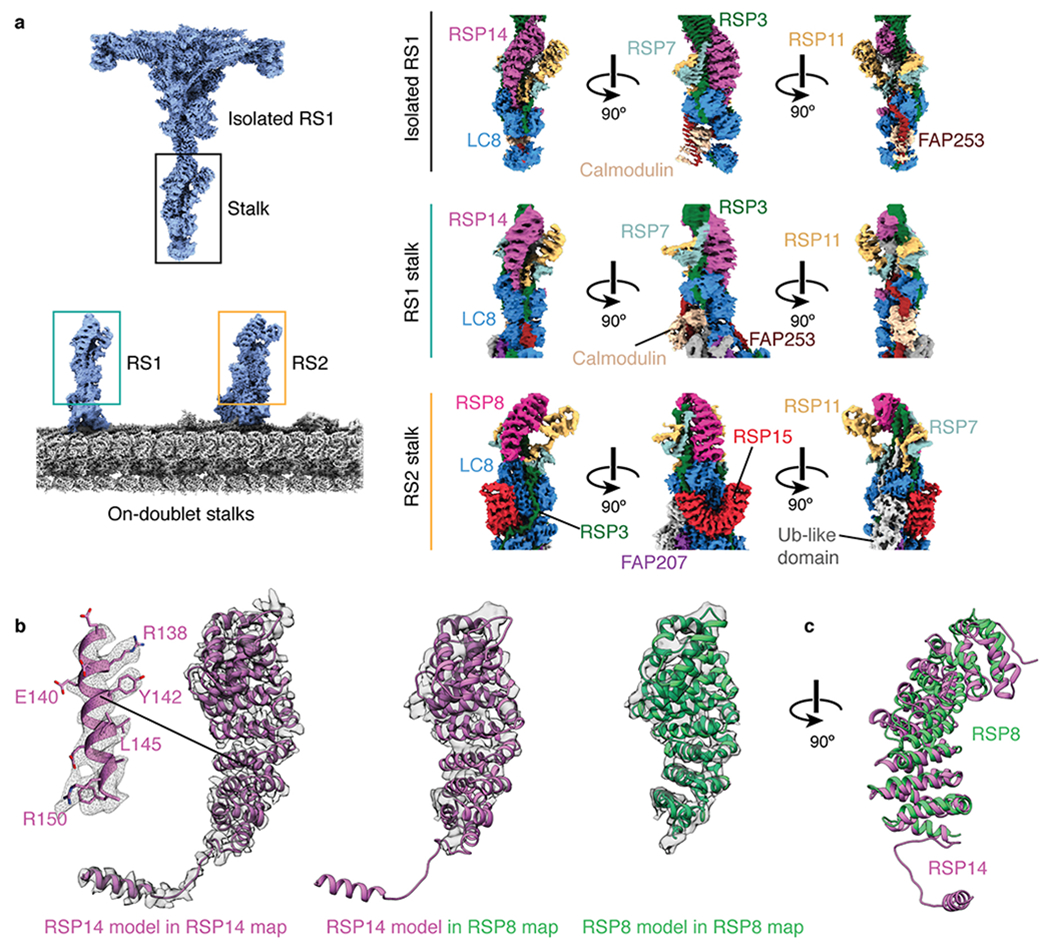
Extended Data Fig. 7 |
The stalks of RS1 and RS2.
a , The stalk of the isolated radial spoke is consistent with the on-doublet stalk of RS1 only. FAP253, RSP14, and calmodulin are present in the stalk of RS1 but not RS2. RSP8, RSP15, and an unidentif...
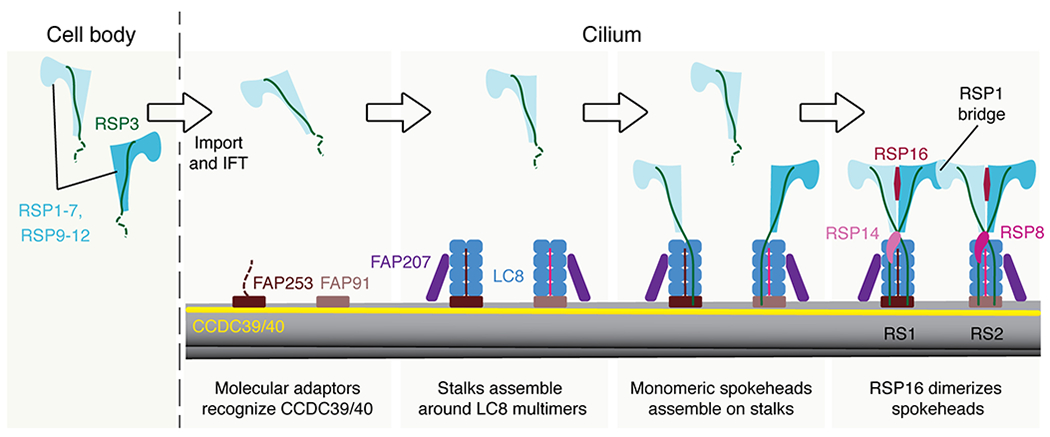
Extended Data Fig. 8 |
Model of radial spoke assembly.
Proposed model of radial spoke assembly. Monomeric spokehead lobes, comprising RSP1-7 and RSP9-12, assemble in the cell body 28 , 34 u2013 36 before being imported into the cilium by intraflagellar tr...
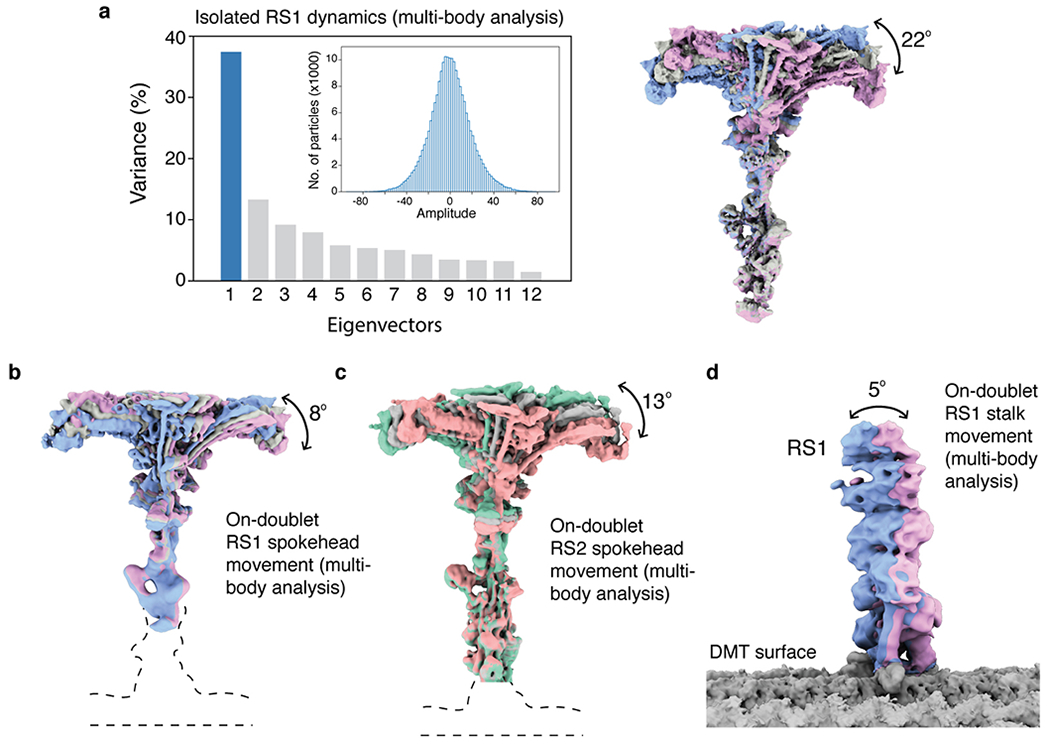
Extended Data Fig. 9 |
Dynamics of radial spokes by multi-body analysis.
a , Multi-body analysis of isolated RS1. Left, the contributions of all eigenvectors to the variance. The first eigenvector accounts for 37% of all variability. Inset, the unimodal histogram of amplit...
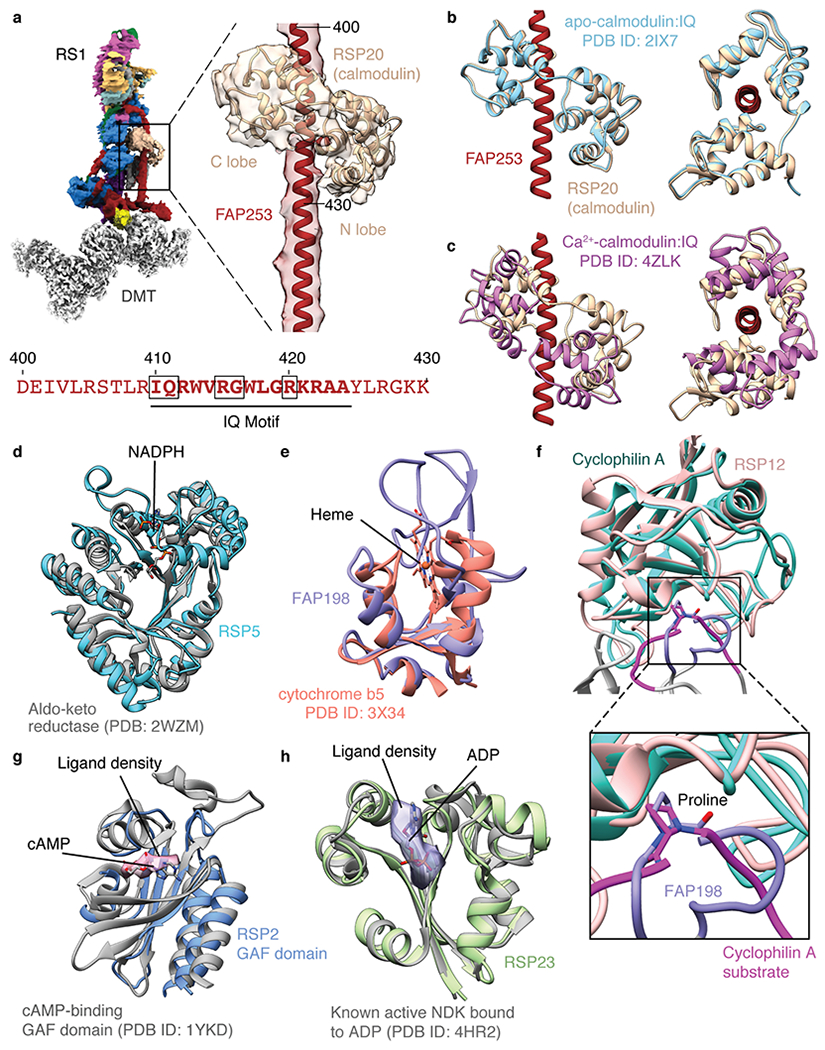
Extended Data Fig. 10 |
Potential chemical modulation of radial spokes.
a , Calmodulin binds the IQ motif of FAP253 at the base of RS1. Below, sequence of FAP253 residues 400-430 showing the presence of an IQ motif (emboldened with motif-defining residues boxed). b , Stru...
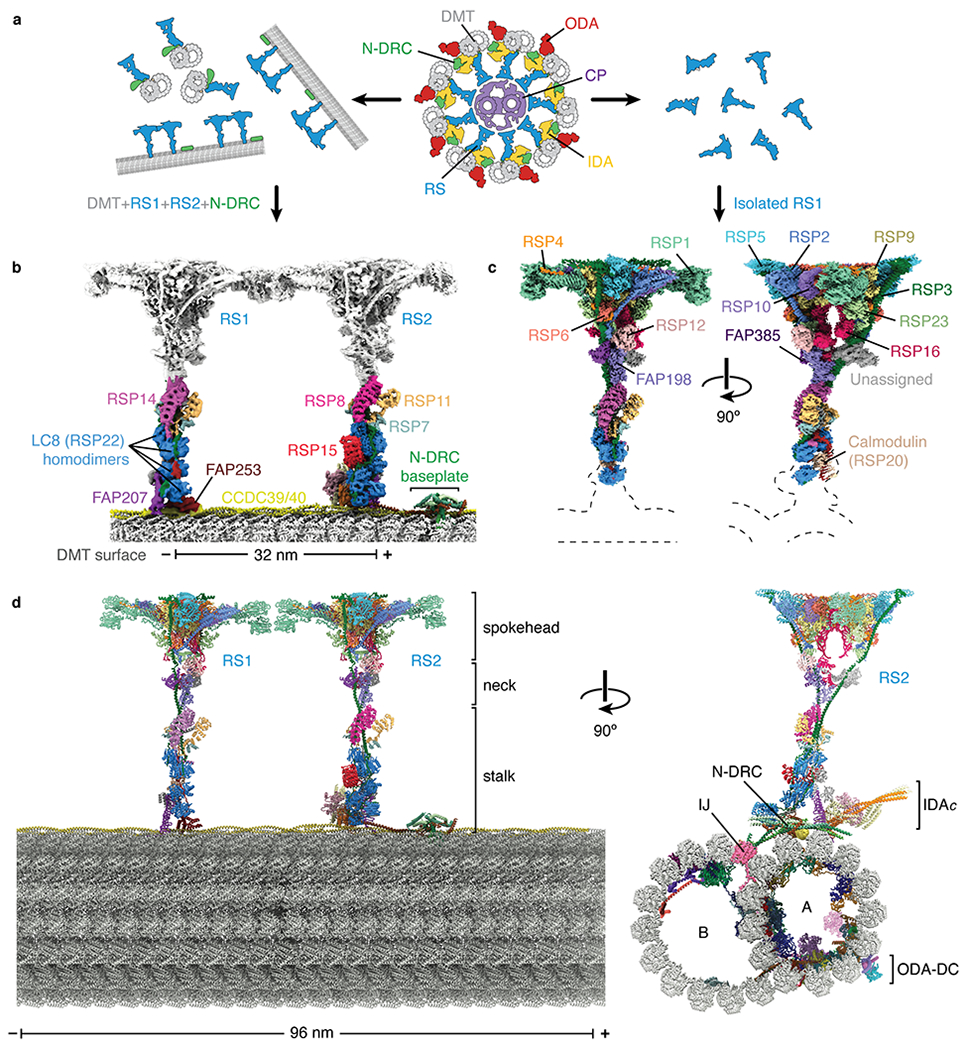
Fig. 1 |
Structures of radial spokes on and off doublet microtubules.
a , Schematic representation showing biochemical fragmentation of the Chlamydomonas axoneme (viewed in cross-section; center) into mechanoregulator-bound doublet microtubules (left) and isolated radia...
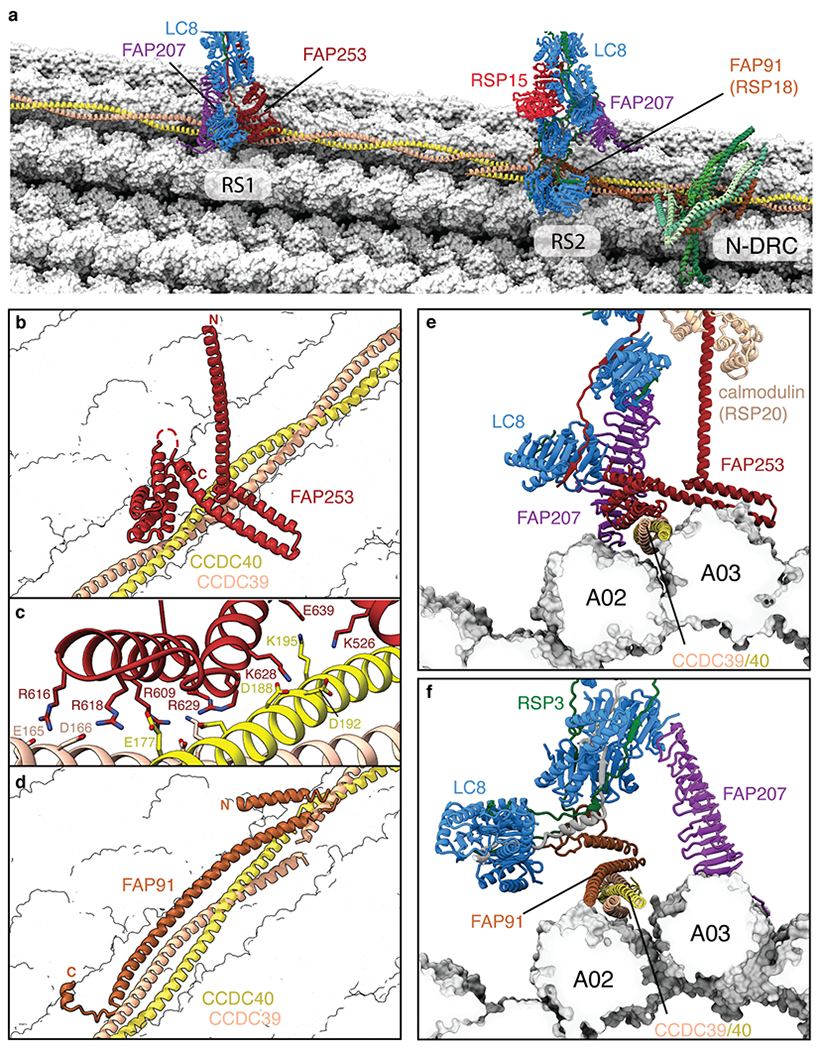
Fig. 2 |
Structural basis for the microtubule docking and longitudinal periodicity of radial spokes.
a , Overview showing the bases of radial spokes 1 and 2 (RS1 and RS2) bound to the doublet microtubule. The radial spoke subunits (LC8, FAP91, FAP207, FAP253, and RSP15), the CCDC39/40 molecular ruler...
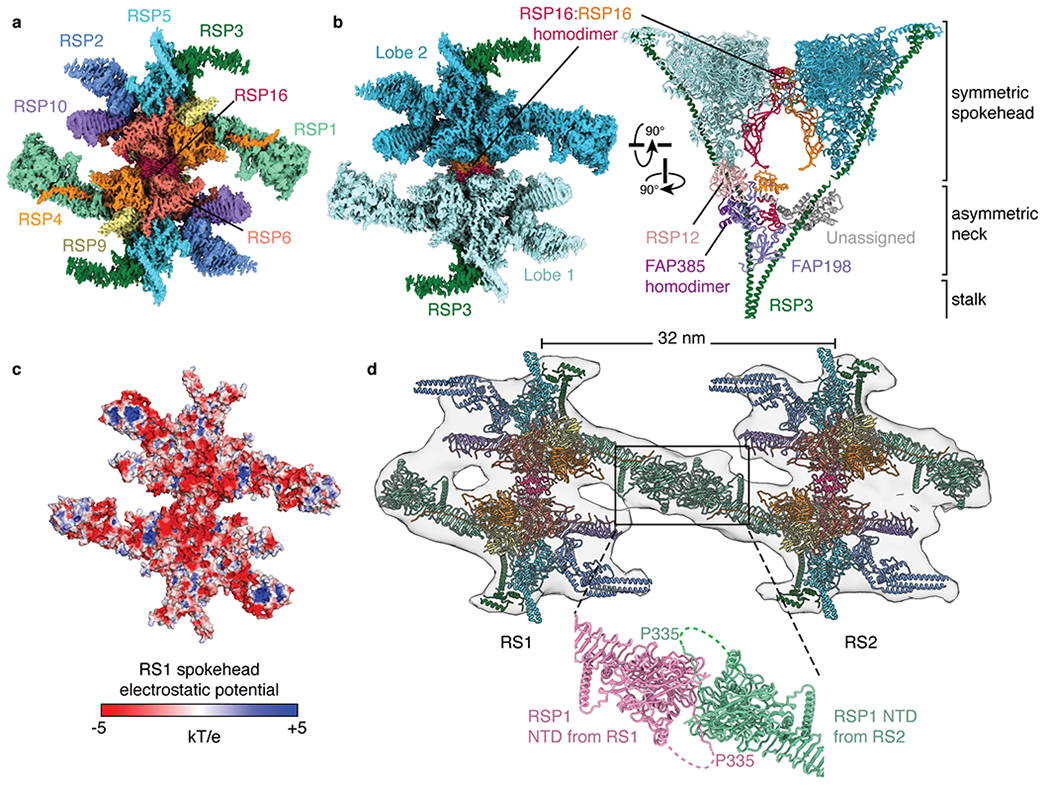
Fig. 3 |
Structure of the radial spokehead.
a, View of the top of the radial spokehead. Composite map colored by subunit. b , Two views of the radial spokehead. The two symmetric lobes of the spokehead (colored different shades of blue) are dim...
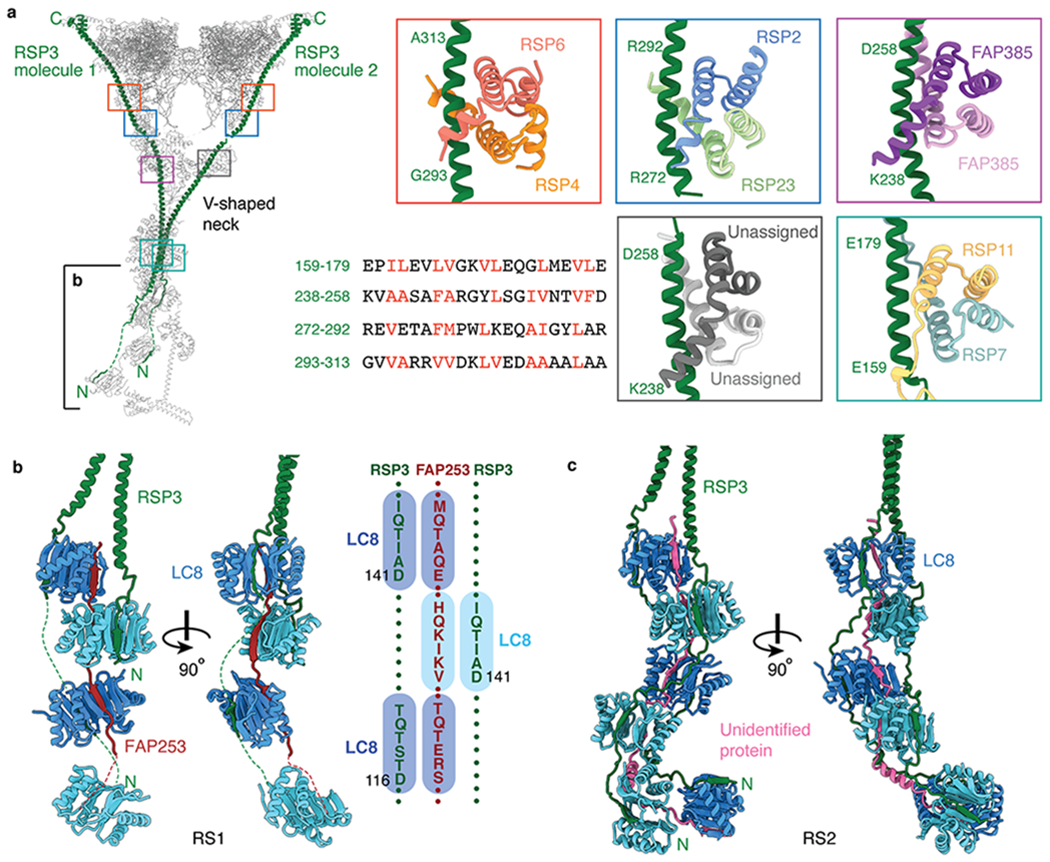
Fig. 4 |
Interactions between RSP3 and radial spoke proteins.
a , Left, atomic model of RS1 with its two molecules of RSP3 colored green. Colored boxes indicate the binding sites on RSP3 of five different dimers. The partially boxed proximal region of the stalk ...
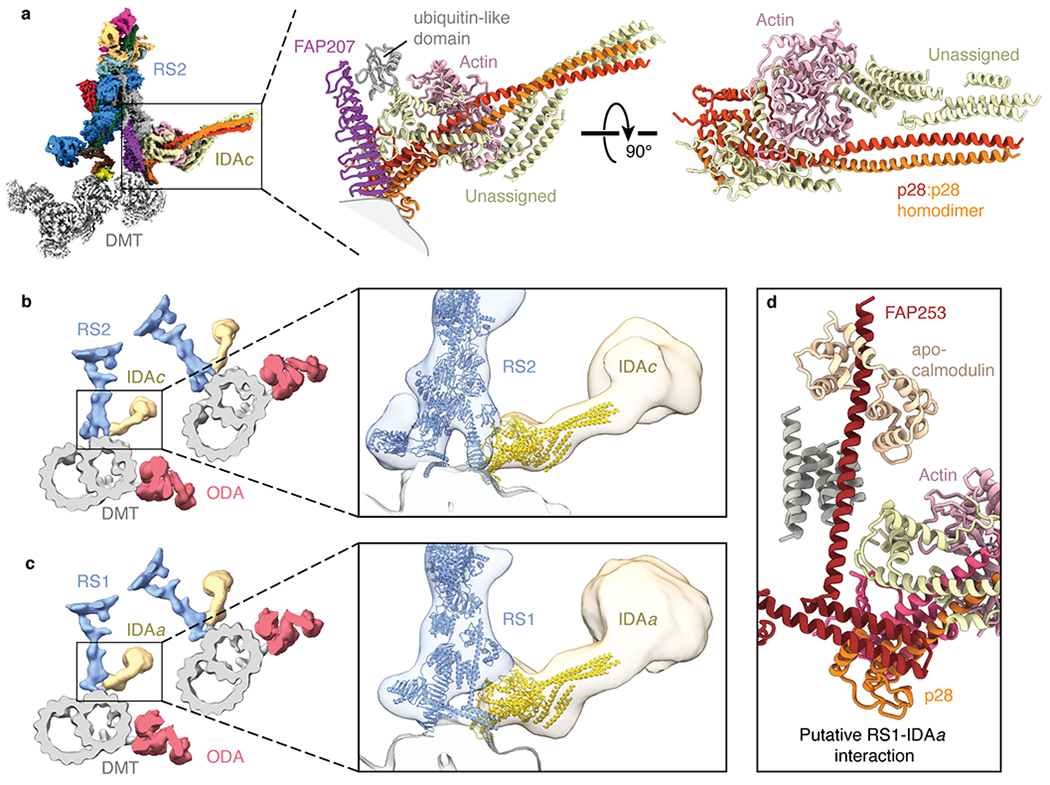
Fig. 5 |
IDA subforms a and c dock onto the bases of radial spokes.
a , Left, composite map showing the densities for the base of radial spoke 2 (RS2), inner dynein arm subform c (IDA c ), and the doublet microtubule (DMT). The maps of RS2 and IDA c are colored by sub...
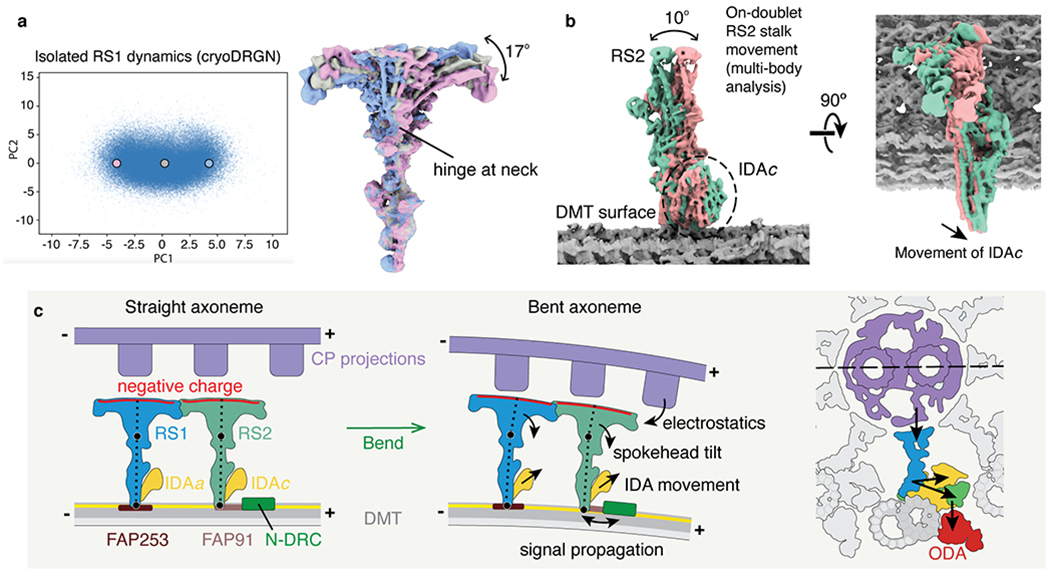
Fig. 6 |
Molecular basis for the control of IDA motor activity by mechanical signals.
a , Conformational dynamics of isolated radial spoke 1 (RS1) inferred from deep neural networks. Left, Principle component (PC) analysis projection of latent space. Density maps were generated at thre...
Figure images are served from the NIH/NLM PubMed Central Open Access Subset or Europe PMC; copyright remains with the publishers and authors.
💬 Discussion
0 commentsNo comments yet. Be the first to start a discussion!
Leave a Comment