Abstract
AbstractThe emergence of super-resolution (SR) fluorescence microscopy has rejuvenated the search for new cellular sub-structures. However, SR fluorescence microscopy achieves high contrast at the expense of a holistic view of the interacting partners and surrounding environment. Thus, we developed SR fluorescence-assisted diffraction computational tomography (SR-FACT), which combines label-free three-dimensional optical diffraction tomography (ODT) with two-dimensional fluorescence Hessian structured illumination microscopy. The ODT module is capable of resolving the mitochondria, lipid droplets, the nuclear membrane, chromosomes, the tubular endoplasmic reticulum, and lysosomes. Using dual-mode correlated live-cell imaging for a prolonged period of time, we observed novel subcellular structures named dark-vacuole bodies, the majority of which originate from densely populated perinuclear regions, and intensively interact with organelles such as the mitochondria and the nuclear membrane before ultimately collapsing into the plasma membrane. This work demonstrates the unique capabilities of SR-FACT, which suggests its wide applicability in cell biology in general.
🔬 Techniques
🔭 Microscopes
🧬 Organisms
✨ Fluorophores
🧪 Sample Preparation
🔬 Cell Lines
🏭 Microscope Brands
🧪 Reagent Suppliers
📷 Detectors
💻 Software Details
🏛️ Research Organizations (ROR)
Affiliated research institutions:
📋 Methods
Experimental implementation and image reconstruction of SR-FACT
To increase the temporal resolution while measuring the scattered optical field of light passing through biological samples due to the inhomogeneous distribution of the RI, we built an off-axis holographic ODT system based on a commercial microscope (IX73, Olympus) equipped with a galvo-mirror scanning mechanism. A schematic of the hardware setup is shown in Fig. 1a , while the full setup is shown in Supplementary Fig. S 2 and explained in detail in Supplementary Note 2 . In brief, we used a 561-nm single longitudinal-mode laser (MSL-FN-561-50 mW, Changchun New Industries Optoelectronics Technology) as the illumination source for ODT microscopy. The 561-nm light was divided into two beams by a polarization-dependent beam splitter (CCM1-PBS251, Thorlabs), of which one beam was used to illuminate the sample on the microscope stage, while the other served as a reference. The illuminating beam was controlled by galvo mirrors (2 × GVS211/M, Thorlabs) focused on the back focal plane of the water immersion objective (60×/1.0 W, LUMPlanFLN, Olympus), passed through the sample and the detection objective (100×/1.45 Oil, ApoN, Olympus) at a tilted angle, and finally combined with the reference beam to generate a hologram on the sCMOS camera (ORCA-Flash 4.0 V3, Hamamatsu), which provided sufficient total photon flux within 50 μs of exposure time. Because each image only captured information from a portion of the spatial frequency domain of the sample, we used a delicate time sequence to adjust the position of the focal point on the back focal plane of the illumination objective lens to record 240 raw holograms at different illumination angles (Supplementary Fig. S 3 ) and reconstructed the spatial frequency for the whole volume thereafter. Fig. 1 Hardware implementation, algorithm pipeline, and resolution benchmarking of SR-FACT. a Schematic diagram of the SR-FACT setup. b Flow chart of the ODT reconstruction algorithm. c Flow chart of the SIM reconstruction algorithm. d Representative example of a COS-7 cell labeled with LifeAct-EGFP imaged with SR-FACT. Scale bar, 5 μm. e Average intensity profiles of RIs (orange) and fluorescence (green) along lines orthogonal to the actin filaments (with the same filament at 50 time points); a representative example is shown in ( d ). f Average full width at half maximum (FWHM) values of the profiles orthogonal to the actin filament labeled by the lines in ( d ) measured at 50 different time points. Center lines, medians; limits, 75 and 25%; whiskers, maximum and minimum. The pipeline for the ODT image reconstruction is shown in Fig. 1b and is explained in detail in Supplementary Fig. S 4 . By conducting Fourier transformation of the raw images, spectrum filtering in the Fourier domain, and inverse Fourier transformation, we first extracted the amplitudes and phases from the experimental images at different time points. Due to the high scanning speed (~200 Hz) and the long recording time, we found that the mechanical wobbling and instability of the galvo mirrors led to deviation of the illumination wave vectors from the designated angles (Supplementary Fig. S 5 ), which significantly compromised both the contrast and the resolution of the reconstructed images. To address this problem, we designed the VISA algorithm, which precisely determines the actual illumination wave vectors and minimizes the residue slope of the unwrapped phase distribution extracted from the holographic recordings (Fig. 1b ; Supplementary Figs. S 6, S 7 ). In the third step, we used the first-order Rytov approximation (Eq. (7) in Supplementary Note 3 ) to estimate the scattering of light passing through live cells according to the different RIs exhibited by organelles. The amplitude and unwrapped phases derived from the 2D holograms were then recast in the 3D frequency domain. Because each illumination angle only provided a portion of the full scattering field of the cell, we stitched together the Rytov field distributions obtained at different illumination angles in the spatial frequency domain to perform the total field mapping. Finally, based on the measured coherent transfer function of the microscope (Supplementary Fig. S 8 ), we used Wiener filtering (Eq. (10) in Supplementary Note 3 ) to reconstruct the 3D distribution of the RIs within the cell. In the SIM configuration, we used a 488-nm single longitudinal-mode laser (Sapphire 488LP-200, Coherent) as the illumination source and an acoustic optical tunable filter (AOTF, AA Opto-Electronic, France) to adjust the illumination power. To generate and switch the various excitation patterns, we used a ferroelectric liquid crystal on a silicon spatial light modulator (SLM) (SXGA-3DM, Fourth Dimension Display) with a high frame rate. To maximize the modulation contrast of the excitation, we used a liquid crystal variable retarder (LVR-200-VIS-1L-TSC, Meadowlark) combined with a quarter-wave plate to rotate the polarization of the input beams to S-polarization. For the emission path, we designed a synchronization paradigm that efficiently coordinated the pattern generation of the SLM and the camera readout interval and used an sCMOS camera with 82% peak quantum efficiency (ORCA-Flash 4.0 V2, Hamamatsu) to detect the fluorescent emission (Fig. 1a ; Supplementary Fig. S 2 ). The steps used for the Hessian SIM reconstruction are outlined in Fig. 1c , while the detailed procedure can be found in our previous paper 14 , 15 . To ensure the ultrafast sampling of raw images and accurate switching between the ODT and SIM, we designed an intricate time sequence to synchronize the ODT and the SIM data acquisition (Supplementary Fig. S 3 ). The whole cycle of ODT and SIM acquisition took 1.49 s, which is fast enough to allow the same structure in a live cell to be examined alternatively by the two modalities. For example, by examining the same actin filament in filopodia in a COS-7 cell, we evaluated the resolutions of both modalities for the same filament structures. Using a Gaussian function to fit the intensity profiles of LifeAct-EGFP along cross-sections of the actin filament, we found that the resolution of Hessian SIM is ~100 nm (Fig. 1d–f ), which is consistent with previous results 14 . On the other hand, the scattered field in the ODT essentially caused a horizontal frequency shift in the detection frequency domain, which increased the lateral resolution. The full width at half maximum (FWHM) of the actin filament measured by our ODT microscope was ~200 nm (Fig. 1d–f ), which exceeded the conventional lateral resolution obtained by fluorescence microscopy at this wavelength and was consistent with the theoretical prediction given in Supplementary Note 7 (Supplementary Fig. S 9 ).
Show full methods section
Experimental implementation and image reconstruction of SR-FACT
To increase the temporal resolution while measuring the scattered optical field of light passing through biological samples due to the inhomogeneous distribution of the RI, we built an off-axis holographic ODT system based on a commercial microscope (IX73, Olympus) equipped with a galvo-mirror scanning mechanism. A schematic of the hardware setup is shown in Fig. 1a , while the full setup is shown in Supplementary Fig. S 2 and explained in detail in Supplementary Note 2 . In brief, we used a 561-nm single longitudinal-mode laser (MSL-FN-561-50 mW, Changchun New Industries Optoelectronics Technology) as the illumination source for ODT microscopy. The 561-nm light was divided into two beams by a polarization-dependent beam splitter (CCM1-PBS251, Thorlabs), of which one beam was used to illuminate the sample on the microscope stage, while the other served as a reference. The illuminating beam was controlled by galvo mirrors (2 × GVS211/M, Thorlabs) focused on the back focal plane of the water immersion objective (60×/1.0 W, LUMPlanFLN, Olympus), passed through the sample and the detection objective (100×/1.45 Oil, ApoN, Olympus) at a tilted angle, and finally combined with the reference beam to generate a hologram on the sCMOS camera (ORCA-Flash 4.0 V3, Hamamatsu), which provided sufficient total photon flux within 50 μs of exposure time. Because each image only captured information from a portion of the spatial frequency domain of the sample, we used a delicate time sequence to adjust the position of the focal point on the back focal plane of the illumination objective lens to record 240 raw holograms at different illumination angles (Supplementary Fig. S 3 ) and reconstructed the spatial frequency for the whole volume thereafter. Fig. 1 Hardware implementation, algorithm pipeline, and resolution benchmarking of SR-FACT. a Schematic diagram of the SR-FACT setup. b Flow chart of the ODT reconstruction algorithm. c Flow chart of the SIM reconstruction algorithm. d Representative example of a COS-7 cell labeled with LifeAct-EGFP imaged with SR-FACT. Scale bar, 5 μm. e Average intensity profiles of RIs (orange) and fluorescence (green) along lines orthogonal to the actin filaments (with the same filament at 50 time points); a representative example is shown in ( d ). f Average full width at half maximum (FWHM) values of the profiles orthogonal to the actin filament labeled by the lines in ( d ) measured at 50 different time points. Center lines, medians; limits, 75 and 25%; whiskers, maximum and minimum. The pipeline for the ODT image reconstruction is shown in Fig. 1b and is explained in detail in Supplementary Fig. S 4 . By conducting Fourier transformation of the raw images, spectrum filtering in the Fourier domain, and inverse Fourier transformation, we first extracted the amplitudes and phases from the experimental images at different time points. Due to the high scanning speed (~200 Hz) and the long recording time, we found that the mechanical wobbling and instability of the galvo mirrors led to deviation of the illumination wave vectors from the designated angles (Supplementary Fig. S 5 ), which significantly compromised both the contrast and the resolution of the reconstructed images. To address this problem, we designed the VISA algorithm, which precisely determines the actual illumination wave vectors and minimizes the residue slope of the unwrapped phase distribution extracted from the holographic recordings (Fig. 1b ; Supplementary Figs. S 6, S 7 ). In the third step, we used the first-order Rytov approximation (Eq. (7) in Supplementary Note 3 ) to estimate the scattering of light passing through live cells according to the different RIs exhibited by organelles. The amplitude and unwrapped phases derived from the 2D holograms were then recast in the 3D frequency domain. Because each illumination angle only provided a portion of the full scattering field of the cell, we stitched together the Rytov field distributions obtained at different illumination angles in the spatial frequency domain to perform the total field mapping. Finally, based on the measured coherent transfer function of the microscope (Supplementary Fig. S 8 ), we used Wiener filtering (Eq. (10) in Supplementary Note 3 ) to reconstruct the 3D distribution of the RIs within the cell. In the SIM configuration, we used a 488-nm single longitudinal-mode laser (Sapphire 488LP-200, Coherent) as the illumination source and an acoustic optical tunable filter (AOTF, AA Opto-Electronic, France) to adjust the illumination power. To generate and switch the various excitation patterns, we used a ferroelectric liquid crystal on a silicon spatial light modulator (SLM) (SXGA-3DM, Fourth Dimension Display) with a high frame rate. To maximize the modulation contrast of the excitation, we used a liquid crystal variable retarder (LVR-200-VIS-1L-TSC, Meadowlark) combined with a quarter-wave plate to rotate the polarization of the input beams to S-polarization. For the emission path, we designed a synchronization paradigm that efficiently coordinated the pattern generation of the SLM and the camera readout interval and used an sCMOS camera with 82% peak quantum efficiency (ORCA-Flash 4.0 V2, Hamamatsu) to detect the fluorescent emission (Fig. 1a ; Supplementary Fig. S 2 ). The steps used for the Hessian SIM reconstruction are outlined in Fig. 1c , while the detailed procedure can be found in our previous paper 14 , 15 . To ensure the ultrafast sampling of raw images and accurate switching between the ODT and SIM, we designed an intricate time sequence to synchronize the ODT and the SIM data acquisition (Supplementary Fig. S 3 ). The whole cycle of ODT and SIM acquisition took 1.49 s, which is fast enough to allow the same structure in a live cell to be examined alternatively by the two modalities. For example, by examining the same actin filament in filopodia in a COS-7 cell, we evaluated the resolutions of both modalities for the same filament structures. Using a Gaussian function to fit the intensity profiles of LifeAct-EGFP along cross-sections of the actin filament, we found that the resolution of Hessian SIM is ~100 nm (Fig. 1d–f ), which is consistent with previous results 14 . On the other hand, the scattered field in the ODT essentially caused a horizontal frequency shift in the detection frequency domain, which increased the lateral resolution. The full width at half maximum (FWHM) of the actin filament measured by our ODT microscope was ~200 nm (Fig. 1d–f ), which exceeded the conventional lateral resolution obtained by fluorescence microscopy at this wavelength and was consistent with the theoretical prediction given in Supplementary Note 7 (Supplementary Fig. S 9 ).
Materials and methods Cell maintenance and preparation
COS-7 cells were cultured in high-glucose DMEM (GIBCO, 21063029) supplemented with 10% fetal bovine serum (FBS) (GIBCO) and 1% 100 mM sodium pyruvate solution (Sigma-Aldrich, S8636) in an incubator at 37 °C with 5% CO 2 until ~75% confluency was reached. HUVECs were isolated and cultured in the M199 medium (Thermo Fisher Scientific, 31100035) supplemented with fibroblast growth factor, heparin, and 20% FBS (GIBCO) or in the ECM medium containing endothelial cell growth supplement (ECGS) and 10% FBS (GIBCO) in an incubator at 37 °C with 5% CO 2 until ~75% confluency was reached. INS-1 cells were cultured in the RPMI 1640 medium (GIBCO, 11835-030) supplemented with 10% FBS (GIBCO), 1% 100 mM sodium pyruvate solution, and 0.1% 55 mM 2-mercaptoethanol (GIBCO, 21985023) in an incubator at 37 °C with 5% CO 2 until ~75% confluency was reached. Human fibroblast cells were cultured in high-glucose DMEM (GIBCO, 21063029) supplemented with 20% FBS (GIBCO) in an incubator at 37 °C with 5% CO 2 until ~75% confluency was reached. All hMSCs were cultured in the hMSC culture medium containing 90% α-MEM + Glutamax (Gibco), 10% FBS (Gemcell, A77E01F), 1% penicillin/streptomycin (Gibco), and 1 ng/mL FGF2 (Joint Protein Central). Dorsal root ganglion (DRG) neurons were isolated from P10 rats. Isolated DRGs were removed from the excess roots and digested in dispase II (Roche, 10888700)/collagenase type II (Worthington Biochemical, LS004176 ) at 37 °C for 30 min and then centrifuged for another 35 min at room temperature. DRG neuronal cell bodies were seeded onto coverslips coated with 30 µg/ml poly-L-ornithine (Sigma, RNBG3346) and 5 µg/ml laminin (Roche, 11243217001) and cultured in neurobasal medium (GIBCO, 21103049) supplemented with 2% B-27 supplement (GIBCO, A3582801), 2 mM glutamine MAX (GIBCO, 35050061), and 1% penicillin/streptomycin (GIBCO, 15140122) in an incubator at 37 °C with 5% CO 2 . After 48 h of culture in vitro, the DRG neurons were ready for imaging. For the SR-FACT imaging experiments, cells were seeded onto coverslips (Thorlabs, CG15XH). To label mitochondria, COS-7 cells were incubated with 250 nM MitoTracker™ Green FM (Thermo Fisher Scientific, M7514) in HBSS containing Ca 2+ and Mg 2+ but no phenol red (Thermo Fisher Scientific, 14025076) at 37 °C for 15 min before being washed and imaged. To label LDs, COS-7 cells were incubated with 1 × LipidSpot TM 488 (Biotium, 70065-T) in complete cell culture medium at 37 °C for 30 min protected from light before being washed and imaged. To label LEs/LYs, COS-7 cells were incubated with 1 × LysoView TM 488 (Biotium, 70067-T) in complete cell culture medium at 37 °C for 15–30 min protected from light without washing and were then imaged. For the starvation experiments, COS-7 cells were incubated in complete medium or Hanks’ balanced salt solution (HBSS, Gibco 14025) for 18 h prior to imaging. Cos-7 cells were transfected with LifeAct-EGFP/KDEL-EGFP/Lamin A-EGFP/H2B-EGFP/LAMP1-EGFP/β1,4-galactosyltransferase 1 (B4GALT1)-EGFP/Pex11a-EGFP/LC3-EGFP/Rab7-EGFP/Rab5a-EGFP/Rab9a-EGFP/FYVE-EGFP/EEA1-EGFP/AQP-2-EGFP. Transfections were performed using Lipofectamine TM 2000 (Thermo Fisher Scientific, 11668019) according to the manufacturer’s instructions. Cells were imaged 24–36 h after transfection in a stage-top incubator (TOKAI HIT, INU-ON1-F1).
Coverslip preparation
To clean the coverslips prior to live-cell imaging, we immersed the coverslips in 10% powdered precision cleaner (Alconox, 1104-1) and sonicated the coverslips for 20 min. After rinsing in deionized water, the coverslips were sonicated in acetone for 15 min, and then sonicated again in 1 M NaOH or KOH for 20 min. Finally, we rinsed the coverslips with deionized water, followed by sonication three times for at least 5 min each time. The washed coverslips were stored in 95–100% ethanol at 4 °C.
Imaging data analysis and statistics ImageJ
(Fiji) was used to analyse the images. To analyse the DBs (Supplementary Fig. S 15 ), we applied thresholds to individual ODT image stacks for segmentation and calculated the densities of DBs in the Z planes of individual cells with nuclear membrane structures that were clearly visible. For the analysis of other organelles (Supplementary Fig. S 10 ), we manually annotated the ODT data set and segmented the LDs, LEs/LYs, and mitochondria. We calculated the areas of the LDs, LEs/LYs, and mitochondria within an axial volume of 0.86 μm (10 Z planes, with the layer containing the maximal number of organelles serving as the center) to match one Z plane for 2D-SIM and calculated the percentages with respect to the total areas of the LDs, LYs, and mitochondria within the whole cell. We manually tracked the movement of LYs (Supplementary Fig. S 1 ) and DBs (Fig. 5 ) using the ImageJ plugin TrackMate. MATLAB (Mathworks), OriginPro (OriginLab), Igor Pro (Wavemetrics), and Illustrator (Adobe) were used to analyse the data and to prepare the final images. The average results are shown as the mean ± SEM of the number of experiments indicated. The Mann–Whitney rank-sum test was used to evaluate the statistical significance (*, **, and *** denote p -values < 0.05, 0.01, and 0.001, respectively).
Supplementary information Supplementary Notes, Figures and Table Supplementary Video 1 Supplementary Video 2 Supplementary Video 3 Supplementary Video 4 Supplementary Video 5 Supplementary Video 6 Supplementary Video 7 Supplementary Video 8 Supplementary Video 9 Supplementary Video 10 Supplementary Video 11 Supplementary Video 12 Supplementary Video 13 Supplementary Video 14 Supplementary Video 15 Supplementary Video 16 Supplementary Video 17 Supplementary Video 18 Supplementary Video 19 Supplementary Video 20 Supplementary Video 21 Supplementary Video 22 Supplementary Video 23 Supplementary Video 24 Supplementary Video 25 Supplementary Video 26 Supplementary Video 27 Supplementary Video 28 Supplementary Video 29 Supplementary Video 30 Supplementary Video 31
📊 Figures
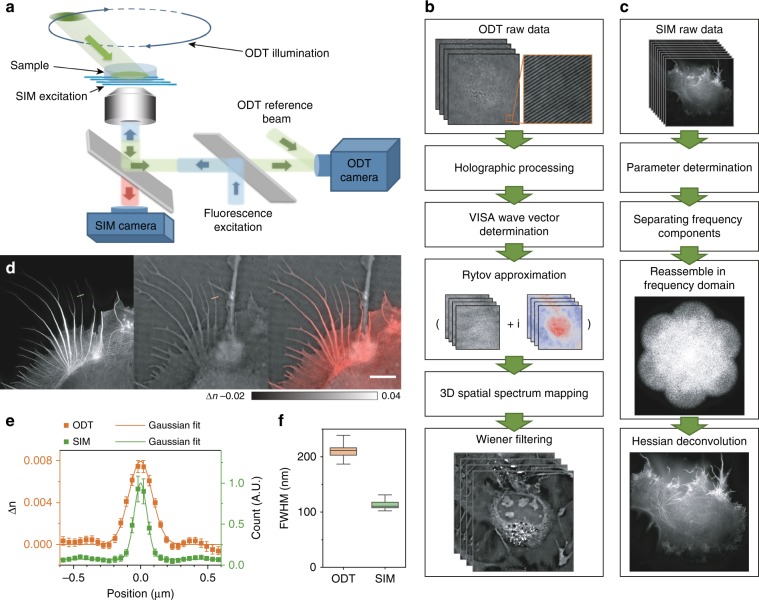
Fig. 1
Hardware implementation, algorithm pipeline, and resolution benchmarking of SR-FACT.
a Schematic diagram of the SR-FACT setup. b Flow chart of the ODT reconstruction algorithm. c Flow chart of the SIM reconstruction algorithm. d Representative example of a COS-7 cell labeled with Life...
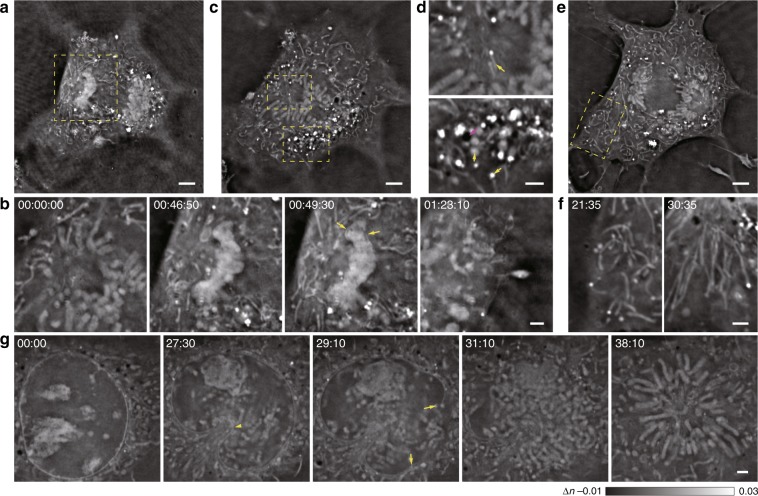
Fig. 2
Label-free visualization of the complete division process of a COS-7 cell in three dimensions, in which various subcellular structures are observed.
Cell division followed by late nuclear membrane emergence in one representative example of three similar replicates is shown in a u2013 f , and the disintegration of the nuclear membrane in another re...
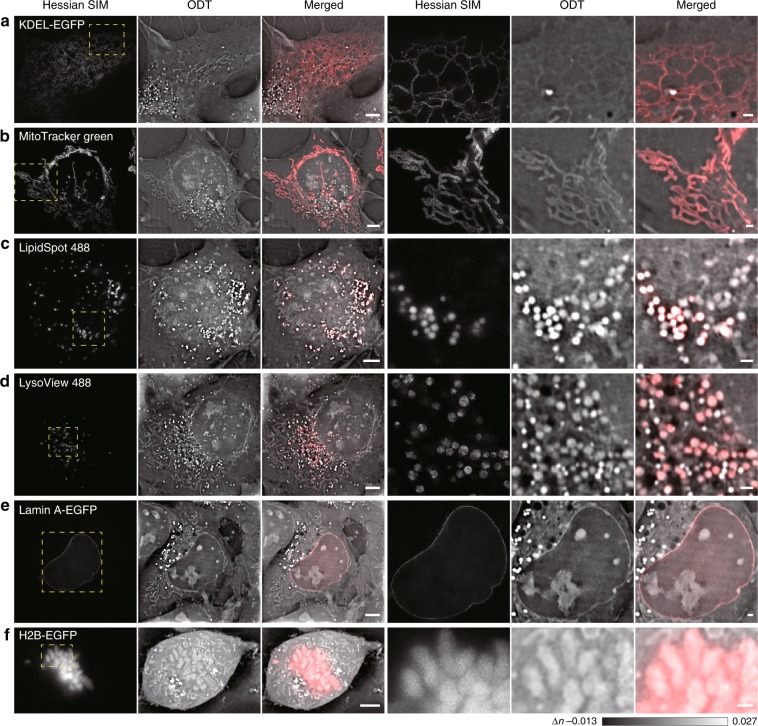
Fig. 3
Confirmed visualization of six conventional cellular organelles from ODT images.
The regions enclosed by the dashed yellow boxes on the left are enlarged on the right. a Observation of tubular ER structures in a live COS-7 cell from ODT images as confirmed by colocalization with K...
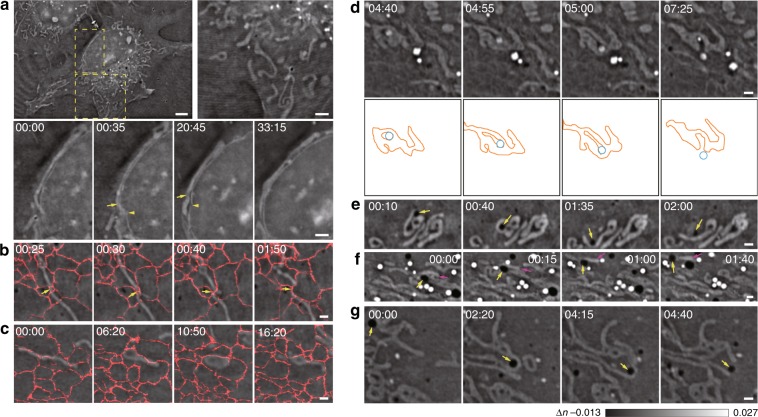
Fig. 4
Different dynamics of mitochondria interacting with other organelles.
a Representative examples of different shapes of cytosolic mitochondria and mitochondria associated with the nuclear membrane. In contrast to cytosolic mitochondria that have various shapes, lengths, ...
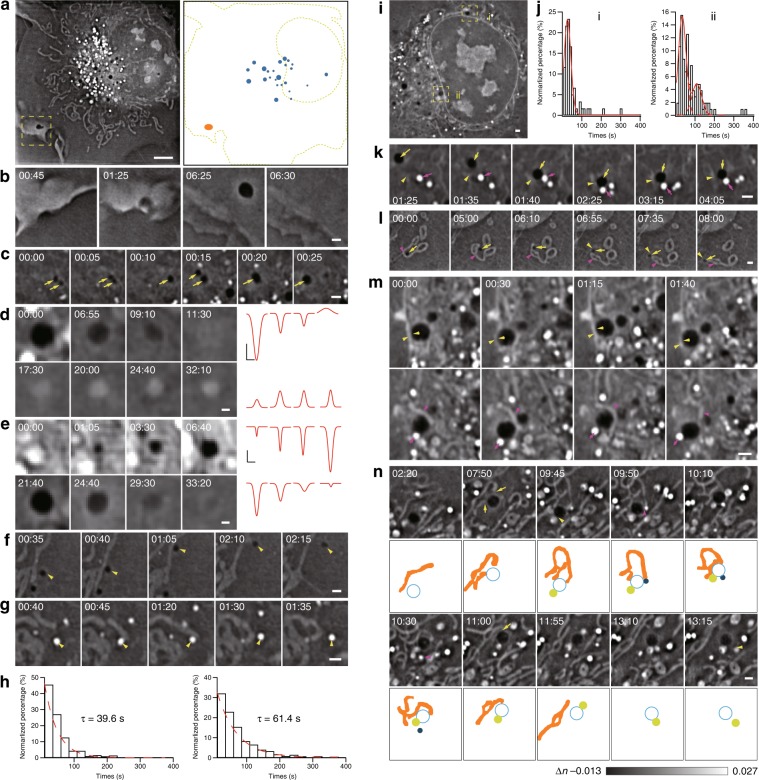
Fig. 5
Visualization of the trafficking routes of DBs and their role in organizing the organelle interactome.
a One Z plane of the COS-7 cell is shown at the time point of 00:49:30 (left), while the corresponding schematic diagram shows the distributions of DBs close to the nuclear membrane (blue) and the pla...
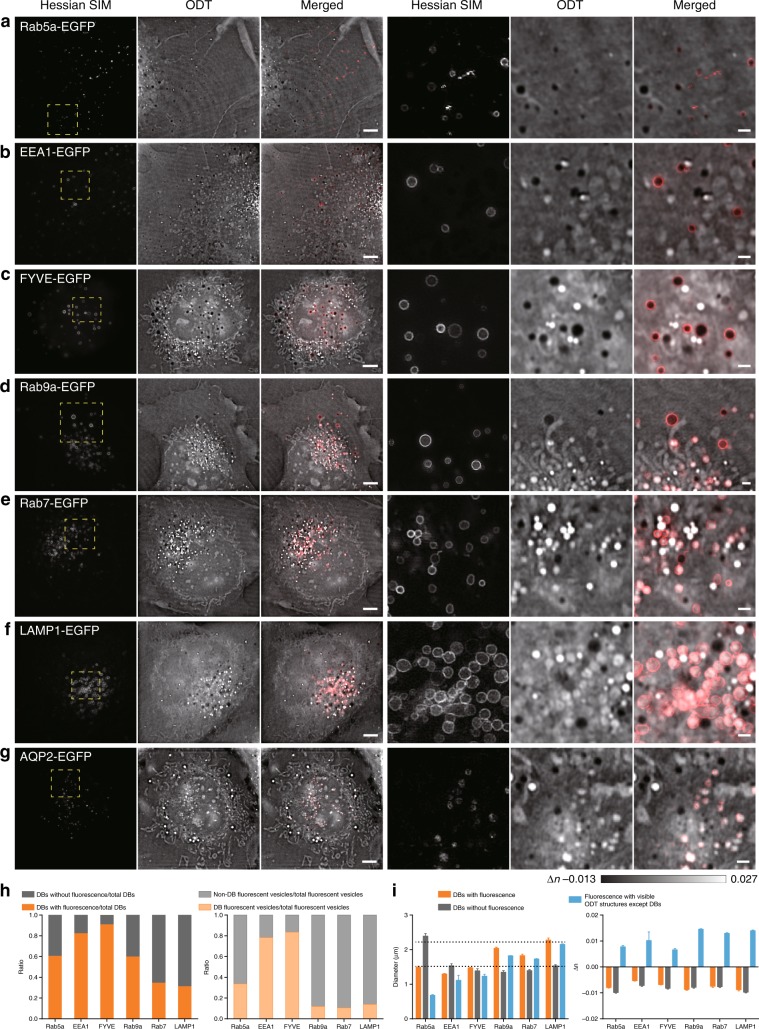
Fig. 6
DBs exhibited an overall distinct profile from that of conventional endosomal compartments, despite some shared protein markers.
The regions enclosed by the dashed yellow boxes on the left are enlarged on the right. a u2013 f Representative examples of the colocalization of DBs with Rab5a-EGFP- ( a ), EEA1-EGFP- ( b ), FYVE-EGF...
Figure images are served from the NIH/NLM PubMed Central Open Access Subset or Europe PMC; copyright remains with the publishers and authors.
💬 Discussion
0 commentsNo comments yet. Be the first to start a discussion!
Leave a Comment