Abstract
Over the last twenty years super-resolution fluorescence microscopy has gone from proof-of-concept experiments to commercial systems being available in many labs, improving the resolution achievable by up to a factor of 10 or more. There are three major approaches to super-resolution, stimulated emission depletion microscopy, structured illumination microscopy, and localisation microscopy, which have all produced stunning images of cellular structures. A major current challenge is optimising performance of each technique so that the same sort of data can be routinely taken in live cells. There are several major challenges, particularly phototoxicity and the speed with which images of whole cells, or groups of cells, can be acquired. In this review we discuss the various approaches which can be successfully used in live cells, the tradeoffs in resolution, speed, and ease of implementation which one must make for each approach, and the quality of results that one might expect from each technique.
🔬 Techniques
✨ Fluorophores
🧪 Sample Preparation
🏛️ Research Organizations (ROR)
Affiliated research institutions:
📋 Methods
High-density analysis methods
The methods discussed above can improve the rate at which raw data can be acquired, but the speed is always limited by the need to acquire data in which the point spread functions do not overlap. If this requirement can be lifted, fewer frames can be used to image the same number of molecules, cutting down the time required to acquire enough data to reconstruct a localisation microscopy image. When analysing images with overlapping point spread functions more information must be built into our model. We can either try to use information about the time domain, that is about how fluorophores blink and bleach, or about the spatial domain, where we could try to build in information about what overlapping fluorophores look like. Super-resolution optical fluctuation imaging (SOFI) ( Dertinger et al., 2009, 2010 ) builds in an assumption about the time domain that the blinking of fluorophores is uncorrelated. This method takes higher moments of the image series, which essentially sharpens the PSF by raising it to a power. The decrease in the point spread function that this generates leads to super-resolution, without any explicit model of the PSF or the underlying structure. SOFI is fast to compute, and can work with a range of fluorophores including quantum dots, organic fluorophores (when they are induced to blink) and fluorescent proteins, giving a resolution as low as 80 nm (measured in terms of ability to distinguish two adjacent features) with 72 s acquisition time for the raw data ( Geissbuehler et al., 2012 ). Alternatively, the fact that a fluorophore blinking or bleaching leads to a change from one frame to the next can be exploited to achieve localisation. A series of images can be taken, differences between the images are identified and modelled as arising from a fluorophore blinking or bleaching ( Burnette et al., 2011; Simonson et al., 2011 ), giving a resolution down to 65 nm with acquisition times down to 80 s, although both values vary considerably with the sample blinking properties. These methods enable relatively easy data acquisition, since fixed samples with standard embedding can be used (although low bleaching rates and a long lifetime for the non-emitting blinking state will allow a better resolution to be achieved). In the spatial domain, patches of the image which are too large to arise from single fluorophores can be fitted with multiple Gaussian peaks ( Holden et al., 2011; Huang et al., 2011 ), demonstrated on series with acquisition times between 200 s and 250 s. Alternatively, a compressed sensing approach can be taken ( Zhu et al., 2012 ), in which the generated image is assumed to be made up of a very fine, regular, and sparse grid of emitters, which is blurred by the PSF and then sampled. This approach takes 3 s to acquire the data required for a super-resolution image, reporting a resolution of 60 nm (though the resolution is defined by the density of detected fluorophores rather than the ability to separate two features, meaning it may not correspond to resolutions measured with other techniques). An alternative approach utilizes successive deconvolution of the images to improve the resolution ( Mukamel et al., 2012 ) (resolution estimated by theory to be 25 nm for 5000 frames of data). This has the advantage that it does not make assumptions about fluorophore appearances being well separated, although it does require the fluorophores to be far enough apart for a deconvolution to be able to separate them. It is also possible to build in both spatial and temporal information about the fluorophores into a model, an approach taken by Bayesian analysis of blinking and bleaching (3B analysis) ( Cox et al., 2012 ). The data is modelled as arising from a number of fluorophores undergoing blinking and bleaching. A very high degree of fluorophore overlap is possible. This has the added advantage that super-resolution data can be obtained from standard fluorescent proteins, rather than photoswitchable fluorophores or organic dyes. Superresolution images can be reconstructed from 4 s of data collected from standard fluorescent proteins with a spatial resolution of 50 nm, though the analysis requires a minimum of several hours computational time. The output is not a map of individual fluorophore positions as with other localisation methods, but is a probability map showing how the likelihood of a fluorophore being present varies spatially.
Show full methods section
High-density analysis methods
The methods discussed above can improve the rate at which raw data can be acquired, but the speed is always limited by the need to acquire data in which the point spread functions do not overlap. If this requirement can be lifted, fewer frames can be used to image the same number of molecules, cutting down the time required to acquire enough data to reconstruct a localisation microscopy image. When analysing images with overlapping point spread functions more information must be built into our model. We can either try to use information about the time domain, that is about how fluorophores blink and bleach, or about the spatial domain, where we could try to build in information about what overlapping fluorophores look like. Super-resolution optical fluctuation imaging (SOFI) ( Dertinger et al., 2009, 2010 ) builds in an assumption about the time domain that the blinking of fluorophores is uncorrelated. This method takes higher moments of the image series, which essentially sharpens the PSF by raising it to a power. The decrease in the point spread function that this generates leads to super-resolution, without any explicit model of the PSF or the underlying structure. SOFI is fast to compute, and can work with a range of fluorophores including quantum dots, organic fluorophores (when they are induced to blink) and fluorescent proteins, giving a resolution as low as 80 nm (measured in terms of ability to distinguish two adjacent features) with 72 s acquisition time for the raw data ( Geissbuehler et al., 2012 ). Alternatively, the fact that a fluorophore blinking or bleaching leads to a change from one frame to the next can be exploited to achieve localisation. A series of images can be taken, differences between the images are identified and modelled as arising from a fluorophore blinking or bleaching ( Burnette et al., 2011; Simonson et al., 2011 ), giving a resolution down to 65 nm with acquisition times down to 80 s, although both values vary considerably with the sample blinking properties. These methods enable relatively easy data acquisition, since fixed samples with standard embedding can be used (although low bleaching rates and a long lifetime for the non-emitting blinking state will allow a better resolution to be achieved). In the spatial domain, patches of the image which are too large to arise from single fluorophores can be fitted with multiple Gaussian peaks ( Holden et al., 2011; Huang et al., 2011 ), demonstrated on series with acquisition times between 200 s and 250 s. Alternatively, a compressed sensing approach can be taken ( Zhu et al., 2012 ), in which the generated image is assumed to be made up of a very fine, regular, and sparse grid of emitters, which is blurred by the PSF and then sampled. This approach takes 3 s to acquire the data required for a super-resolution image, reporting a resolution of 60 nm (though the resolution is defined by the density of detected fluorophores rather than the ability to separate two features, meaning it may not correspond to resolutions measured with other techniques). An alternative approach utilizes successive deconvolution of the images to improve the resolution ( Mukamel et al., 2012 ) (resolution estimated by theory to be 25 nm for 5000 frames of data). This has the advantage that it does not make assumptions about fluorophore appearances being well separated, although it does require the fluorophores to be far enough apart for a deconvolution to be able to separate them. It is also possible to build in both spatial and temporal information about the fluorophores into a model, an approach taken by Bayesian analysis of blinking and bleaching (3B analysis) ( Cox et al., 2012 ). The data is modelled as arising from a number of fluorophores undergoing blinking and bleaching. A very high degree of fluorophore overlap is possible. This has the added advantage that super-resolution data can be obtained from standard fluorescent proteins, rather than photoswitchable fluorophores or organic dyes. Superresolution images can be reconstructed from 4 s of data collected from standard fluorescent proteins with a spatial resolution of 50 nm, though the analysis requires a minimum of several hours computational time. The output is not a map of individual fluorophore positions as with other localisation methods, but is a probability map showing how the likelihood of a fluorophore being present varies spatially.
📊 Figures
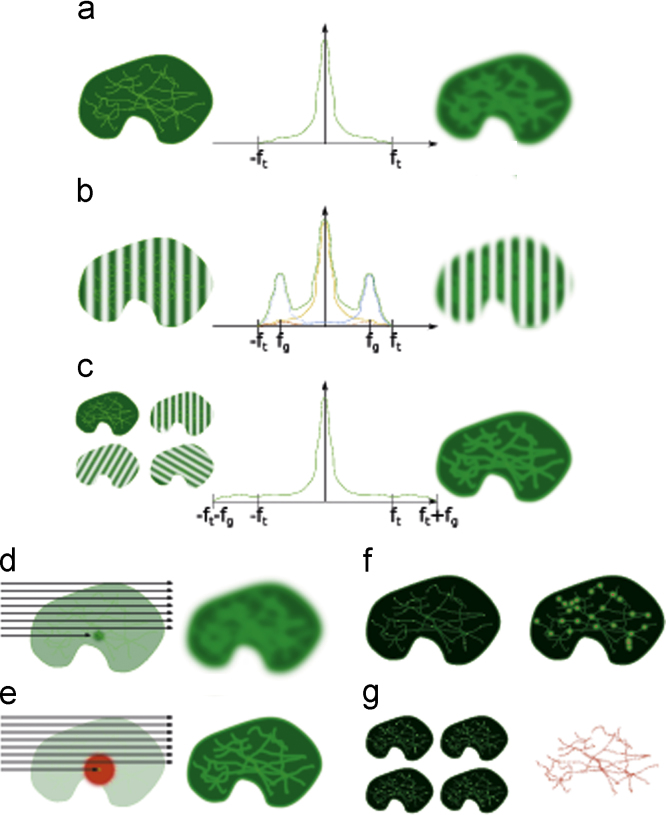
Fig.u00a01
Fluorescence super-resolution methods. (a) Structured illumination microscopy. When a sample (left) is imaged, the resultant image is convolved with the point spread function of the microscope (right)...
Figure images are served from the NIH/NLM PubMed Central Open Access Subset or Europe PMC; copyright remains with the publishers and authors.
💬 Discussion
0 commentsNo comments yet. Be the first to start a discussion!
Leave a Comment