Abstract
Abstract Genomic DNA is folded into a higher-order structure that regulates transcription and maintains genomic stability. Although progress has been made on understanding biochemical characteristics of epigenetic modifications in cancer, the in-situ higher-order folding of chromatin structure during malignant transformation remains largely unknown. Here, using optimized stochastic optical reconstruction microscopy (STORM) for pathological tissue (PathSTORM), we uncover a gradual decompaction and fragmentation of higher-order chromatin folding throughout all stages of carcinogenesis in multiple tumor types, and prior to tumor formation. Our integrated imaging, genomic, and transcriptomic analyses reveal functional consequences in enhanced transcription activities and impaired genomic stability. We also demonstrate the potential of imaging higher-order chromatin disruption to detect high-risk precursors that cannot be distinguished by conventional pathology. Taken together, our findings reveal gradual decompaction and fragmentation of higher-order chromatin structure as an enabling characteristic in early carcinogenesis to facilitate malignant transformation, which may improve cancer diagnosis, risk stratification, and prevention.
🔬 Techniques
🧬 Organisms
✨ Fluorophores
🧪 Sample Preparation
🔬 Cell Lines
🏭 Microscope Brands
🧪 Reagent Suppliers
💻 Software Details
💾 Data Repositories
🏛️ Research Organizations (ROR)
Affiliated research institutions:
📋 Methods
Immunofluorescence staining of tissue samples
All animal studies were performed in accordance with the institutional Animal Care and Use Committee at the University of Pittsburgh. All mice were housed in micro isolator cages in a temperature- (68–79 °F) and humidity (30–70% relatively humidity)-controlled room illuminated from 7:00 a.m. to 7:00 p.m. (12 h:12 h light–dark cycle), with access to water and chow ad libitum. The use of tissue blocks from deidentified patients was approved by the Institutional Review Board at University of Pittsburgh. FFPE tissue blocks taken from mouse models or patients were used in our study. The 3-µm-thick tissue sections mounted on the Poly- d -lysine (PDL)-coated coverslips were deparaffinized in xylene and rehydrated in graded ethanol and finally in distilled water. Cover glasses were then transferred to a preheated Tris-EDTA (Ethylenediaminetetraacetic acid) buffer solution (94–96 °C, containing 10 mM Tris Base, 1 mM EDTA, and 0.05% Tween 20, pH 9.0) and heated in a microwave for antigen retrieval. Sections were then washed in PBS (Phosphate buffered saline) and treated with 0.1% solution of sodium borohydride (Sigma-Aldrich) in PBS on ice to reduce autofluorescence. The sections were then permeabilized with 0.2% Triton X-100 (Sigma-Aldrich) in PBS. To block against non-specific binding, the sections were incubated with a blocking solution containing 3% BSA (Bovine serum albumin) and 0.2% Triton X-100 diluted in PBS for 1 h at room temperature. Then the sections were incubated with primary antibodies diluted to optimized concentrations at 4 °C overnight: rabbit polyclonal to H3K4me3 (1:300, ab8580, Abcam), rabbit polyclonal to H3K27me3 (1:300, Cat.07-449, Millipore), rabbit polyclonal to H4ac (1:200, Cat.06-598, Millipore), rabbit polyclonal to H3K9me3 (1:300, Cat.07-523, Millipore), mouse monoclonal to RNAP II (1:300, ab5408, abcam), mouse monoclonal to Ki67 (1:200, Cell Signaling Technology, #9449s), rabbit polyclonal to KMT1A/SUV39H1 antibody (1:100, Novus Biologicals, NBP2-17086) and mouse monoclonal to γ-H2AX (Ser 139) antibody (1:100, Santa Cruz Biotechnology, sc-517348). Then Alexa Fluor 647-conjugated donkey-anti-rabbit/mouse secondary antibody (1:200, Alexa Fluor 647 carboxylic acid succinimidyl ester, ThermoFisher, A20006; Donkey anti-rabbit antibody, Jackson ImmunoResearch, 711-005-152) was applied to the sections at room temperature for 2 h in the dark. Sections were then post-fixed in 4% paraformaldehyde for 10 min. The 60% of 2,2-thiodiethanol (TDE, Sigma-Aldrich) in PBS was used to optically clear the tissue sections for ~20–30 min. The fluorescent beads (FluoSpheres carboxylate, F8803, Thermo Fisher Scientific) were added into the sample dish as fiduciary markers used for drift correction based on our previously published method 25 . DNA staining in tissue section The DNA from FFPE tissue sections was stained by TOTO™-3 Iodide (Thermo Fisher Scientific). The tissue section was first treated as described above before the blocking step and then treated with 50 µg/mL DNase-free RNase at 37 °C for 30 min. Then the tissue section was incubated with 100 nM TOTO-3 for 30 min at room temperature. After being washed three times in PBS, the sample was optically cleared as described above, now ready for STORM imaging. STORM imaging buffer for TOTO-3 stained tissue consists of 60% TDE (v/v), 10% (w/v) glucose, 0.56 mg/mL glucose oxidase and 0.17 mg/mL catalase.
Show full methods section
Immunofluorescence staining of tissue samples
All animal studies were performed in accordance with the institutional Animal Care and Use Committee at the University of Pittsburgh. All mice were housed in micro isolator cages in a temperature- (68–79 °F) and humidity (30–70% relatively humidity)-controlled room illuminated from 7:00 a.m. to 7:00 p.m. (12 h:12 h light–dark cycle), with access to water and chow ad libitum. The use of tissue blocks from deidentified patients was approved by the Institutional Review Board at University of Pittsburgh. FFPE tissue blocks taken from mouse models or patients were used in our study. The 3-µm-thick tissue sections mounted on the Poly- d -lysine (PDL)-coated coverslips were deparaffinized in xylene and rehydrated in graded ethanol and finally in distilled water. Cover glasses were then transferred to a preheated Tris-EDTA (Ethylenediaminetetraacetic acid) buffer solution (94–96 °C, containing 10 mM Tris Base, 1 mM EDTA, and 0.05% Tween 20, pH 9.0) and heated in a microwave for antigen retrieval. Sections were then washed in PBS (Phosphate buffered saline) and treated with 0.1% solution of sodium borohydride (Sigma-Aldrich) in PBS on ice to reduce autofluorescence. The sections were then permeabilized with 0.2% Triton X-100 (Sigma-Aldrich) in PBS. To block against non-specific binding, the sections were incubated with a blocking solution containing 3% BSA (Bovine serum albumin) and 0.2% Triton X-100 diluted in PBS for 1 h at room temperature. Then the sections were incubated with primary antibodies diluted to optimized concentrations at 4 °C overnight: rabbit polyclonal to H3K4me3 (1:300, ab8580, Abcam), rabbit polyclonal to H3K27me3 (1:300, Cat.07-449, Millipore), rabbit polyclonal to H4ac (1:200, Cat.06-598, Millipore), rabbit polyclonal to H3K9me3 (1:300, Cat.07-523, Millipore), mouse monoclonal to RNAP II (1:300, ab5408, abcam), mouse monoclonal to Ki67 (1:200, Cell Signaling Technology, #9449s), rabbit polyclonal to KMT1A/SUV39H1 antibody (1:100, Novus Biologicals, NBP2-17086) and mouse monoclonal to γ-H2AX (Ser 139) antibody (1:100, Santa Cruz Biotechnology, sc-517348). Then Alexa Fluor 647-conjugated donkey-anti-rabbit/mouse secondary antibody (1:200, Alexa Fluor 647 carboxylic acid succinimidyl ester, ThermoFisher, A20006; Donkey anti-rabbit antibody, Jackson ImmunoResearch, 711-005-152) was applied to the sections at room temperature for 2 h in the dark. Sections were then post-fixed in 4% paraformaldehyde for 10 min. The 60% of 2,2-thiodiethanol (TDE, Sigma-Aldrich) in PBS was used to optically clear the tissue sections for ~20–30 min. The fluorescent beads (FluoSpheres carboxylate, F8803, Thermo Fisher Scientific) were added into the sample dish as fiduciary markers used for drift correction based on our previously published method 25 . DNA staining in tissue section The DNA from FFPE tissue sections was stained by TOTO™-3 Iodide (Thermo Fisher Scientific). The tissue section was first treated as described above before the blocking step and then treated with 50 µg/mL DNase-free RNase at 37 °C for 30 min. Then the tissue section was incubated with 100 nM TOTO-3 for 30 min at room temperature. After being washed three times in PBS, the sample was optically cleared as described above, now ready for STORM imaging. STORM imaging buffer for TOTO-3 stained tissue consists of 60% TDE (v/v), 10% (w/v) glucose, 0.56 mg/mL glucose oxidase and 0.17 mg/mL catalase.
STORM image reconstruction
Prior to image reconstruction, the background correction based on extreme-value-based emitter recovery 22 was applied, summarized as follows: (1) transform the intensity value from digital counts to physical photons; (2) segment it into a series of substacks (e.g. 100-frame where the background variation undergoes slow variation); (3) calculate the minimum value of each pixel along the temporal axis for each substack; and (4) calculate the expected background value according to our derived photon statistics model to obtain the expected background value and the temporal minima. After background correction, we adopted a computationally efficient emitter-subtraction method, which is a variant of Gaussian deflation method used in high-density localization algorithms 53 , 54 to restore the individual overlapped molecules by subtracting surrounding emitters without the computationally intensive iterative least squares fitting, followed by our previously developed single-iteration localization algorithm—gradient fitting 55 for fast and precise single-molecule localization. All above procedures are simple mathematical operations, and thus can be efficiently implemented in GPUs for parallel processing. The reconstructed super-resolution image was rendered by accumulating all the valid molecules with a pixel size of 13 nm.
Quantitative image analysis
Quantitative analysis of the reconstructed image was performed with a custom software written in MATLAB 2019 (Mathworks). We first segmented the epithelial cell nuclei using a semi-automated method and manual segmentation 16 . The localized point coordinates that form STORM images of H3K9me3 were clustered based on Gaussian mixed model (see Supplementary Fig. 20 ) to calculate cluster size and localizations per cluster 16 . RDF was determined by the density of localized spots as a function of distance to other localized spots for each nucleus 16 . For two-color STORM images, to correct for chromatic aberration, we used low-density multicolor fluorescence beads (TetraSpeck microspheres, 0.1 µm diameter, blue/green/orange/dark red fluorescence, Fisher Scientific) to generate the transform map 16 . Voronoi tessellation was conducted for each nucleus, using the unique STORM coordinates as input arguments. The “voronoin” function in MATLAB R2019a was implemented, resulting in a set of region cells and diagram vertices which were used to calculate the area of each Voronoi polygon using “polyarea” function. Voronoi density was then calculated for each polygon as the inverse function of the polygon area. The values were then replotted at their corresponding point coordinates as a Voronoi density map 28 , 56 . The map was then smoothed using the Gaussian filter function “imgaussfilt” with a sigma of 2. A Watershed segmentation algorithm was applied to the DNA density map, in order to segment the STORM points into localized groups or clusters 57 . The algorithm begins with the localization of the regional intensity maxima of the smoothed density map, conducted using “imregionalmax” function in MATLAB. The resultant binary map of maxima points was dilated using a disk-shaped kernel with a diameter of 5 pixels, then a distance transform of the inverse dilated map was calculated using the “bwdist” function. The resultant distance map was amplified by a factor of 2 before being added to a binary version of the smoothed density map. The density map was made binary by setting all values greater than zero to one. The watershed segmentation was then calculated on the negative of the added image and the segments outside of the binary density map region were rejected. Very small segments with a total pixel area less than 20 were also rejected from the final segmentation map. The examples of the watershed segmentation for the STORM images of DNA are shown in Supplementary Fig. 21 . To calculate the percentage of covered nuclei area by DNA, the reconstructed STORM image was first applied to a Gaussian filter ( σ = 1) and the number of pixels with the value of greater than 0.5 divided by the total number of pixels for each nucleus mask is defined as the percentage of the covered nuclei area. The colocalization of DNA and active RNAPII was performed in two ways: the pixels in DNA that are overlapped with active RNAPII divided by the total number of pixels from DNA and the pixels in active RNAPII that are overlapped with DNA divided by the total number of pixels from active RNAPII, respectively. 3D-SIM image analysis 3D-SIM images were acquired by N-SIM system (Nikon). We performed 3D nucleus segmentation on the reconstructed 3D-SIM image via the following four steps: (1) Background was removed via a 3D median filter with a radius of 5 µm to estimate the local background caused by autofluorescence, which was subtracted from the SIM image. (2) To identify each 3D nucleus along the axial direction, we track the peak intensity distribution along the axial center position of the nucleus. (3) In the initial nucleus segmentation, at the axial position with the maximum intensity, the region of the nucleus was first manually selected by tracking the border of the nucleus, in which the central position was calculated. The precise border of each nucleus was then adaptively defined by finding the fastest changing gradient along each radial direction. This process was repeated for all axial positions above and below the central plane, for 3D nuclei segmentation. Finally, to calculate DNA occupancy, the voxels with an intensity larger than three times of square root of the background were recognized as the regions with valid signals. DNA occupancy was defined as the percentage of voxels with valid signals over the total number of voxels for each 3D nucleus. CUT&RUN A total of eight mice including two Apc Min/+ mice (Jackson Laboratory), two age-matched wild-type mice at 6 weeks and two Apc Min/+ mice, two age-matched wild-type mice at 12 weeks were sacrificed, and their normal-appearing small intestine were removed and washed with PBS. After scraping villi cells from mouse intestine, cells were pelleted, washed with cold PBS, and nuclei were extracted in a hypotonic buffer (NE buffer; 20 mM HEPES-KOH pH 7.9, 10 mM KCl, 0.5 mM Spermidine, 0.1% TritonX-100, 20% glycerol, and freshly added protease inhibitors). CUT&RUN was performed as previously described 30 . Briefly, lectin-coated Concanavalin A beads (Polysciences) were prepared using binding buffer (20 mM HEPES-KOH pH 7.9, 10 mM KCl, 1 mM CaCl 2 , 1 mM MnCl 2 ), and nuclei were bound to beads. Bead-bound nuclei were washed (wash buffer; 20 mM HEPES-KOH pH 7.5, 150 mM NaCl, 0.5 mM Spermidine, 0.1% BSA, and freshly added protease inhibitors) and primary (H3K9me3, abcam ab8898; H3K4me3, Millipore 05-745R; or total H3, abcam ab1791) was added to individual reactions. After a 2-h incubation at 4 °C with rotation and two washes in Wash Buffer, recombinant protein A-micrococcal nuclease (MNase) was added to identify the primary antibody. Following two washes in wash buffer, MNase cleavage was initiated with addition of 3 mM CaCl 2 , samples were incubated on a water-ice bath for 30 min and the reaction was chelated with addition of EDTA and EGTA (3,12-bis(carboxymethyl)-6,9-dioxa-3,12-diazatetradecane-1,14-dioic acid). RNAs were digested, and protected DNA fragments were released through centrifugation to separate solubilized DNA and protein from insoluble chromatin. Proteins were digested using Proteinase K, samples were purified through phenol chloroform extraction followed by chloroform extraction, and ethanol precipitated with glycogen. Libraries were prepared using Illumina protocols: end repair, A-tailing, and barcoded adapter ligation followed by PCR amplification and size selection. The integrity of the libraries was confirmed by quBit quantification, fragment analyzer size distribution assessment, and Sanger sequencing of ~10 fragments from each library. Libraries were sequenced using paired-end Illumina sequencing. To analyze the data, reads were trimmed using Novocraft. Paired-end reads were aligned to mm10 using Bowtie2 58 against the entire mouse genome (including repeat regions using RepeatMasker) with the parameters -N 1 and -X 1000. PCR duplicates were removed using Picard ( http://broadinstitute.github.io/picard/ ) and reads with low quality score (MAPQ < 10) were removed using samtools. Reads sized 150–500 bp were separated for histone modifications. These reads were then processed in HOMER 59 . Reads were visualized at individual locations using the “makeUCSCfile” command. Mapped reads were aligned over major satellite regions of the genome using the “annotatePeaks” command to make 20 bp bins over regions of interest and sum the reads within each bin. Peaks were independently called using the “findPeaks” command, using the “no antibody” control for background signal, to identify all binding sites throughout the genome. Peaks were compared between control and experimental samples using the “mergePeaks” command. Motifs were identified using the “findMotifs” command.
RNA-seq and transcriptomic analysis Whole-genome strand-specific
RNA-seq was used to profile RNA expression levels in intestinal cells from the same 6- and 12-week Apc Min/+ mice and age-matched wild-type mice used for CUT&RUN experimentation. RNA-Seq libraries were prepared as described previously 60 and in the literature 61 . RNA was extracted from intestinal cells using TRIzol followed by column purification (Zymo RNA clean and concentrator column) following the manufacturers’ instructions. Total RNA was depleted of rRNA using a Ribo-Zero Gold kit and first-strand cDNA was synthesized. Subsequently, second-strand cDNA was synthesized, purified, and fragmented. RNA-seq libraries were prepared using Illumina technology, in a similar way as CUT&RUN libraries described above. Paired-end reads were aligned to mm10 (mouse models) using RSEM 62 . We assessed the transcripts per million (TPM) changed and visualized the gene expression changes in the wild-type and Apc Min/+ mice. RSEM output files were used for downstream analysis using HOMER 59 . DESeq2 63 was used to identify the differentially expressed genes based on significance. To sort the data, K-means clustering was performed using Cluster 3.0 64 and heatmaps were generated using Java TreeView 65 . Gene Ontology (GO) term enrichment was performed to identify gene classes that are mis-regulated using Metascape software 66 . We integrated RNA-seq and CUT&RUN data to determine the direct effects of changes in heterochromatin structure on gene expression changes, in which the GO term analysis was performed to identify the direct target molecular pathways due to disrupted heterochromatin structure.
Statistics and reproducibility
All statistical comparisons were made between two groups, calculated using non-parametric Mann–Whitney U test in GraphPad Prism 7.0 and two-tailed P value at 95% confidence interval was presented throughout the manuscript. Animal experiments were repeated from three mice and all experiments with cell lines were repeated for more than three times with similar results. All imaging data—performed on approximately 10–300 cells—were quantified and statistically analyzed. The average cluster size and nearest neighbor distance (nnd) were calculated for each nucleus as a data point. In the box-and-whisker plot, the central line of the box indicates the median; the bottom/top edges of the box indicate 25th/75th percentiles; the whiskers extend to the most extreme data points without outliers throughout the manuscript. Reporting summary Further information on research design is available in the Nature Research Reporting Summary linked to this article.
Supplementary information Supplementary Information Reporting Summary
📊 Figures
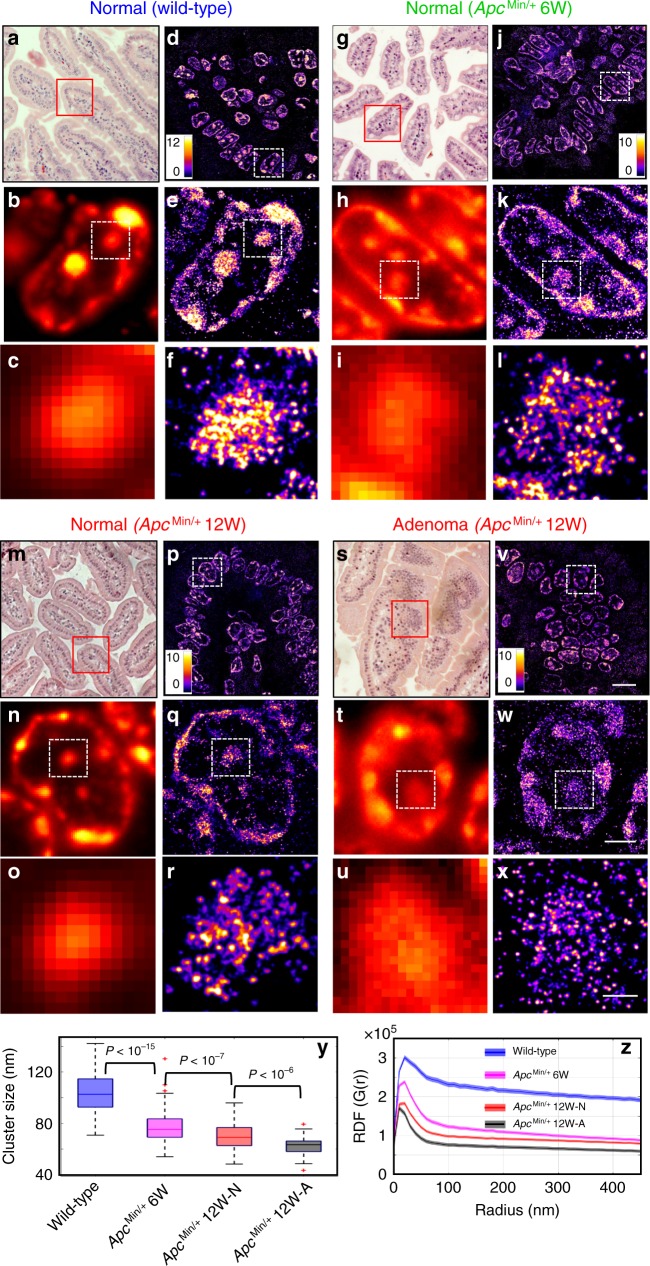
Fig. 1
Super-resolution imaging of heterochromatin structure in Apc Min/+ mouse model.
a , g , m , s H&E-stained pathology images and d , j , p , v STORM-based super-resolution images of H3K9me3-dependent heterochromatin from normal tissue from wild-type, histologically normal-appearing...
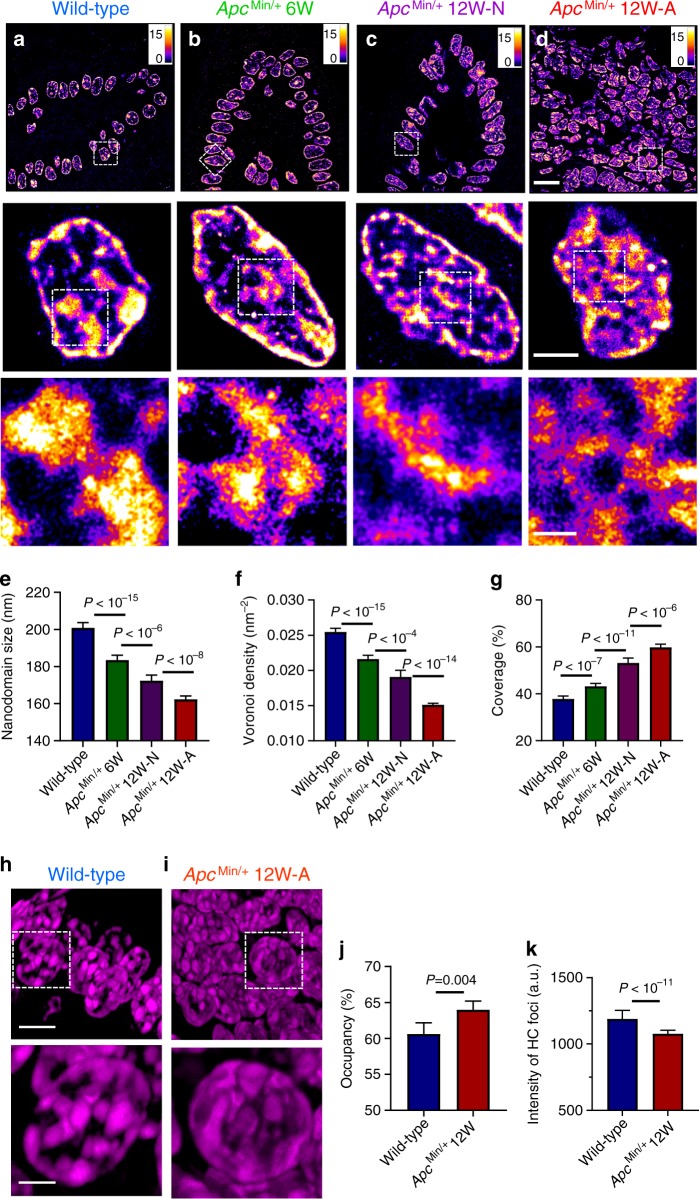
Fig. 2
Super-resolution imaging of DNA in Apc Min/+ mouse model.
a u2013 d STORM images of DNA folding from normal cells from wild-type, histologically normal-appearing cells from 6-week and 12-week Apc Min/+ , and tumor cells from 12-week Apc Min/+ mice. Scale bar...
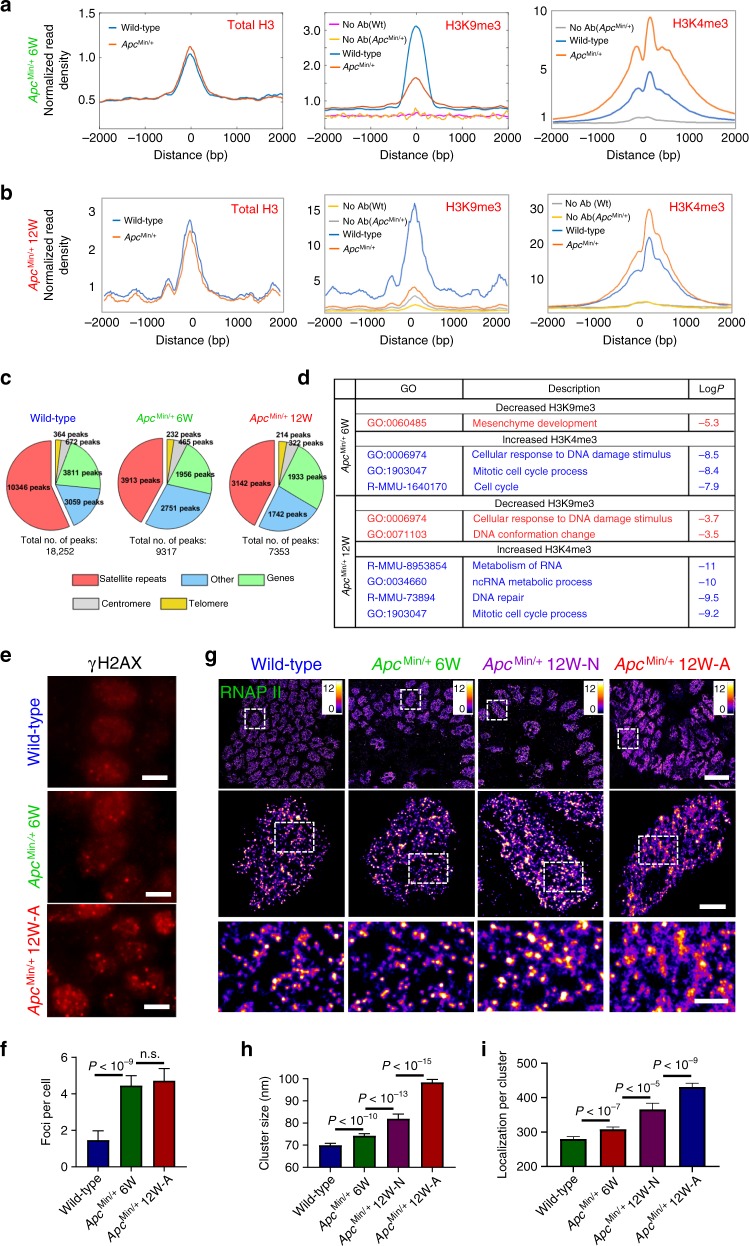
Fig. 3
Impact of disrupted chromatin structure on transcription and genomic stability.
a , b Average enrichment of H3K9me3 and total H3 from previously described H3K9me3 enriched genomic regions and average H3K4me3 occupancy over transcription start sites (TSSs), and c pie charts that s...
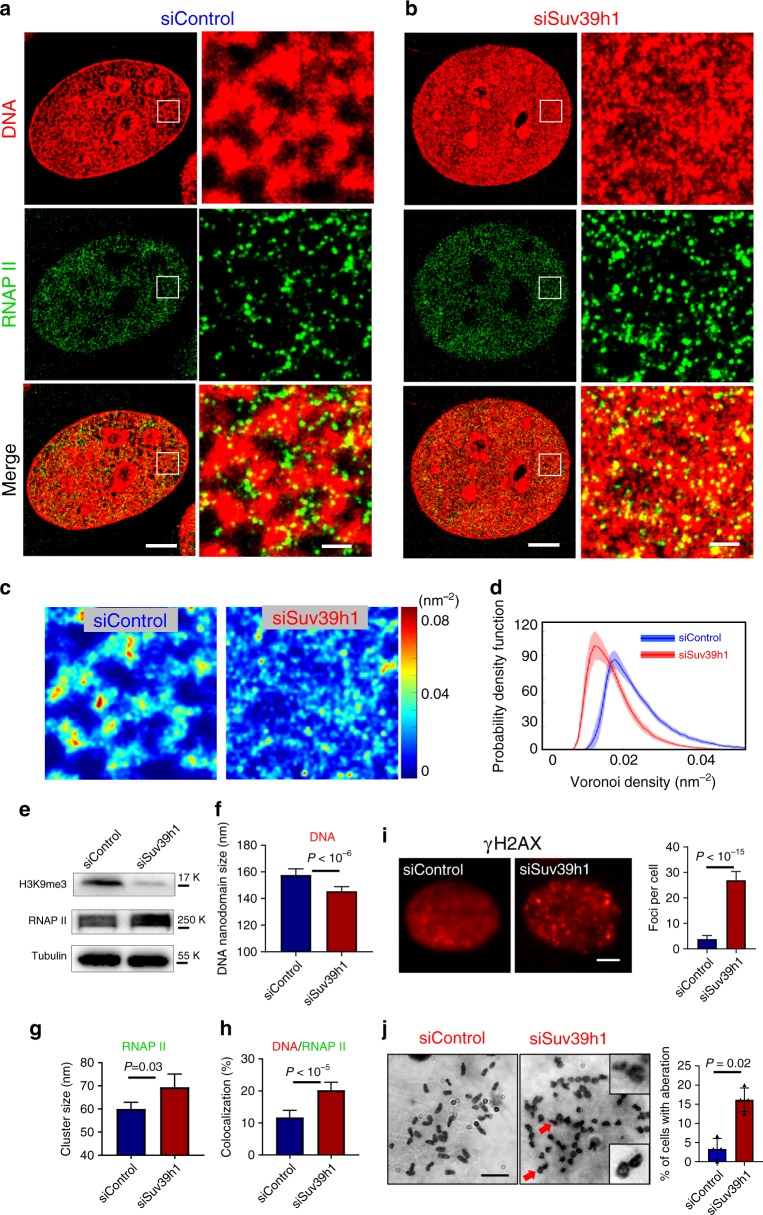
Fig. 4
Functional and structural consequences upon disrupting heterochromatin structure.
a , b Representative two-color STORM images showing the spatial relationship between DNA and active (phosphorylated) RNAP II in control NIH-3T3 cells and those cells with SUV39h1 knockdown (siSUV39h1)...
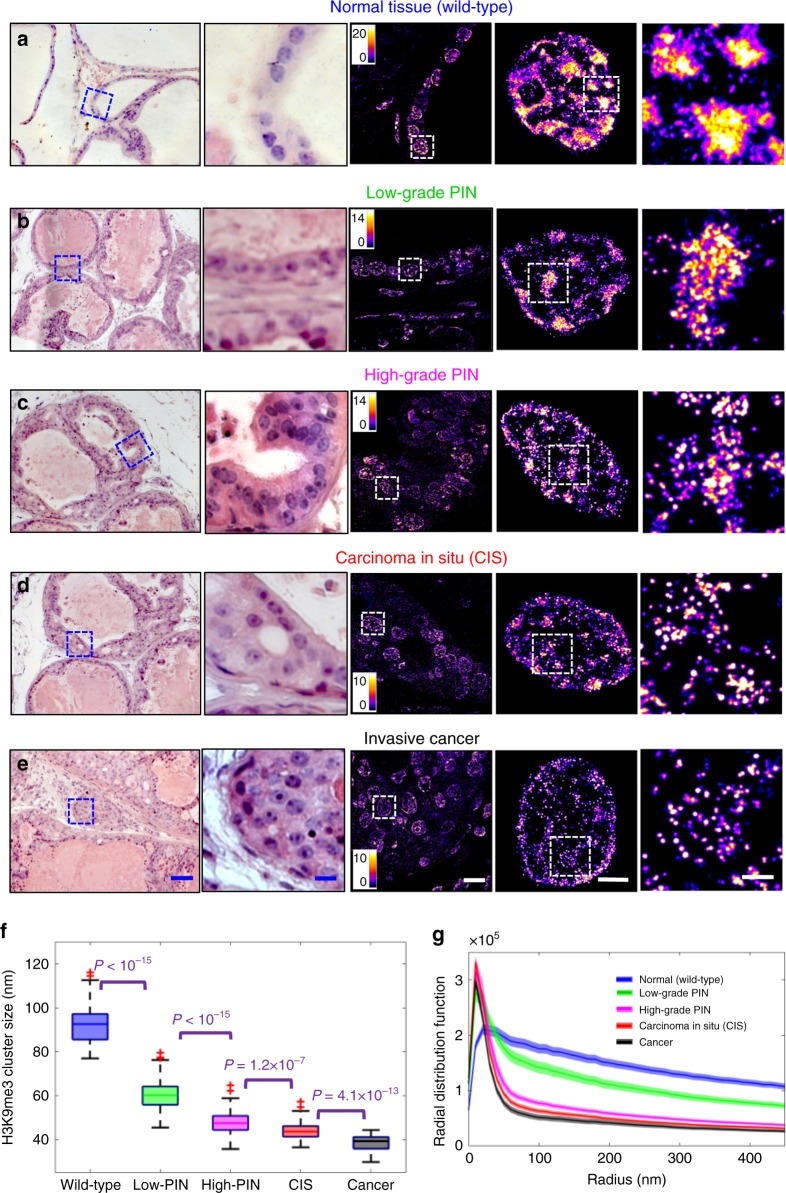
Fig. 5
Super-resolution imaging of disrupted heterochromatin structure in prostate neoplasia.
a u2013 e Representative histology and the corresponding super-resolution images of heterochromatin structure (from the blue boxes) from normal epithelial cells of the prostate from wild-type mice, lo...
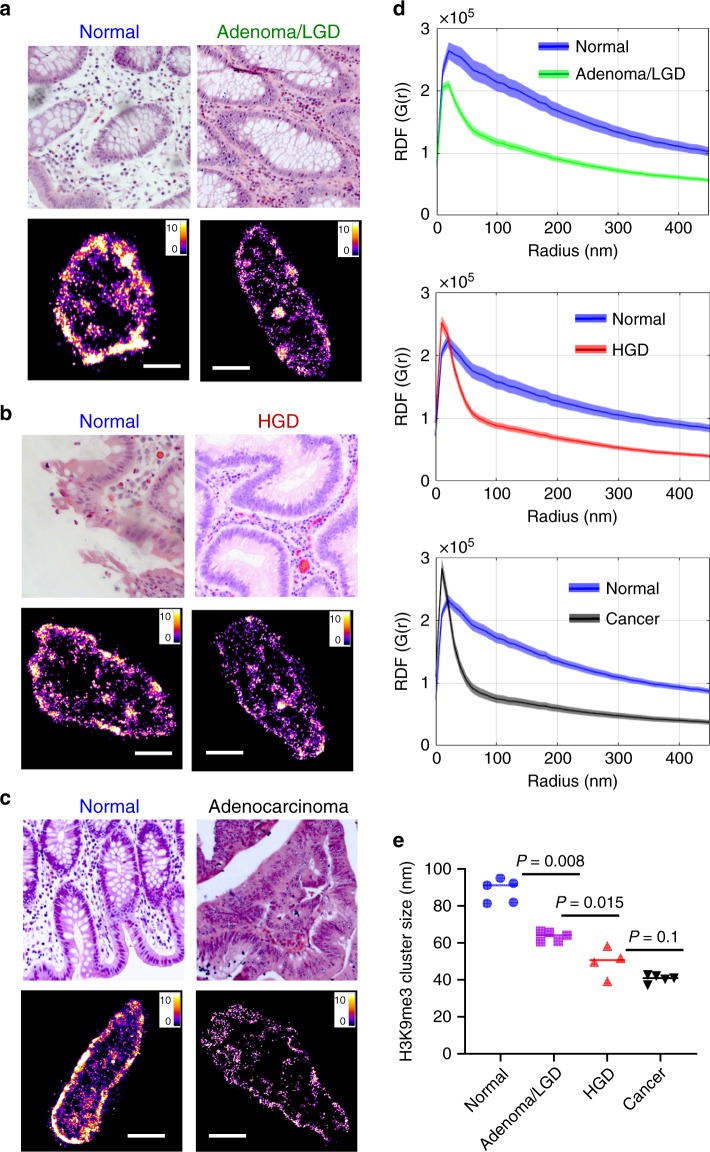
Fig. 6
Super-resolution imaging of disrupted heterochromatin structure in human neoplasia.
a u2013 c Representative histology and corresponding super-resolution images of heterochromatin structure for colorectal neoplastic lesions together with their paired normal tissue located at more tha...
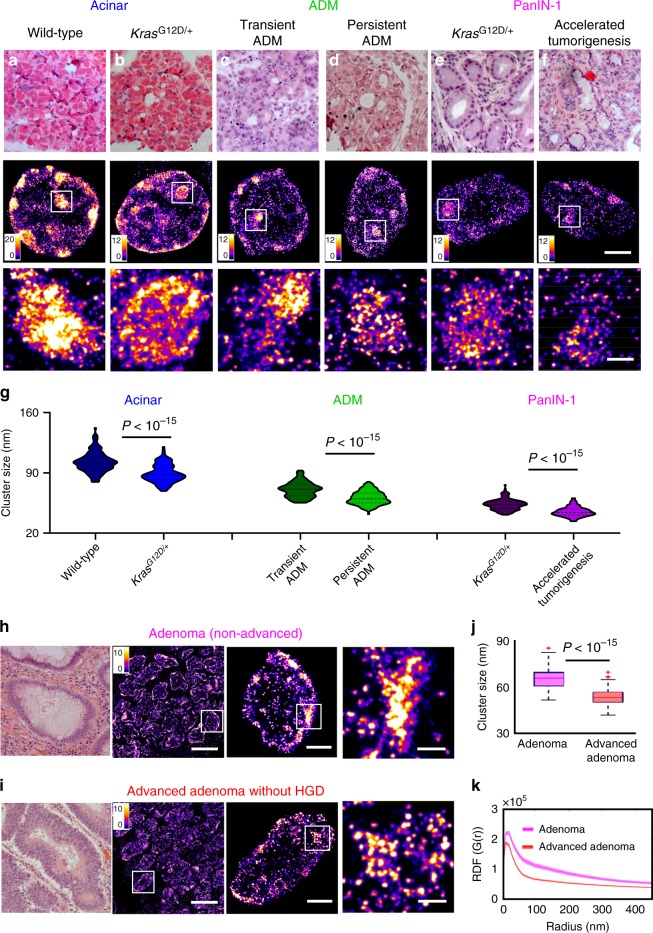
Fig. 7
Disrupted heterochromatin structure in precursors indistinguishable by conventional pathology.
a u2013 f Representative histology and super-resolution images of heterochromatin structure in normal acinar cells between wild-type mice and Kras G12D/+ mice, between transient ADM from wild-type mic...
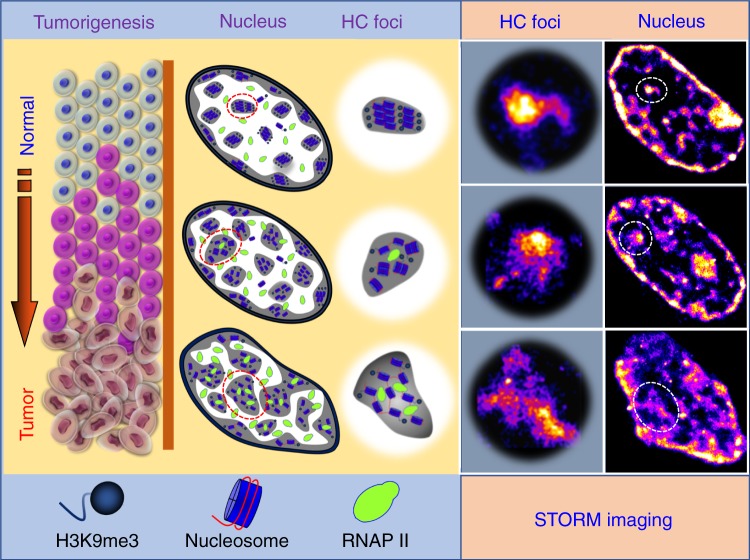
Fig. 8
Model to depict the molecular-scale heterochromatin structure in carcinogenesis.
As normal cells transform into tumor cells in carcinogenesis, chromatin folding becomes gradually de-compacted and fragmented accompanied with enlarged heterochromatin foci, which increases enhanced f...
Figure images are served from the NIH/NLM PubMed Central Open Access Subset or Europe PMC; copyright remains with the publishers and authors.
💬 Discussion
0 commentsNo comments yet. Be the first to start a discussion!
Leave a Comment