Abstract
Bioorthogonal reactions, including the strain-promoted azide-alkyne cycloaddition (SPAAC) and inverse electron demand Diels-Alder (iEDDA) reactions, have become increasingly popular for live-cell imaging applications. However, the stability and reactivity of reagents has never been systematically explored in the context of a living cell. Here we report a universal, organelle-targetable system based on HaloTag protein technology for directly comparing bioorthogonal reagent reactivity, specificity, and stability using clickable HaloTag ligands in various subcellular compartments. This system enabled a detailed comparison of the bioorthogonal reactions in live cells and informed the selection of optimal reagents and conditions for live-cell imaging studies. We found that the reaction of sTCO with monosubstituted tetrazines is the fastest reaction in cells; however, both reagents have stability issues. To address this, we introduced a new variant of sTCO, Ag-sTCO, which has much improved stability and can be used directly in cells for rapid bioorthogonal reactions with tetrazines. Utilization of Ag complexes of conformationally strained trans-cyclooctenes should greatly expand their usefulness especially when paired with less reactive, more stable tetrazines.
🔬 Techniques
🔭 Microscopes
💻 Software
✨ Fluorophores
🧪 Sample Preparation
🔬 Cell Lines
🏭 Microscope Brands
🧪 Reagent Suppliers
📷 Detectors
💻 Software Details
🏛️ Research Organizations (ROR)
Affiliated research institutions:
📋 Methods
Materials and Methods
Synthesis of chloroalkane
HaloTag ligands 1 – 11 and bioorthogonal fluorophores are described in the Supporting Information . All reagents were purchased from Sigma-Aldrich unless otherwise noted. Molecular Cloning N -Terminal HaloTag ORF fusion protein plasmids in pFN21A mammalian expression vector were purchased for targeted HaloTag expression in the lumen of the endoplasmic reticulum (human KDELR3; Promega FHC05579), nucleus (human HIST1H2BK; Promega FHC05625), and cytosol (human GAP43; Promega FHC02950). KDELR3, HIST1H2BK, and GAP43 plasmids were cut with PmeI/NotI, and ligated to a NotI/ Sma I fragment of either EGFP (pEGFP-N1, Clontech) or mCherry (pmCherry-N1, Clontech) to create fluorescent protein tags on each construct. The C -terminal HaloTag ORF pHTN mammalian expression vector was purchased from Promega (G772A). A cytosolic/nuclear expressed Halo-mCherry fusion construct was generated by ligating an NheI/EcoRV Halo fragment into pmCherry-N1 (Clontech) mammalian expression vector, cut with NheI/PspOMI (blunt filled). For extracellular HaloTag protein expression (Halo-mCherry-PDGFR), a construct was generated by ligating a synthetic, stop codon eliminated Halo-mCherry fusion to the transmembrane domain of the PDGFR in the pDisplay vector (Invitrogen/LifeTechnologies catalog #V660–20) at the restriction sites Bgl II/ Pst I. A (Ser-Gly-Gly-Gly)9 bridge was synthesized between Halo and mCherry.
HeLa Cell Culture and Transfection
HeLa cells were maintained in growth media containing Dulbecco’s modified eagle medium (DMEM, Life Technologies) supplemented with 10% (v:v) heat inactivated FBS (Life Technologies), 100 units/mL penicillin and streptomycin (Life Technologies), and 10 mM Hepes (Life Technologies) in a humidified incubator set at 37 °C/5% CO 2 . HeLa cells were transfected with a 3:1 ratio of lipofectamine 2000 (Life Technologies):DNA according to the manufacturer’s protocol in antibiotic-free DMEM/10% FBS at 80–90% confluence. Cells were incubated for 3 h at 37 °C/5% CO 2 and media was changed into growth media for 16–20 h prior to HaloTag labeling experiments.
Show full methods section
Materials and Methods
Synthesis of chloroalkane
HaloTag ligands 1 – 11 and bioorthogonal fluorophores are described in the Supporting Information . All reagents were purchased from Sigma-Aldrich unless otherwise noted. Molecular Cloning N -Terminal HaloTag ORF fusion protein plasmids in pFN21A mammalian expression vector were purchased for targeted HaloTag expression in the lumen of the endoplasmic reticulum (human KDELR3; Promega FHC05579), nucleus (human HIST1H2BK; Promega FHC05625), and cytosol (human GAP43; Promega FHC02950). KDELR3, HIST1H2BK, and GAP43 plasmids were cut with PmeI/NotI, and ligated to a NotI/ Sma I fragment of either EGFP (pEGFP-N1, Clontech) or mCherry (pmCherry-N1, Clontech) to create fluorescent protein tags on each construct. The C -terminal HaloTag ORF pHTN mammalian expression vector was purchased from Promega (G772A). A cytosolic/nuclear expressed Halo-mCherry fusion construct was generated by ligating an NheI/EcoRV Halo fragment into pmCherry-N1 (Clontech) mammalian expression vector, cut with NheI/PspOMI (blunt filled). For extracellular HaloTag protein expression (Halo-mCherry-PDGFR), a construct was generated by ligating a synthetic, stop codon eliminated Halo-mCherry fusion to the transmembrane domain of the PDGFR in the pDisplay vector (Invitrogen/LifeTechnologies catalog #V660–20) at the restriction sites Bgl II/ Pst I. A (Ser-Gly-Gly-Gly)9 bridge was synthesized between Halo and mCherry.
HeLa Cell Culture and Transfection
HeLa cells were maintained in growth media containing Dulbecco’s modified eagle medium (DMEM, Life Technologies) supplemented with 10% (v:v) heat inactivated FBS (Life Technologies), 100 units/mL penicillin and streptomycin (Life Technologies), and 10 mM Hepes (Life Technologies) in a humidified incubator set at 37 °C/5% CO 2 . HeLa cells were transfected with a 3:1 ratio of lipofectamine 2000 (Life Technologies):DNA according to the manufacturer’s protocol in antibiotic-free DMEM/10% FBS at 80–90% confluence. Cells were incubated for 3 h at 37 °C/5% CO 2 and media was changed into growth media for 16–20 h prior to HaloTag labeling experiments.
Preparation of Clickable HaloTag
Ligand and Fluorophore Stock Solutions HaloTag Ligands 1 – 11 were prepared as 10 mM stocks (1000×) in anhydrous DMSO within 1-week of NMR confirmation of ligand structure. Stocks were frozen as single-use aliquots at −20 °C, and kept for up to 6 months due to stability issues. sTCO ligand 5 and cyclopropene ligand 9 were especially unstable, and required constant monitoring and resynthesis. Ag-sTCO ligand 6 was prepared as a 10 mM stock in EtOH, and maintained stability over at least 8 months when stored at −20 °C. Fluorophore tetrazine derivatives were prepared as 10 mM stocks in anhydrous DMSO, and serially diluted to 1000× working stocks. Solutions were frozen at −20 °C and remained stable up to 3 freeze–thaw cycles. Strained alkyne and azide fluorophores were prepared as 100 mM stock solutions in anhydrous DMSO, and frozen as 1000× working stocks at −20 °C. Aliquots were used up to 3 times before disposal without any loss of reactivity. TCO-TAMRA fluorophore was prepared as a 10 mM stock in anhydrous DMSO, aliquoted, and stored at −20 °C as single-use aliquots.
Labeling of HaloTag Fusion Proteins with Bioorthogonal
Ligands and Evaluation of SPAAC and iEDDA Reactions in Live Cells HeLa cells expressing HaloTag constructs were treated in 6-well dishes with 1 mL of 10 μM HaloTag ligands 1 – 12 in growth media for 0.5 h at 37 °C/5% CO 2 . Samples labeled with 12 served as a positive control to determine the maximum amount of HaloTag protein labeling per experiment. Cells were washed three times in DPBS and incubated in 2 mL new media for 1 h with one media change to remove unbound HaloTag ligands. For SPAAC reactions, HeLa cells were labeled with chloroalkane ligands 1 – 3 followed by either a dose response of 50 nM to 250 μM fluorophores 15 – 17 for 2 h, or a timecourse of 25 μM fluorophore for 30 s to 4 h in growth media. Reactions were immediately quenched by washing cells two times in 500 μM azide-amine 24 , DBCO-amine 26 (Click Chemistry Tools), or BCN-amine 25 in PBS (SPAAC Quench buffer). For iEDDA, HeLa cells labeled with chloroalkane ligands 2 , and 4 – 11 were treated with either a dose response from 1 nM-20 μM fluorophores 13 , 14 , 17 , and 18 for 1 h, or a timecourse of 2 μM fluorophore for 10 s-2 h in growth media. Cells were quenched by washing two times in 100 μM Tz-amine 27 (Click Chemistry Tools) or TCO-amine 28 in PBS (iEDDA Quench buffer). Cells were scraped in 1 mL quench buffer, spun at 2000 g for 3 min, the buffer was aspirated and cell pellets were immediately frozen on dry ice. HeLa Cell Lysis, SDS-PAGE, In-Gel Fluorescence, and Western Blotting For SPAAC, cell pellets were lysed by sonication in 100 μL 1% SDS/SPAAC quench buffer. For iEDDA, cell pellets were lysed by sonication in 100 μL 1% SDS/iEDDA quench buffer. Protein concentrations were determined with a BCA protein assay (Thermo-Fisher) and cell lysates were normalized by protein concentration. Samples were prepared in 1× LDS sample buffer (Life Technologies), with 10 μg protein loaded per well, and separated by SDS-PAGE on NuPage 4–12% Bis-Tris gels in MES running buffer (Life Technologies). TAMRA-fluorescence was analyzed on a Typhoon variable mode imager (GE Healthsciences) using a TAMRA filter. Gels were then transferred to nitrocellulose using iBLOT (Life Technologies), blocked in Odyssey blocking buffer (LiCor) for 1 h at RT, and incubated in anti-HaloTag pAb (Promega, G9281) at 1:2000 overnight in TBST. Membranes were washed 3 times in TBST, and incubated in goat anti-rabbit IRDye 800CW (LiCor) at 1:10,000 in TBST for 1 h at RT. Membranes were washed three times in TBST and imaged on the Odyssey Infrared Imager (LiCor).
Data Quantification
Fluorescence intensity measurements were quantified in ImageJ 1.45 (NIH) for both TAMRA fluorescence and total HaloTag protein expression. In-gel fluorescence (TAMRA) signal first was normalized to total HaloTag protein expression signal (Western blot). The positive TAMRA-control (ligand 12 ) was set at 100% for each experiment. SPAAC and iEDDA data were normalized to this value, and reported as a percent of control. Data from 3 to 6 independent replicates were quantified and plotted as the log[dose] vs response for generation of EC 50 values. Curves were fit using a four parameter dose–response curve in GraphPad Prism version 6.03 for Windows, GraphPad Software, La Jolla California USA, www.graphpad.com . For timecourse experiments, data was plotted as the percent of control vs time and fit with pseudo-first order association kinetics where Y = Y 0 + (Plateau – Y 0 )(1 – exp(− K x )) where the Plateau = E max and K = rate constant expressed as the reciprocal of x in units. Y 0 was set as a constant = 0. All data is reported as the mean ± SEM from 3 to 6 independent replicates. Pulse-Chase Analysis of HaloTag Ligand Incorporation into HaloTag Protein HeLa cells expressing Halo-H2B-GFP were treated with 10 μM HaloTag ligands 1 – 12 for 30 min in growth media at 37 °C/5% CO 2 , washed three times with PBS, and incubated for 1 h in growth media with one media change to remove unbound HaloTag ligand. Samples were treated with 1 μM HaloTag ligand 12 for 10 min at 37 °C/5% CO 2 , washed three times with PBS and processed as described after lysis in 100 μL 1% SDS with sonication.
Analysis of the Stability of TCO
Derivatives in the Nucleus and ER of Live HeLa Cells
HeLa cells transfected with Halo-H2B-GFP (nucleus) or Halo-KDEL (ER) were analyzed for dienophile stability. Cells treated with 10 μM HaloTag ligands 4 – 7 and 12 were incubated in DMEM/10% FBS for 0.5 h followed by a 1 h washout period prior to reaction with TAMRA-tetrazine 13 at 37 °C/5% CO 2 . HeLa cells were incubated with a saturating dose of 2 μM 5-TAMRA-tetrazine 13 for 1 h at 37 °C/5% CO 2 at the indicated time points. Cells were washed with PBS, scraped in 1 mL PBS, pelleted at 2000 g for 3 min, and processed as described previously for in-gel fluorescence. Each time point contained 12 as a control to account for labeled HaloTag protein degradation during the course of the experiment.
Evaluation of SPAAC and iEDDA
Reactions for Live/Fixed Cell Imaging HeLa cells were plated on poly-lysine coated glass-bottom dishes (MatTek, P35GC-1.5–14C), transfected, and treated as described for in-gel fluorescence with the following modifications. Following fluorophore incubation in culture media, cells were washed 3 × 1 mL PBS with the appropriate quench reagent, and quenched for an additional 5 min in media. Cells were washed 3 × 1 mL media to remove quench reagent and incubated in cell culture media for 1–2 h prior to imaging. Cells were washed one time in phenol red-free DMEM (Life Technologies)/10% FBS, and media was replaced with phenol-red free DMEM/10% FBS supplemented with 10 μg/mL Hoescht 33342 (Life Technologies, H3570) for nuclear labeling 5 min prior to imaging live. For fixed-cell imaging, cells were fixed in ice-cold MeOH for 10 min, washed 3 × 1 mL PBS and incubated in 1 mL PBS overnight at 4 °C. PBS was aspirated and 100 μL VECTASHIELD (Vector Laboratories) cell mounting media containing DAPI (Vector Laboratories, H-1200) was added prior to imaging.
Fluorescence Microscopy
Live and fixed cells were imaged on a Zeiss AxioObserver.Z1 with a Yokagawa CSU-X1M 5000 spinning disk system using a Zeiss PlanApochromatic 40×/1.3 or 63×/1.4 oil immersion objectives. The imaging system was maintained in a 37 °C heated incubation chamber along with humidified stage-top incubation components set at 37 °C/5% CO 2 for live-cell imaging. Excitation of Hoescht and DAPI was carried out with a 405 nm laser and emission spectra were collected between 440 and 480 nM. Excitation of fluorescein, BODIPY-FL, and eGFP was carried out using a 488 nm laser and emission spectra were collected between 520 and 550 nm. TAMRA and mCherry were excited with a 561 nm laser and emission spectra were collected between 620 and 670 nm. Images were acquired using a Photometrics Evolve 512 Delta camera using the appropriate filter conditions for the indicated fluorophores with the ZEN Blue 2012 v. 8.1 software (Carl Zeiss Microscopy).
Materials and Methods
Synthesis of chloroalkane
HaloTag ligands 1 – 11 and bioorthogonal fluorophores are described in the Supporting Information . All reagents were purchased from Sigma-Aldrich unless otherwise noted.
Supplementary Material ja5b06847_si_001.pdf
📊 Figures
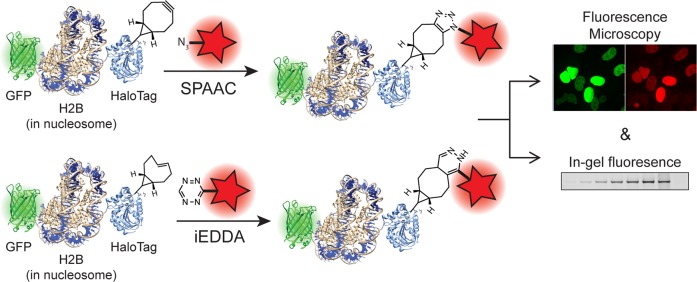
Scheme 1
Organelle-Targetable HaloTag-Based Evaluation of Strain Promoted Azideu2013Alkyne Cycloaddition (SPAAC, Top) and Inverse Electron Demand Dielsu2013Alder (iEDDA, Bottom) Bioorthogonal Chemistry with Analysis by Fluorescence Microscopy and In-Gel Fluorescence
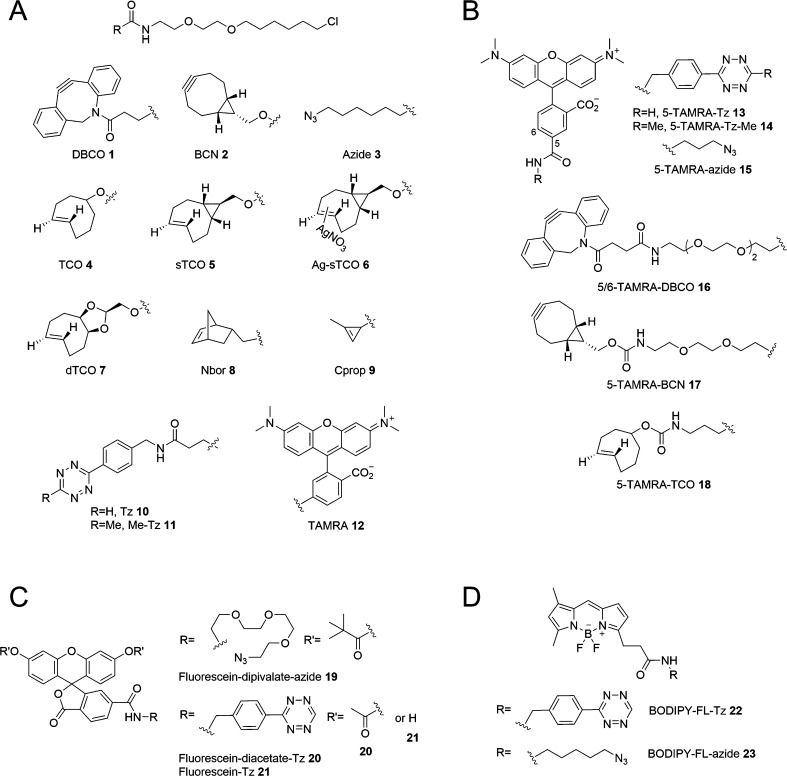
Figure 1
Structures of clickable (A) HaloTag chloroalkanenligands and (B)nTAMRA-, (C) Fluorescein-, and (D) BODIPY-fluorophores.
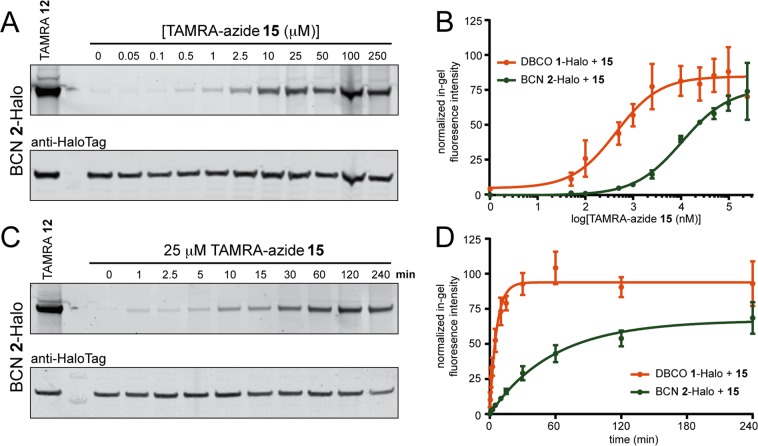
Figure 2
Analysis of SPAAC reactions of DBCO 1 - and BCN 2 -HaloTag conjugates with TAMRA-azide 15 in thennucleus of live HeLa cells expressing Halo-H2B-GFP. (A) Cells werentreated with 10 u03bcM chloroalkane ...
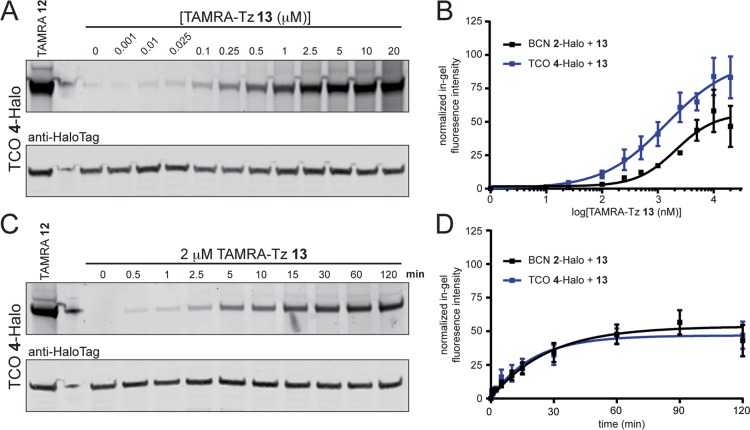
Figure 3
Analysis of iEDDA reactions of BCN 2 - and TCO 4 -HaloTag conjugates with TAMRA-Tz 13 in thennucleus of live HeLa cells expressing Halo-H2B-GFP. (A) Cells werentreated with 10 u03bcM chloroalkane liga...
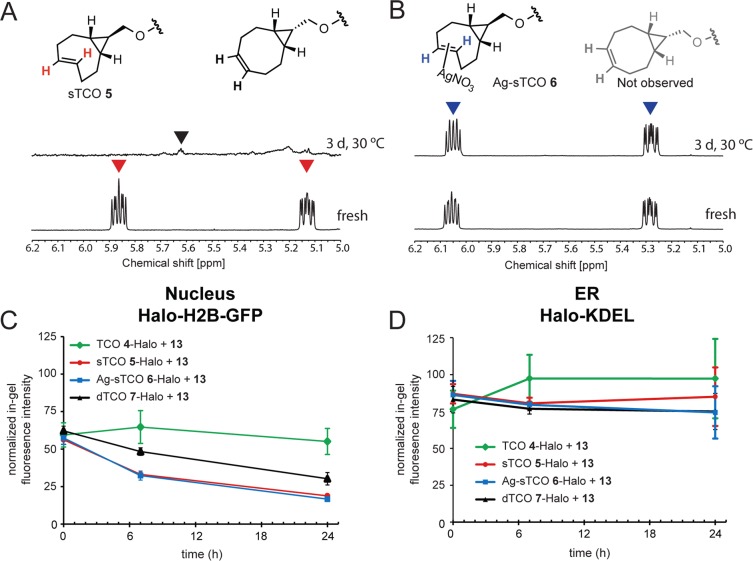
Figure 4
Stability of conformationally strained trans -cyclooctenenderivatives. (A) 1 H NMR spectra (600 MHz, CD 3 OD) of fresh sTCO 5 (bottom) and following a 3-day incubationnneat at 30 u00b0C (top) showing ...
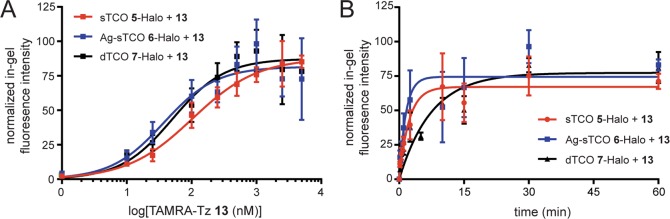
Figure 5
Analysisnof iEDDA reactions of sTCO 5 -, Ag-sTCO 6 -, and dTCO 7 -HaloTag conjugates with TAMRA-Tz 13 in the nucleus of live HeLa cells expressing Halo-H2B-GFP.n(A) Doseu2013response curves for the iE...
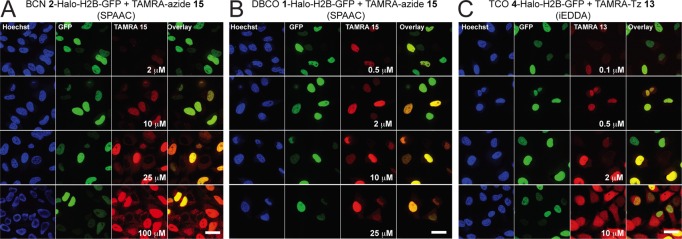
Figure 6
Confocal imagesnof the SPAAC and iEDDA reactions of clickable BCN 2 -,nDBCO 1 -, and TCO 4 -HaloTag conjugatesnwith clickable TAMRA fluorophores in live cells expressing Halo-H2B-GFP.nHalo-H2B-GFP was...
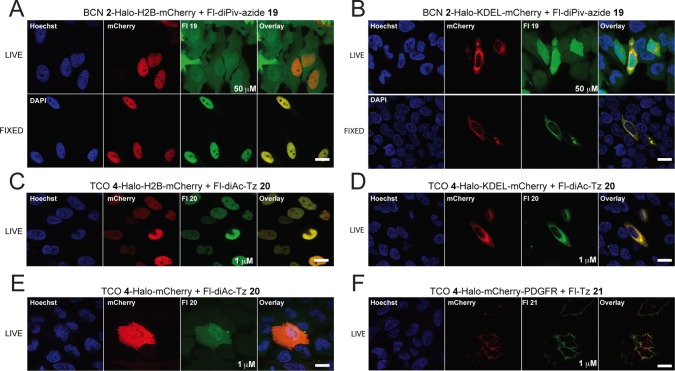
Figure 7
Confocal images of the SPAAC and iEDDA reactions betweennclickablenHaloTag conjugates and clickable fluorescein derivatives in differentnsubcellular organelles. (A) Confocal images of nuclei expressin...
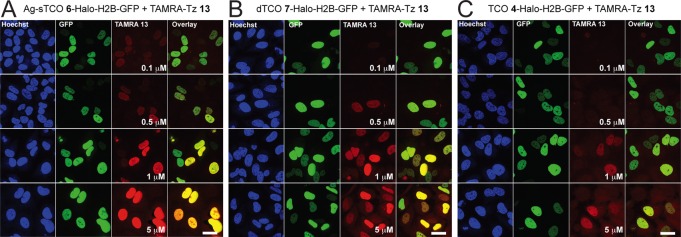
Figure 8
Rapid intracellularnimaging of iEDDA reactions in live HeLa cells.nHalo-H2B-GFP expressing HeLa cells were labeled with HaloTag chloroalkanenligands TCO 4 , dTCO 7 , or Ag-sTCO 6 followed by reaction ...
Figure images are served from the NIH/NLM PubMed Central Open Access Subset or Europe PMC; copyright remains with the publishers and authors.
💬 Discussion
0 commentsNo comments yet. Be the first to start a discussion!
Leave a Comment