Abstract
AbstractGuanine-rich oligonucleotides can fold into quadruple-stranded helical structures known as G-quadruplexes. Mounting experimental evidence has gathered suggesting that these non-canonical nucleic acid structures form in vivo and play essential biological roles. However, to date, there are no small-molecule optical probes to image G-quadruplexes in live cells. Herein, we report the design and development of a small fluorescent molecule, which can be used as an optical probe for G-quadruplexes. We demonstrate that the fluorescence lifetime of this new probe changes considerably upon interaction with different nucleic acid topologies. Specifically, longer fluorescence lifetimes are observed in vitro for G-quadruplexes than for double- and single-stranded nucleic acids. Cellular studies confirm that this molecule is cell permeable, has low cytotoxicity and localizes primarily in the cell nucleus. Furthermore, using fluorescence lifetime imaging microscopy, live-cell imaging suggests that the probe can be used to study the interaction of small molecules with G-quadruplexes in vivo.
🔬 Techniques
🔭 Microscopes
💻 Software
✨ Fluorophores
🧪 Sample Preparation
🔬 Cell Lines
🏭 Microscope Brands
🧪 Reagent Suppliers
💻 Software Details
🏛️ Research Organizations (ROR)
Affiliated research institutions:
📋 Methods
Full synthetic procedures and characterization of new compounds can be found in Supplementary Methods .
General procedures
Absorption measurements were made on a Perkin-Elmer ultraviolet-visible spectrometer. Emission spectra were obtained on a Varian Cary-Eclipse or Horiba Jobin Yvon Fluorolog fluorescence spectrometer. The oligonucleotides used were purchased RP-cartridge purified from Eurogentec. CT-DNA was obtained from Sigma-Aldrich. pH was measured using a Mettler Toledo pH meter. Quantum yield At least six absorption and emission spectra were recorded of the compound at different concentrations in aerated 10 mM lithium cacodylate buffer (pH 7.3) containing 100 mM potassium chloride. The absorbance was below 0.1 at wavelengths above the excitation wavelength (436 nm) and emission was collected from 500 to 800 nm. [Ru(byp) 3 Cl 2 ] in aerated Milli-Q water was used as the reference standard (Φ Ru =0.028; ref. 32 ). A plot of absorbance (436 nm) versus integrated emission intensity yielded a linear fit to the equation y = mx + c ( R 2 >0.99). The quantum yield of the compound was determined by Φ x =Φ Ru ( m x / m Ru ). Solvent effects emission spectra TOTA , ADOTA-M and DAOTA-M2 (2 μM) were excited at 404 nm where absorbance is minimal and emission was monitored from 500 to 750 nm. Fluorescence enhancement or quenching was determined by the integrated fluorescence of the emission spectrum. pH 1.0 and 7.3 measurements were recorded in 0.1 M HCl and 10 mM lithium cacodylate buffer containing 100 mM KCl, respectively. Measurements in 1,4-dioxane were recorded at pH 7.3 (10 mM lithium cacodylate buffer containing 100 mM KCl). Ionic strength measurements were performed in 10 mM lithium cacodylate buffer (pH 7.3) by increasing KCl concentration from 0 to 220 mM.
Show full methods section
Full synthetic procedures and characterization of new compounds can be found in Supplementary Methods .
General procedures
Absorption measurements were made on a Perkin-Elmer ultraviolet-visible spectrometer. Emission spectra were obtained on a Varian Cary-Eclipse or Horiba Jobin Yvon Fluorolog fluorescence spectrometer. The oligonucleotides used were purchased RP-cartridge purified from Eurogentec. CT-DNA was obtained from Sigma-Aldrich. pH was measured using a Mettler Toledo pH meter. Quantum yield At least six absorption and emission spectra were recorded of the compound at different concentrations in aerated 10 mM lithium cacodylate buffer (pH 7.3) containing 100 mM potassium chloride. The absorbance was below 0.1 at wavelengths above the excitation wavelength (436 nm) and emission was collected from 500 to 800 nm. [Ru(byp) 3 Cl 2 ] in aerated Milli-Q water was used as the reference standard (Φ Ru =0.028; ref. 32 ). A plot of absorbance (436 nm) versus integrated emission intensity yielded a linear fit to the equation y = mx + c ( R 2 >0.99). The quantum yield of the compound was determined by Φ x =Φ Ru ( m x / m Ru ). Solvent effects emission spectra TOTA , ADOTA-M and DAOTA-M2 (2 μM) were excited at 404 nm where absorbance is minimal and emission was monitored from 500 to 750 nm. Fluorescence enhancement or quenching was determined by the integrated fluorescence of the emission spectrum. pH 1.0 and 7.3 measurements were recorded in 0.1 M HCl and 10 mM lithium cacodylate buffer containing 100 mM KCl, respectively. Measurements in 1,4-dioxane were recorded at pH 7.3 (10 mM lithium cacodylate buffer containing 100 mM KCl). Ionic strength measurements were performed in 10 mM lithium cacodylate buffer (pH 7.3) by increasing KCl concentration from 0 to 220 mM.
Time-correlated single photon counting
Time-resolved fluorescence decay traces were obtained using a TCSPC Jobin Yvon IBH data station (5000F, HORIBA Scientific Ltd) using a 404-nm excitation source (full width of half-maximum intensity (FWHM)=200 ps). Samples were prepared as detailed under Solvent effects emission spectra in Methods section. Decays were recorded at the emission wavelengths 520, 555 or 575 nm (±16 nm) for TOTA , ADOTA-M and DAOTA-M2 , respectively, using emission monochromator. Signal intensity was at least 10,000 counts in the peak maximum. Two long-pass filters (>490, 550 or 570 nm long pass) were used in the detection channel to avoid light scattering for fluorescence decays. A neutral density filter was used for the instrument response function (IRF) measurements using a Ludox solution, detecting emission at the excitation wavelength. Traces were fitted by iterative reconvolution to the equation where α 1 and α 2 are variables and is normalized to unity. The fractional contribution to the steady-state emission is calculated from the equation . The average lifetime was calculated using the equation . For mono- or bi-exponential decays, the α 1 and/or α 1 terms were set to zero. In the case of solvent polarity, to gain greater accuracy in the lifetimes obtained, a tri-exponential decay model was fitted to decay traces with different 1,4-dioxane percentages using a common τ 1 , τ 2 and τ 3 (global analysis) 33 . A prompt shift was included in the fitting to take into account differences in the emission wavelength between the IRF and decay as well as the different number of filters used. The goodness of fit was judged by consideration of the deviations from the model via a weighted residuals plot. Least square minimization was performed using the Quasi-Newton algorithm in MatLab (R2013a). Excited state p K a* determination ADOTA-M and DAOTA-M2 (2 μM, 10 mM sodium phosphate buffer and 0.1 M KCl (pH 7.6)) were titrated with citric acid (3 M) from pH 7.6 to 3 (phosphate–citric acid buffer capacity=2.6–7.6; ref. 34 ). The pH was read before the emission spectrum was recorded (excitation wavelength=404 nm (minimal absorbance), emission wavelength=500–750 nm). The pH was then plotted against the numerical derivative δ F/ δ pH, where F is the integrated emission. The minimum was then determined to identify p K a*. Three independent repeats were performed.
List of nucleic acid models
The oligonucleotides used in this study and their corresponding molar extinction coefficients are summarized in Table 2 . DNA annealing Oligonucleotides were dissolved in buffer containing 100 mM potassium chloride and annealed at 95 °C for 5 min before cooling to room temperature overnight on a heat block. Annealing concentrations were ∼50–100 μM (except for TBA and myc2345, which were ∼1 mM). For PDGF-A, as reported previously, the oligonucleotide was annealed in the same buffer but containing only 25 mM potassium chloride at 15 μM concentrations to enable intramolecular folding 35 . For d(GC) 8 , samples were annealed in buffer containing 5 M sodium chloride to form Z-DNA stock samples 36 . For Z-DNA measurements, this salt concentration was maintained. For normal B-form measurements of d(GC) 8 , the sodium chloride concentration was reduced to 250 mM. CT-DNA and transfer RNA (tRNA) was dissolved in buffer containing 100 mM potassium chloride and their concentration was checked using the molar extinction coefficients 13,200 (base pair) and 8,250 (base) mol dm −3 cm −1 , respectively. Double- and single-stranded nucleic acid model concentrations were converted to base and base pair concentration by multiplying the number of base/base pairs in the sequence. Absorption and emission titrations Compound concentration was held constant (20 and 2 μM for absorption and emission measurements, respectively) in 10 mM lithium cacodylate buffer (pH 7.3) containing 100 mM potassium chloride. Concentrated DNA was then titrated to the compound solution until changes in the absorbance/emission became noticeably indifferent. Fold enhancement of emission was determined by the fluorescence at the end of the titration divided by the initial fluorescence of the compound-only spectrum. Samples were excited at 465 nm, where upon titration of DNA, absorbance changes were negligible (
📊 Figures
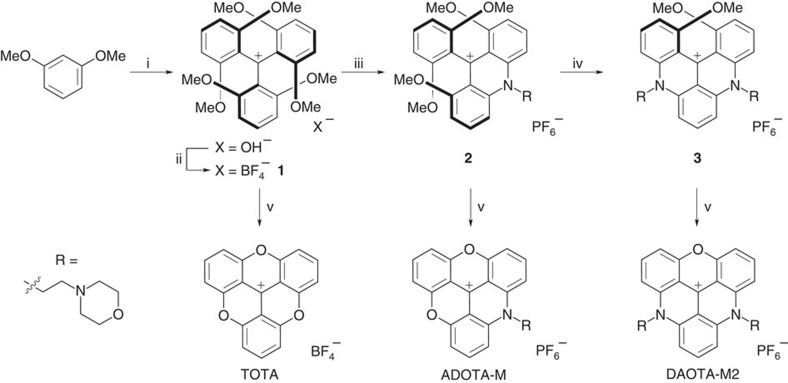
Figure 1
Synthetic route to trianguleniums.
(i) n BuLi, TEMED, Et 2 O, 0u2009u00b0C to rt then (EtO) 2 CO, 18u2009h; (ii) HBF 4 u00b7Et 2 O, Et 2 O, rt, 5u2009min; (iii) RNH 2 , NMP, room temperature, 2u2009h then NH 4 PF 6 (aq) ; (iv) RNH 2 , ...
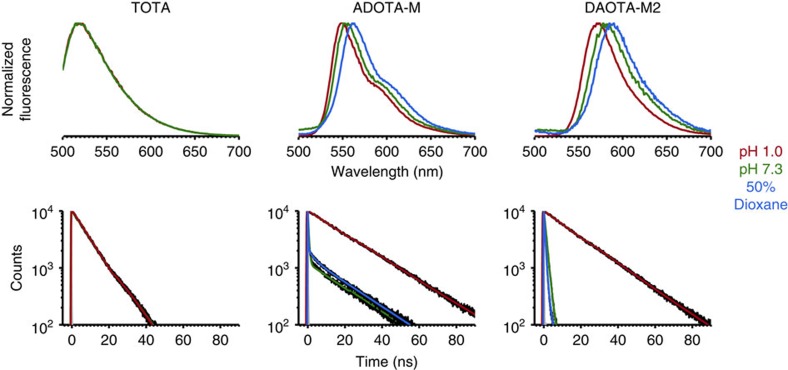
Figure 2
The effect of the local aqueous environment on the fluorescence of TOTA , ADOTA-M and DAOTA-M2 .
pH 1.0 (red) and 7.3 (green) measurements were recorded in 0.1u2009M HCl and 10u2009mM lithium cacodylate buffer containing 100u2009mM KCl (pH 7.3). Measurements in 50% 1,4-dioxane (blue) were recorde...
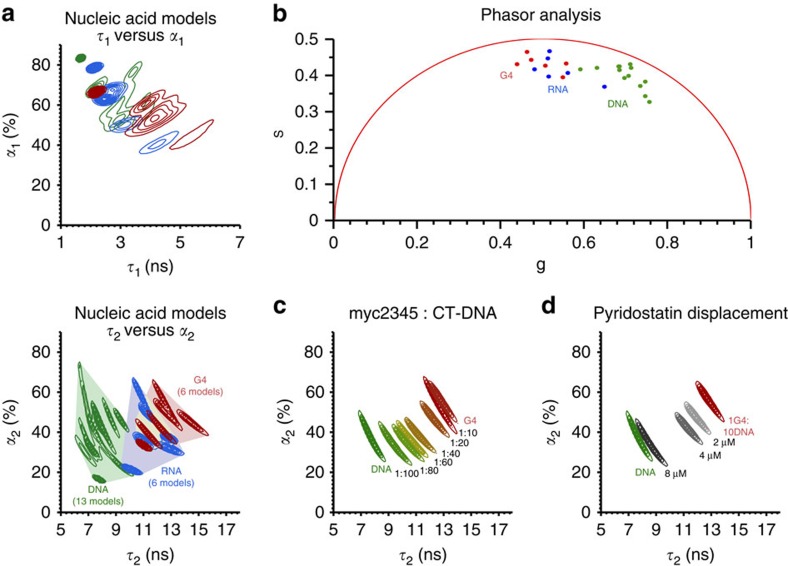
Figure 3
Fluorescence lifetimes of DAOTA-M2 in the presence of different nucleic acid models in solution as determined by TCSPC-FLIM data analysis.
( a ) Contour maps of nucleic acid models for fluorescence lifetime and the corresponding amplitude for each pixel of the FLIM image (512 u00d7 512). The difference between each contour level is 5% of...
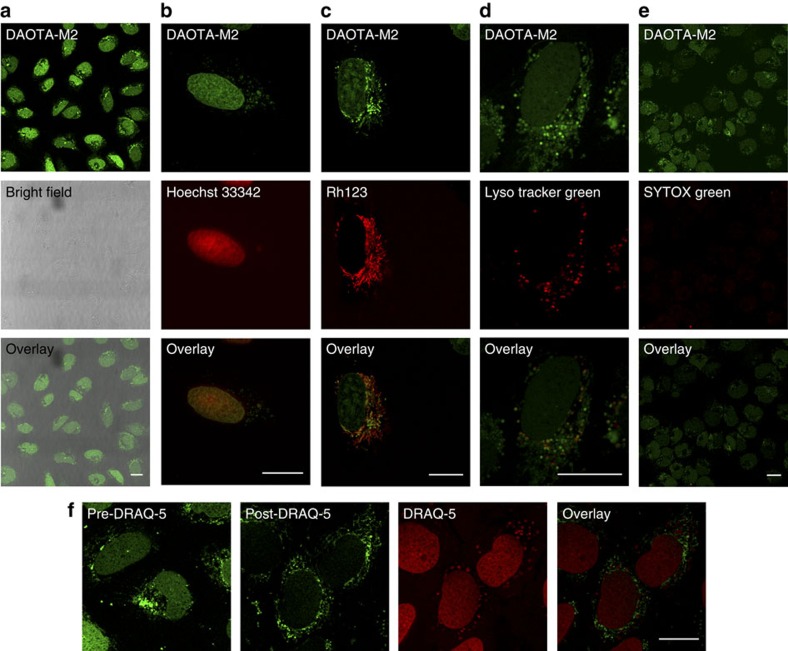
Figure 4
Confocal microscopy images of U2OS cells incubated with DAOTA-M2 .
( a ) The general staining observed in combination with the transmission bright-field image (20u2009u03bcM, 24u2009h). ( b - f ) Co-localization of DAOTA-M2 (5/20u2009u03bcM, 4/24u2009h, green) with (...
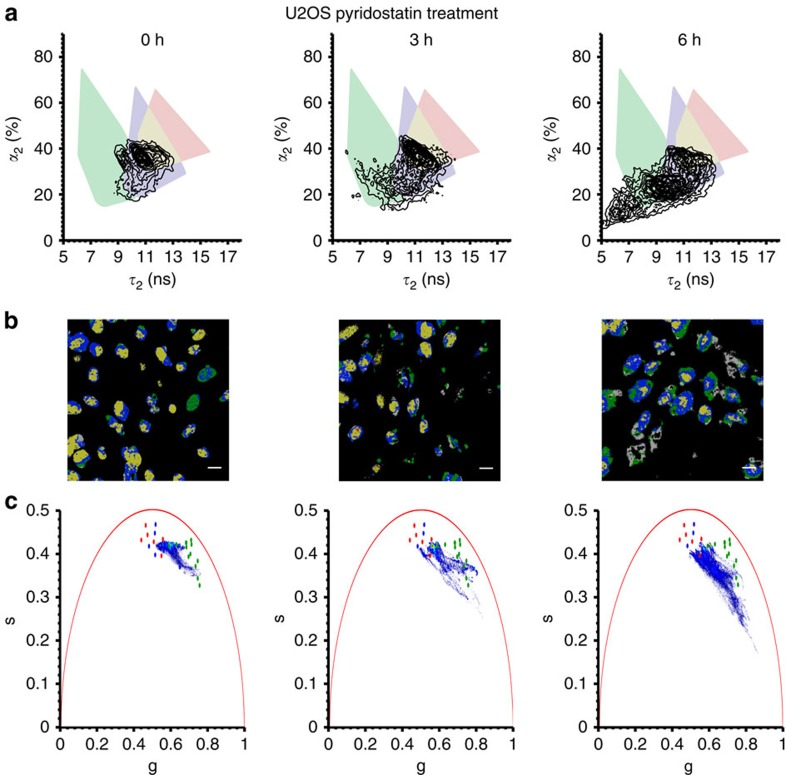
Figure 5
FLIM visualization of U2OS cells incubated with DAOTA-M2 (20u2009u03bcM, 24u2009h) and subsequently treated with G-quadruplex selective ligand pyridostatin (10u2009u03bcM) over time (0u20136u2009h).
( a ) Cellular u03c4 2 and u03b1 2 plotted in the form of a contour map and superimposed on in vitro nucleic acid models boundaries for G-quadruplexes (red), DNA (green), RNA (blue) or overlapping RNA...
Figure images are served from the NIH/NLM PubMed Central Open Access Subset or Europe PMC; copyright remains with the publishers and authors.
💬 Discussion
0 commentsNo comments yet. Be the first to start a discussion!
Leave a Comment