Abstract
Gustatory pheromones play an essential role in shaping the behavior of many organisms. However, little is known about the processing of taste pheromones in higher order brain centers. Here, we describe a male-specific gustatory circuit in Drosophila that underlies the detection of the anti-aphrodisiac pheromone (3R,11Z,19Z)-3-acetoxy-11,19-octacosadien-1-ol (CH503). Using behavioral analysis, genetic manipulation, and live calcium imaging, we show that Gr68a-expressing neurons on the forelegs of male flies exhibit a sexually dimorphic physiological response to the pheromone and relay information to the central brain via peptidergic neurons. The release of tachykinin from 8 to 10 cells within the subesophageal zone is required for the pheromone-triggered courtship suppression. Taken together, this work describes a neuropeptide-modulated central brain circuit that underlies the programmed behavioral response to a gustatory sex pheromone. These results will allow further examination of the molecular basis by which innate behaviors are modulated by gustatory cues and physiological state.
🔬 Techniques
🔭 Microscopes
🧬 Organisms
✨ Fluorophores
🧪 Sample Preparation
🏭 Microscope Brands
🧪 Reagent Suppliers
📷 Detectors
🔎 Objectives
💻 Software Details
📋 Protocols
💾 Data Repositories
🏛️ Research Organizations (ROR)
Affiliated research institutions:
📋 Methods
Fly stocks
The following lines were used: Or83b-Gal4 ( Larsson et al., 2004 ); Gr-Gal4 collection including Gr68a-Gal4 2 ( Weiss et al., 2011 ); Gr68a-Gal4 1 ( Bray and Amrein, 2003 ); ppk23-Gal4 , Δppk23 , and Δppk29 ( Thistle et al., 2012 ); Voila 1 ( Balakireva et al., 1998 ); NPF-Gal4 and NPFR1-Gal4 ( Wu et al., 2003 ); c929-Gal4 ( Hewes et al., 2003 ); oeno-Gal4 and UAS - hid , stinger ( Billeter et al., 2009 ); tsh-Gal80 (kind gift of Julie Simpson); UAS-GCaMP5G ( Akerboom et al., 2012 ); ΔTK1 , ΔTK2 , and UAS-TK ( Asahina et al., 2014 ); UAS-spGFP and LexAop-spGFP ( Gordon and Scott, 2009 ); TK-Gal4 1 (#51975), TK-Gal4 2 (#51974), TK-Gal4 3 (#51973), TK-LexA (#54080), UAS - mCD8:GFP , UAS - stinger , UAS - syt.eGFP , UAS - reaper , UAS - dORKΔC , UAS - DTI , UAS-Shibire ts1 , UAS-dTrpA1 (Bloomington Stock Center, Indiana, USA); UAS-Gr68a-RNAi (13380, 13381 from VDRC, Vienna, AU) and UAS-TK-RNAi (103662 from VDRC). All other stocks used for screening are described in Table 2 . Transgenic flies ΔGr68a and ΔGr68a -rescue ( Gr68a Res ) flies were generated by ends-out homologous recombination as previously described ( Chen et al., 2011 ) using the pw25-RMCE-targeting vectors and verified by PCR using primers to the vector sequence ( Weng et al., 2009 ). Loss of the Gr68a sequence was verified by quantitative PCR. To generate Gr68a-Gal4 and UAS - GCaMP5 -expressing alleles in the mutant and rescue backgrounds, Gr68a-Gal4 2 and UAS-GCaMP5 transgenes were re-combined onto flies with the ΔGr68a or Gr68a Res background and verified by labeling with UAS-mCD8::GFP .
Show full methods section
Fly stocks
The following lines were used: Or83b-Gal4 ( Larsson et al., 2004 ); Gr-Gal4 collection including Gr68a-Gal4 2 ( Weiss et al., 2011 ); Gr68a-Gal4 1 ( Bray and Amrein, 2003 ); ppk23-Gal4 , Δppk23 , and Δppk29 ( Thistle et al., 2012 ); Voila 1 ( Balakireva et al., 1998 ); NPF-Gal4 and NPFR1-Gal4 ( Wu et al., 2003 ); c929-Gal4 ( Hewes et al., 2003 ); oeno-Gal4 and UAS - hid , stinger ( Billeter et al., 2009 ); tsh-Gal80 (kind gift of Julie Simpson); UAS-GCaMP5G ( Akerboom et al., 2012 ); ΔTK1 , ΔTK2 , and UAS-TK ( Asahina et al., 2014 ); UAS-spGFP and LexAop-spGFP ( Gordon and Scott, 2009 ); TK-Gal4 1 (#51975), TK-Gal4 2 (#51974), TK-Gal4 3 (#51973), TK-LexA (#54080), UAS - mCD8:GFP , UAS - stinger , UAS - syt.eGFP , UAS - reaper , UAS - dORKΔC , UAS - DTI , UAS-Shibire ts1 , UAS-dTrpA1 (Bloomington Stock Center, Indiana, USA); UAS-Gr68a-RNAi (13380, 13381 from VDRC, Vienna, AU) and UAS-TK-RNAi (103662 from VDRC). All other stocks used for screening are described in Table 2 . Transgenic flies ΔGr68a and ΔGr68a -rescue ( Gr68a Res ) flies were generated by ends-out homologous recombination as previously described ( Chen et al., 2011 ) using the pw25-RMCE-targeting vectors and verified by PCR using primers to the vector sequence ( Weng et al., 2009 ). Loss of the Gr68a sequence was verified by quantitative PCR. To generate Gr68a-Gal4 and UAS - GCaMP5 -expressing alleles in the mutant and rescue backgrounds, Gr68a-Gal4 2 and UAS-GCaMP5 transgenes were re-combined onto flies with the ΔGr68a or Gr68a Res background and verified by labeling with UAS-mCD8::GFP .
Chemical reagents
The chemical syntheses of (3 S ,11 Z ,19 Z )-CH503, (3 R ,11 Z ,19 Z )-CH503, ( S )-3-Acetoxy-19-octacosen-1-ol and ( R )-3-Acetoxy-11, 19-octacosadiyn-1-ol have previously been described ( Mori et al., 2010 ; Shikichi et al., 2013 ). All other solvents and reagents were obtained from Sigma–Aldrich (St. Louis, MO, USA). Courtship assay Males (5–10 days old) were isolated at the pupal stage and raised at 23°C with 60% humidity in 10 ml polypropylene vials containing 2 ml of standard cornmeal media. A decapitated virgin female target and a 5–10 days old socially naïve experimental male were placed in a courtship chamber (∅: 10 mm, height: 3 mm) and digitally recorded for 30 min. The female courtship targets were perfumed with CH503 or evaporated solvent (control) as previously described ( Yew et al., 2009 ). Briefly, six female flies were placed in 1.5-ml glass vials containing 0.25, 0.5, 1, 2, or 4 μg of ( R , Z , Z )-CH503 and vortexed three times with 20 s rest intervals. Approximately 25% of the vial contents are transferred to the flies using this method ( Billeter et al., 2009 ). A single fly from each vial was tested using direct analysis in real time mass spectrometry (DART MS; [ Yew et al., 2008 , 2009 ]) to check the abundance of the CH503 signal relative to other cuticular hydrocarbons. For the tests of CH503 volatility, a 2-layer courtship chamber was constructed with the top layer containing a male and an unperfumed decapitated virgin female and the bottom layer containing filter paper overlaid with 64 μg of ( R , Z , Z )-CH503. To prepare female fly extract, 1 or 2 flies were submerged in hexane for 10 min at room temperature, after which the solvent was removed and added to the filter paper. The courting pairs % refers to the number of trials in which courtship was observed for longer than one minute divided by the total number of trials. Behavioral assays for perfumed and solvent-perfumed animals were performed in parallel. The courting pairs % was compared between pheromone and solvent-perfumed flies bearing the identical genetic background. Statistical analysis was performed using a Fisher's exact probability test with Yates correction (VassarStats, www.vassarstats.net ). Courtship vigor and latency were calculated for the 30 min observation period and compared using a one-way ANOVA with a Tukey's post-hoc test (SPSS Statistics, IBM, USA).
Screen for receptor and neural circuits associated with CH503 detection
Behavioral screens were performed using female targets perfumed with 83 ng/fly of ( S , Z , Z )-CH503 or 333 ng/fly dose of ( R , Z , Z )-CH503. Both doses were previously established as the minimum necessary for each stereoisomer to elicit significant courtship suppression ( Mori et al., 2010 ). Transgenic flies were generated using the Gal4–UAS system to drive expression of toxin or pro-apoptotic transgenes ( UAS - Reaper , UAS - DTI , and UAS-hid , stinger ) or transgenes that interfere with synaptic transmission ( UAS - Shibire ts1 and UAS – dORKΔC ). For Gr-Gal4 lines, UAS-Reaper was used since UAS-DTI expression led to low basal courtship activity. For central circuit screening, UAS - Shibire ts1 was used to avoid developmental lethality. For Gal4 lines in which UAS - Shibir e ts1 expression led to paralysis, seizures, or low courtship activity, UAS – dORKΔC was used as a milder form of neural inhibition. Knockdown of Gr68a expression was performed using an RNAi line since the use of other transgenes resulted in larval lethality. Manipulation of neurotransmitter levels was performed using RNAi to target the respective transporters, receptors, or biosynthetic enzymes. See Table 2 for a complete list of Gal4 and UAS-RNAi lines used for screening. For experiments involving temperature-sensitive transgenes ( UAS-Shibire ts1 and UAS-dTrpA1 ), flies were placed in a humidity-controlled incubator at 29°C for 2 hr prior to the assay to activate the transgene. Courtship chambers were placed on a hotplate pre-warmed to 29°C, during which time the flies were introduced into each chamber. The chamber was placed in an incubator at 29°C and the temperature was monitored throughout the assay. Control experiments were carried out in parallel at 23°C (for assays using UAS-Shibire ts1 ) or 19°C (for assays using UAS-dTrpA1 ).
Proboscis extension reflex assay
The proboscis extension reflex (PER) assay was performed as previously described ( Lacaille et al., 2007 ; Shiraiwa and Carlson, 2007 ). Virgin 1-day-old male and female flies were starved for 36 hr in a vial containing tissue soaked with water. Flies were mounted with nail polish on the dorsal side onto glass slides and placed in a humidified Petri dish for at least 2 hr prior to the assay. Paper wicks coated in 20 μl of a test solution were used for bilateral stimulation of the tarsi of mounted flies. One leg was touched with a paper wick soaked in 4% sucrose (in distilled H 2 O, wt/vol) while the second leg was simultaneously stimulated with one of the following solutions: (i) 4% sucrose, (ii) 25–100 μg/ml ( R , Z , Z )-CH503 in hexane, (iii) 0.25–25 μg/ml ( S , Z , Z )-CH503 in hexane, and (iv) 100 mM caffeine in dH 2 O. Each substance was tested three times with a 2 min rest between stimulations. A response was counted as positive when the fly extended its proboscis for at least 2 of 3 stimulations. The response to each substance was compared to the response induced by 4% sucrose alone using a Fisher's exact probability test. The assays were carried out at the same time each day, and the experimenter was blind to the identity and concentration of stimulants tested in the assay. Immunohistochemistry Adult Drosophila brains and thoracic ganglia from 6- to 10-day-old virgin flies were dissected in phosphate buffered-saline with 0.3% Triton X-100, pH 7.2 (PBST) and fixed in ice-cold 4% paraformaldehyde for 25 min. Samples were washed three times, for 15 min each in PBST, treated in a blocking solution containing PBST and 10% normal goal serum for 30 min at room temperature, and incubated in primary antibody solution. After three washes in PBST, the tissues were incubated overnight at 4°C in secondary antibody solution. Following three washes in PBST, the brains were mounted on glass slides with Vectashield mounting medium (Vector Laboratories, Burlingame, CA). Images were acquired on a Zeiss LSM 510 Meta inverted microscope equipped with 488, 543, and 633 nm lasers. For all tissues, 132 frames with a z step size of 0.46 μm were acquired. The following secondary antibodies used were anti-chicken 488 (1:500; Jackson ImmunoResearch Laboratories, West Grove, USA), anti-rabbit Cy3 (1:500; Jackson ImmunoResearch Laboratories), anti-guinea pig Cy3 (1:500; Jackson ImmunoResearch Laboratories), anti-mouse 633 (1:500; Jackson ImmunoResearch Laboratories). Image analysis was done using ImageJ software (NIH). The following primary antibodies and dilutions were used: chicken anti-GFP (1:1000; Abcam, Cambridge, UK), mouse anti-nc82a (1:50; Developmental Studies Hybridoma Bank, Iowa City, USA), mouse anti-GFP (1:1000, for GRASP; A11120, Life Technologies, NY, USA), mouse anti-GFP (1:100, for GRASP; G6539, Sigma–Aldrich), rabbit anti-NPF (1:2000; kind gift from P Shen; [ Wu et al., 2003 ]), and guinea pig anti-TK (1:2000; kind gift from D Anderson; [ Asahina et al., 2014 ]). The Pearson's coefficient, a measure of co-localization, was calculated using Imaris software (Bitplane AG, Zurich, Switzerland).
Quantitative PCR analysis
For each biological replicate, RNA from 200 flash-frozen fly forelegs (for Gr68a experiments) or 20 flash-frozen heads (for NPF experiments) was extracted using TRIzol Reagent (Ambion, Austin, TX, USA) according to manufacturer's instructions. DNAse treatment was performed using TURBO DNA-free kit (Ambion) and cDNA was synthesized with SuperScript III (Invitrogen, Waltham, MA, USA) with an oligo-dT primer. Quantitative PCR was performed using CFX Connect Real-Time PCR System (Bio-Rad, Hercules, CA, USA) and SYBR Fast ABI Prism qPCR kit (Kapa Biosystems, Wilmington, MA, USA). See Table 3 , for primer sequences and annealing temperatures. 10.7554/eLife.06914.033 Table 3. Primers used for quantitative and semi-quantitative (semi-Q) PCR experiments DOI: http://dx.doi.org/10.7554/eLife.06914.033 Forward primer (5′–3′) Reverse primer (5′–3′) Annealing temperature (°C) Gr68a (qPCR) CCAAGGTGATACCGAGGAGGAGA TCGTGAAGAGTGCGAAAGTG 60 Gr68a (semi-Q PCR) CCAAGGTGATACCGAGGAGA CATTGGCCAGCAGATACTCA 55 CG6024 CCAAGGTGATACCGAGGAGA TCATGAAGAGTGCGAAAGTG 60 NPF GCGAAAGAACGATGTCAACAC TGTTGTCCATCTCGTGATTCC 60 rp49 CCAAGGACTTCATCCGCCACC GCGGGTGCGCTTGTTCGATCC 55 RMCE vector GTACTGACGGACACACCGAAG GGATCAACTACCGCCACCT 52 In vivo Ca 2+ imaging In vivo GCaMP imaging experiments were performed on 14- to 28-day-old adults. A live fly was immobilized on a 0.17-mm coverslip with nail polish (Sally Hansen, USA). 10 µl of PBST were placed onto the tarsal segments using a pipette, after which three pre-stimulation images were acquired for a total duration of 2.4 s. For each measurement, 117 post stimulation images were acquired for a total duration of 93.6 s immediately after the addition of 10 µl of the natural stereoisomer of CH503, ( R , Z , Z )-CH503 (final concentrations of 50 or 500 ng in PBST). Identical conditions were used for measurements using ( S , Z , Z )-CH503. No reflux flow is used in the sample preparation. Control stimulants consisted of 10 µl of solvent or an analog of CH503: ( S )-3-Acetoxy-19-octacosen-1-ol (50 ng, final concentration) or ( R )-3-Acetoxy-11, 19-octacosadiyn-1-ol (500 ng, final concentration). The analogs were previously established to be behaviorally inert ( Shikichi et al., 2013 ). Images were acquired on a spinning disk confocal microscope (Ti-E; Nikon Instruments, Melville, USA) equipped with a CSU-X1 scan head (Yokogawa Electric, Tokyo, JA) and either a digital sCMOS camera (ORCA-Flash4.0; Hamamatsu Photonics, Shizuoka, JA) or a cooled CCD camera (CoolSNAP HQ2; Photometrics, Tucson, USA) using a 60×/1.4 N.A. oil objective lens. A 491 nm laser was used to excite the GCaMP5 reporter. Four Z-slices with a thickness of 0.5 µm each were acquired every 800 ms, for a total of 120 frames. To calculate the maximum change in fluorescence signal (∆F/F), the signal density over the whole cell body was divided by the signal from an equivalent volume of an adjacent region (background). Confocal Z-stacks were analyzed using ImageJ ( Schneider et al., 2012 ). For Gr68a-Gal4 -labeled neurons, ∆F/F was calculated from single neurons. For ppk23-Gal4 -labeled neurons on the foreleg, ∆F/F was calculated from the total signal from either two adjacent cell bodies or the base of the axon projections. Due to their close proximity to each other, some individual cell bodies could not be differentiated. In some experiments, the maximum ∆F/F occurred in projections though it could not be discerned from which cell body the projection originated. For proboscis measurements, ∆F/F represents the averaged values from 14 cells (for CH503 stimulation) or 20 cells (for PBST stimulation), measured from 5–6 flies. For all measurements, the averaged, normalized response to the stimulant vs the averaged, normalized response to control solvent was compared using a Student's t -test for equal or unequal variances (Vassar Stats). Comparison of variance was determined with an F-Test (Vassar Stats). Statistical power analysis was performed using G*Power 3 ( Faul et al., 2007 ).
📊 Figures
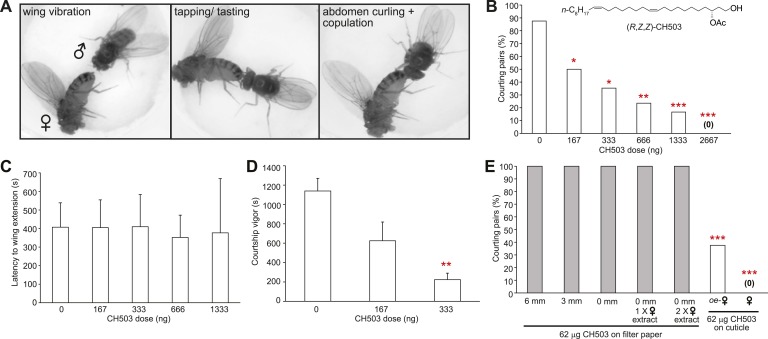
Figure 1.
Functional properties of the male sex pheromone CH503.
( A ) The typical courtship sequence of D. melanogaster is comprised of wing vibration performed by the male towards the female, tapping and tasting of the female abdomen with the forelegs, and abdome...
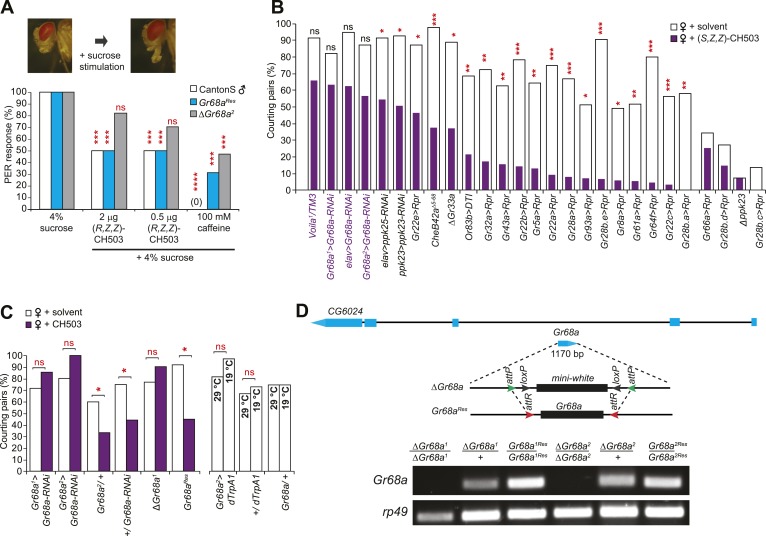
Figure 2.
Gr68a expression in the male foreleg is required for CH503 detection.
( A ) Simultaneous stimulation of the male foreleg with 4% sucrose and CH503 or caffeine significantly inhibits the proboscis extension reflex (PER; shown in pictures) in CantonS males (white). The PE...
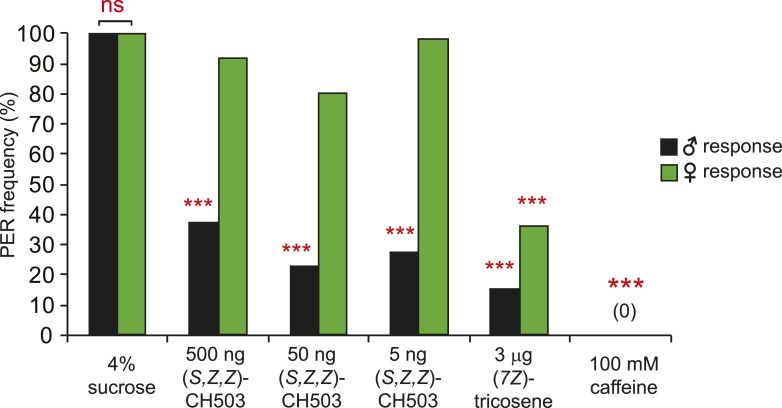
Figure 2u2014figure supplement 1.
Sexually dimorphic PER response to CH503.
The PER response to ( S, Z, Z ) - CH503 is sexually dimorphic. Females do not respond to the more potent stereoisomer ( S, Z, Z )-CH503 (green) while males respond across a range of doses (black). Bot...
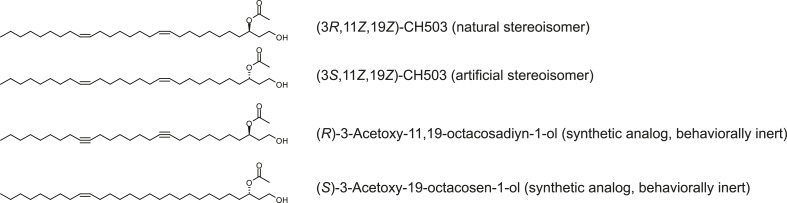
Figure 2u2014figure supplement 2.
Chemical structures of ( R, Z, Z )-CH503, ( S, Z, Z )-CH503, and CH503 analogs.
DOI: http://dx.doi.org/10.7554/eLife.06914.006
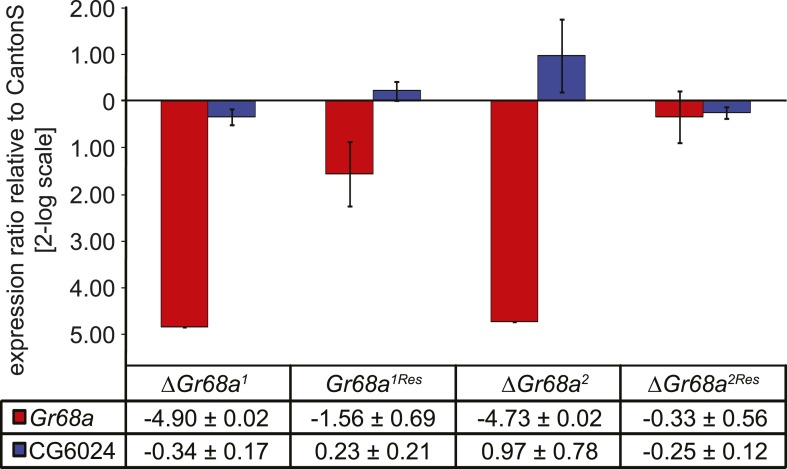
Figure 2u2014figure supplement 3.
Characterization of u0394Gr68a mutant alleles by quantitative PCR.
Gr68a levels are effectively reduced in homologous recombinant mutant ( u0394Gr68a ) and restored in rescue ( Gr68 Res ) alleles. Gene expression levels are shown normalized to wild-type CantonS level...
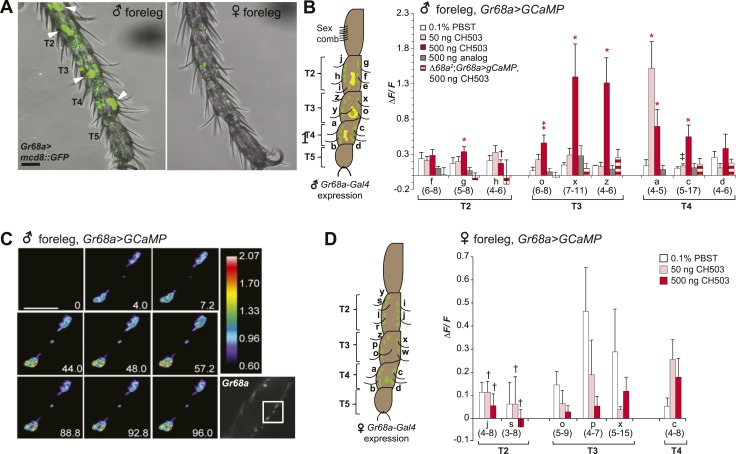
Figure 3.
Gr68a is essential for CH503-evoked neuronal responses in the male foreleg.
( A ) Visualization of GFP-labeled Gr68a-expressing neurons reveals neuronal and non-neuronal cells (arrowheads) in tarsal segments T2-5 from the male foreleg. Scale bar: 35 u03bcm. ( B ) Gr68a-expres...
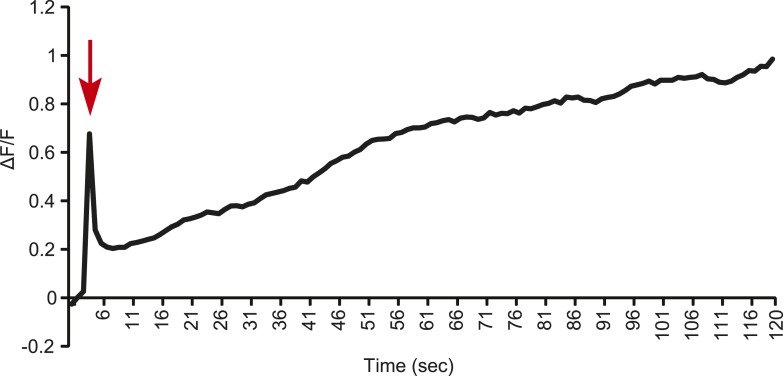
Figure 3u2014figure supplement 1.
Line graph representation showing the tonic response of a T2 Gr68a neuron upon stimulation with 500 ng of CH503.
Red arrow indicates the time at which the stimulus was added. DOI: http://dx.doi.org/10.7554/eLife.06914.009
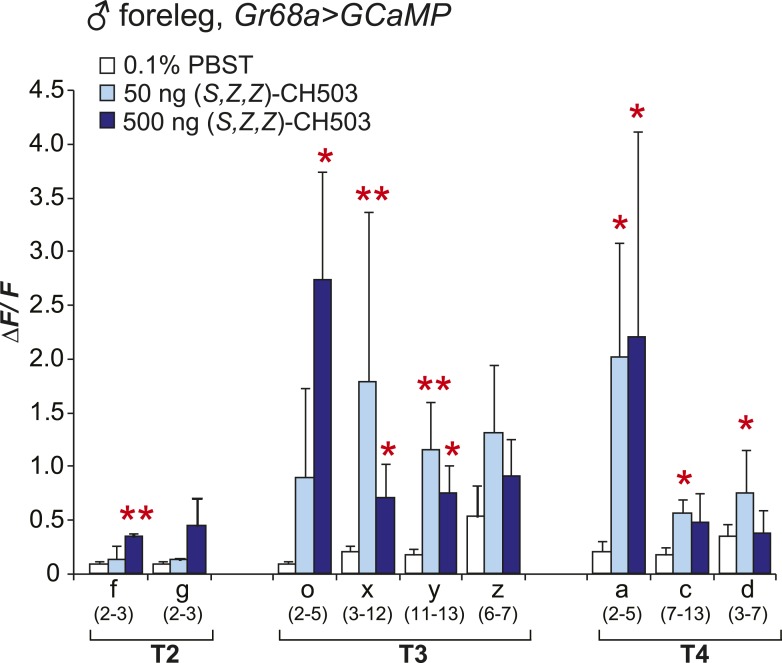
Figure 3u2014figure supplement 2.
Physiological responses of male Gr68a neurons to (S, Z , Z )-CH503.
An increase in intracellular Ca 2+ levels was observed in Gr68a-expressing neurons upon application of ( S , Z , Z )-CH503. Two cells (o, x) showed a higher u0394F/F increase in response to 500 ng of ...
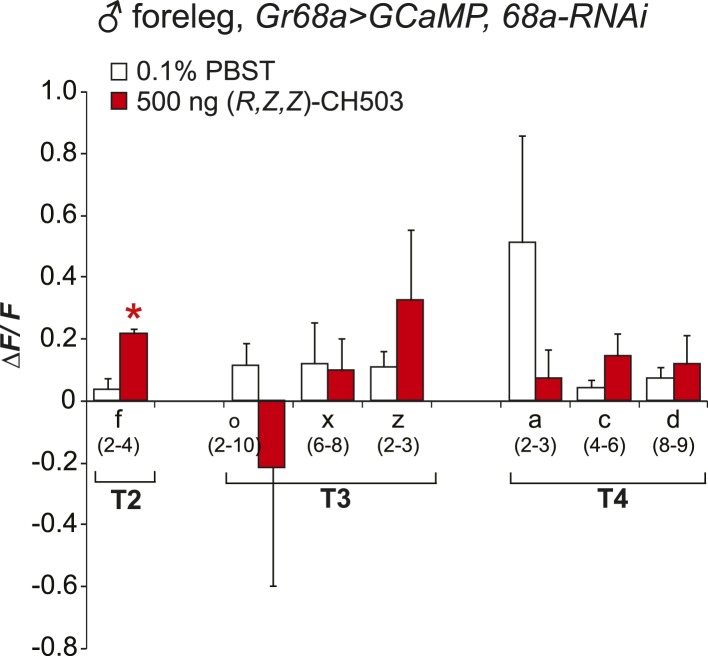
Figure 3u2014figure supplement 3.
Physiological responses of Gr68a neurons upon RNAi-mediated silencing of Gr68a expression.
RNAi-mediated suppression of Gr68a severely reduces neural responses induced by ( R , Z , Z )-CH503 (red). In most cells, the response to the pheromone was not distinguishable from the response to buf...
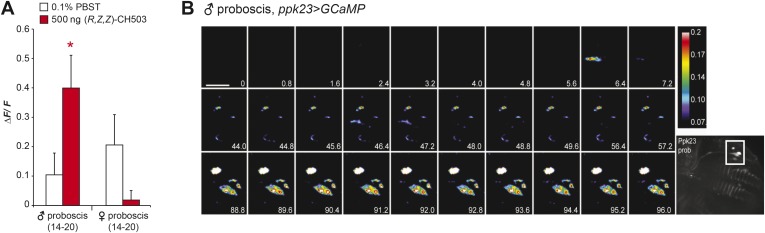
Figure 3u2014figure supplement 4.
Physiological responses of ppk23 proboscis neurons to ( R , Z , Z )-CH503.
( A ) Application of 500 ng of CH503 elicited a significant u0394F/F increase in ppk23-expressing neurons on the male proboscis (red). In contrast, ppk23-expressing neurons from the female proboscis d...
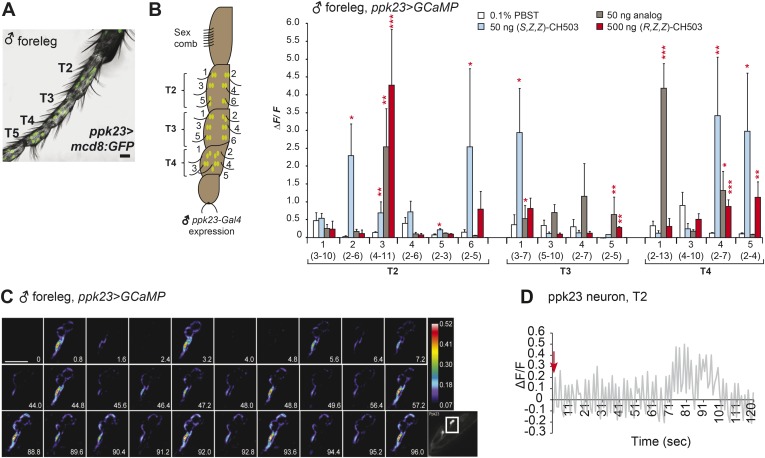
Figure 3u2014figure supplement 5.
Physiological responses of ppk23 leg neurons to ( R, Z, Z )-CH503.
( A ) Visualization of GFP-labeled ppk23-expressing neurons in the male foreleg in tarsal segments T2-5. Scale bar: 35 u03bcm. ( B ) Ppk23-expressing neurons on tarsal segments T2-5 were stimulated wi...
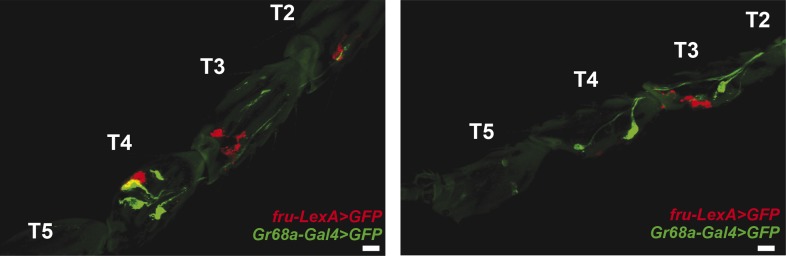
Figure 3u2014figure supplement 6.
Gr68a-Gal4 and fruitless (fru) -expression in the foreleg do not co-localize.
Pearson's coefficients: 0.06 (left) and 0.02 (right); scale bar: 50 u03bcm. DOI: http://dx.doi.org/10.7554/eLife.06914.014
Video 1.
Physiological response from Gr68a neurons on the male foreleg expressing GCaMP.
Cell bodies in T3 exhibit a tonic response upon stimulation with 500 ng of CH503. DOI: http://dx.doi.org/10.7554/eLife.06914.016
Video 2.
Physiological response from ppk23 neurons on the male proboscis expressing GCaMP.
Following stimulation with 500 ng of CH503, the projections of ppk23 neurons exhibit a bursting response. The cell bodies respond in a tonic manner, displaying a gradual increase in fluorescence inten...
Video 3.
Physiological response from ppk23 neurons on the male foreleg expressing GCaMP.
Following stimulation with 500 ng of CH503, cell bodies and projections in T3 display a bursting response. DOI: http://dx.doi.org/10.7554/eLife.06914.018
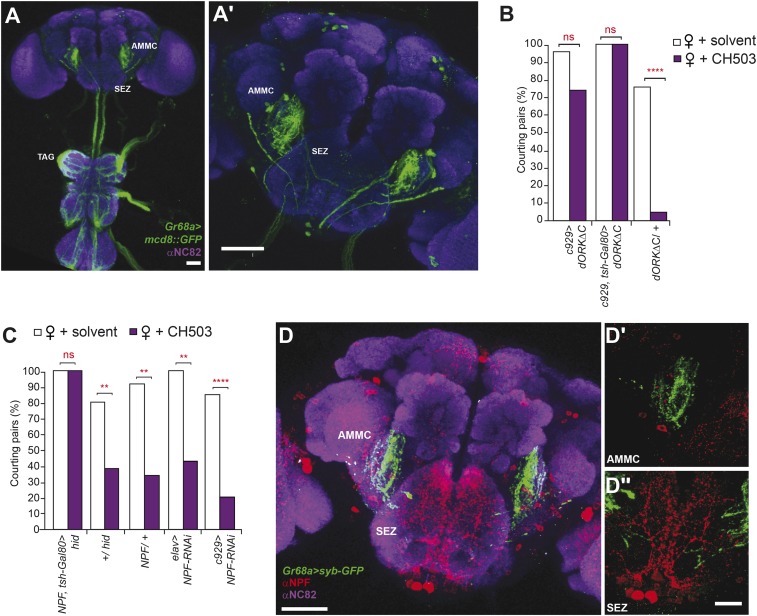
Figure 4.
Higher order neural circuits essential for processing CH503.
( A ) Gr68a -Gal4 -labeled afferent projections extend to the thoracico-abdominal ganglia (TAG), subesophageal zone (SEZ), and antennal mechanosensory and motor center (AMMC). Image represents a maxim...
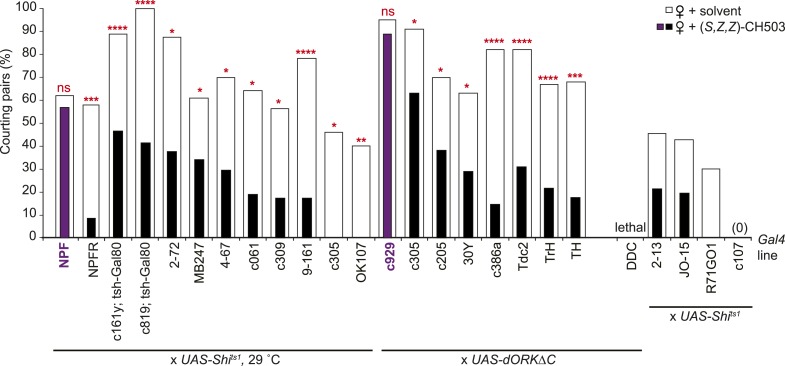
Figure 4u2014figure supplement 1.
Central brain screen to identify CH503-processing circuits.
Inactivation of neural activity by expression of the temperature-sensitive Shibire transgene ( UAS-Shi ts1 ) or UAS-dORKu0394C within NPF - and c929-Gal4 circuits resulted in a loss of sensitivity to ...
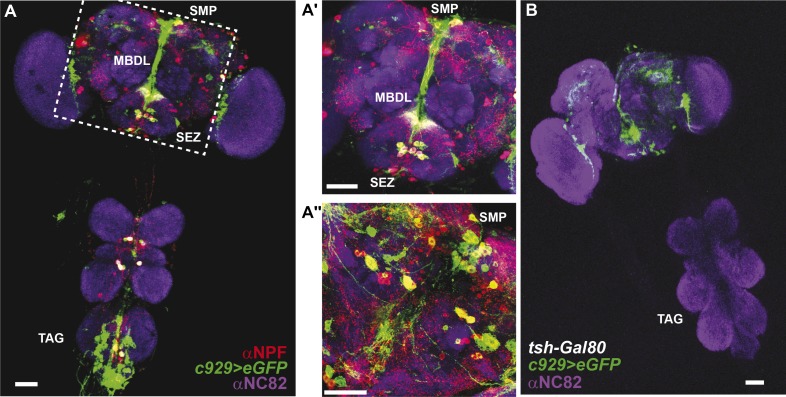
Figure 4u2014figure supplement 2.
Co-expression of anti-NPF immunostaining with c929-Gal4 -directed GFP expression.
( A ) Co-expression is observed in cell bodies housed in the thoracico-abdominal ganglia (TAG), subesophageal zone (SEZ), superior medial protocerebrum (SMP), and processes along the median bundle (MB...
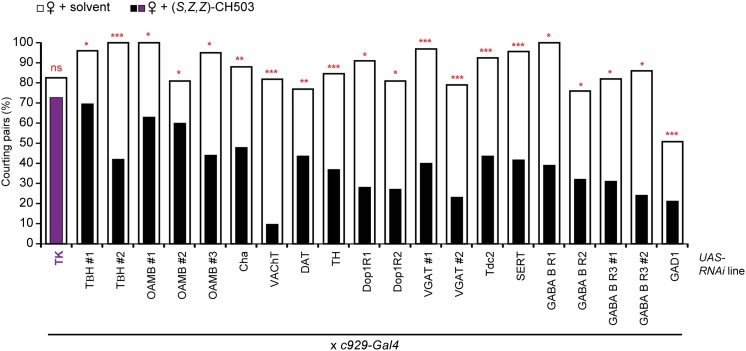
Figure 4u2014figure supplement 3.
Screen of tachykinin and small transmitter systems within the c929-Gal4 circuit.
RNAi-mediated silencing of tachykinin (TK) expression within the c929-Gal4 circuit inhibits sensitivity to ( S, Z, Z )-CH503 (purple vs white). RNAi manipulation of other neurotransmitter systems did ...
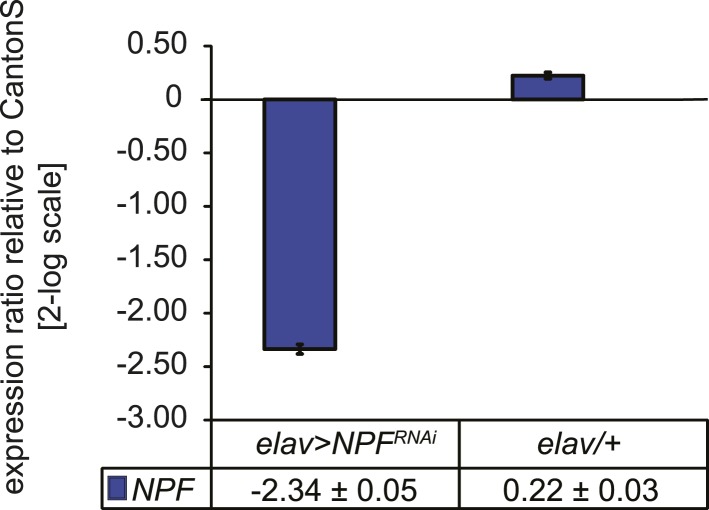
Figure 4u2014figure supplement 4.
Characterization of NPF transcript levels.
Quantitative PCR analysis of NPF transcript levels from heads of elav>NPF - RNAi and elav/+ control flies. RNAi induces a 5.3-fold reduction of NPF transcript levels. Gene expression levels are shown ...
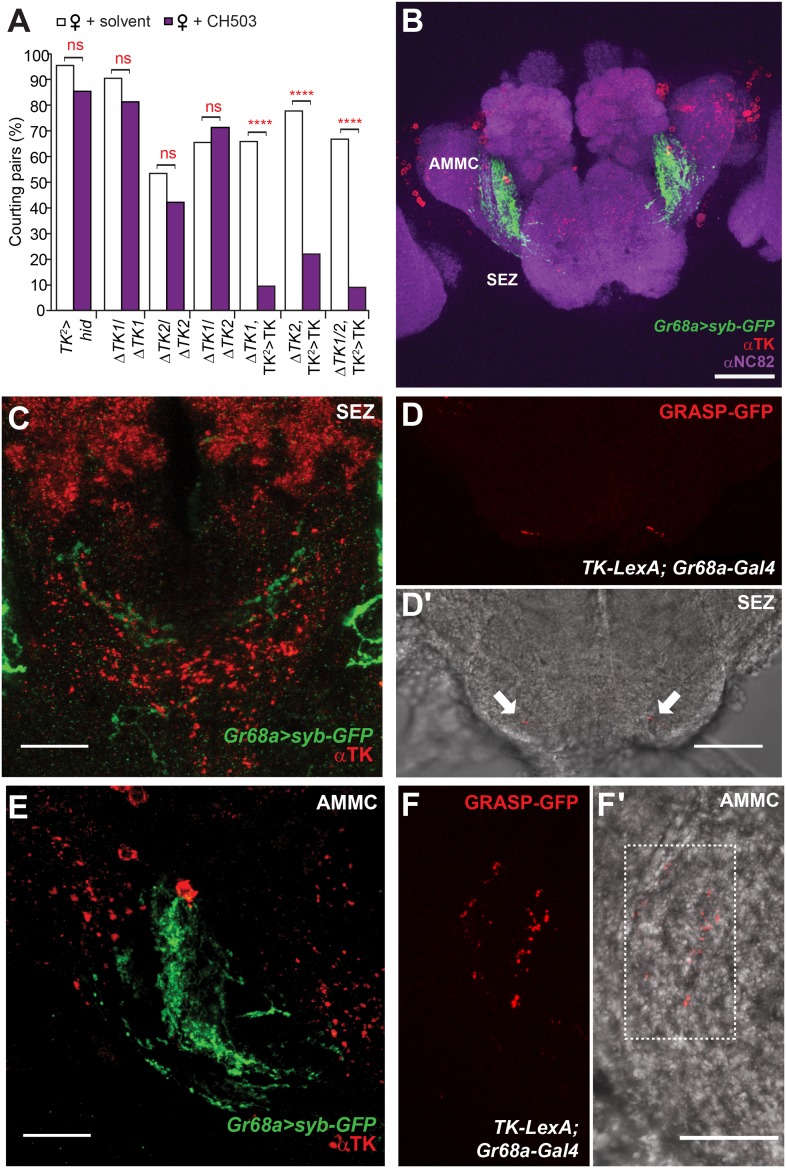
Figure 5.
Tachykinin-expressing cells in the SEZ are a second order circuit for Gr68a neurons.
( A ) Ablation of TK-expressing circuits using two independent Gal4 drivers ( TK 2 and TK 3 ) removed sensitivity to CH503. Homozygous or trans-heterozygous u0394 TK deletion mutants also exhibit a lo...
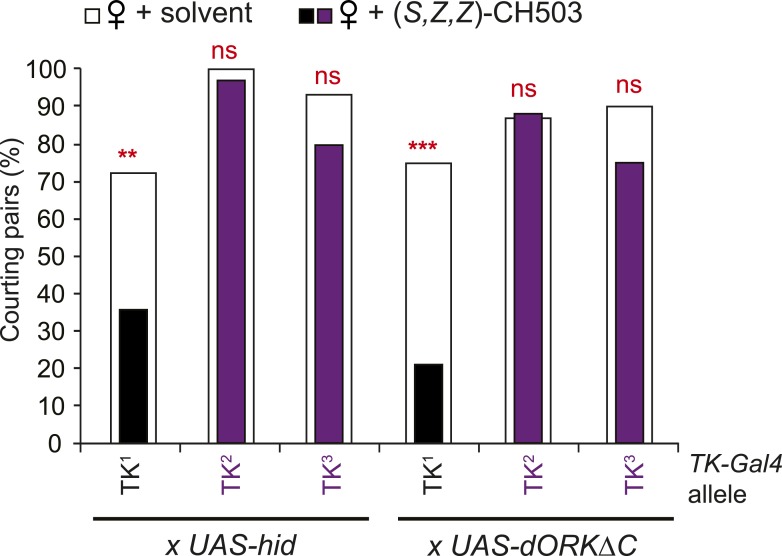
Figure 5u2014figure supplement 1.
Tachykinin is essential for CH503 detection.
Three different TK-Gal4 drivers were tested for their contribution to CH503 processing. Cell ablation or inactivation of neural activity using TK 2 -Gal4 and TK 3 -Gal4 (purple vs white) but not TK 1 ...
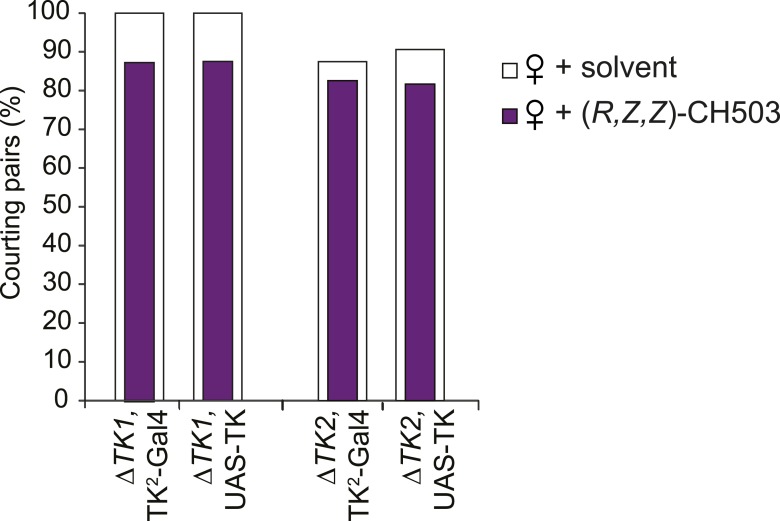
Figure 5u2014figure supplement 2.
Parental control lines for tachykinin mutant rescue experiments.
The presence of the Gal4 or UAS transgene is not sufficient to rescue the response to CH503. N = 23u201330, Fisher's exact probability test, all results are not significant. DOI: http://dx.doi.org/10....
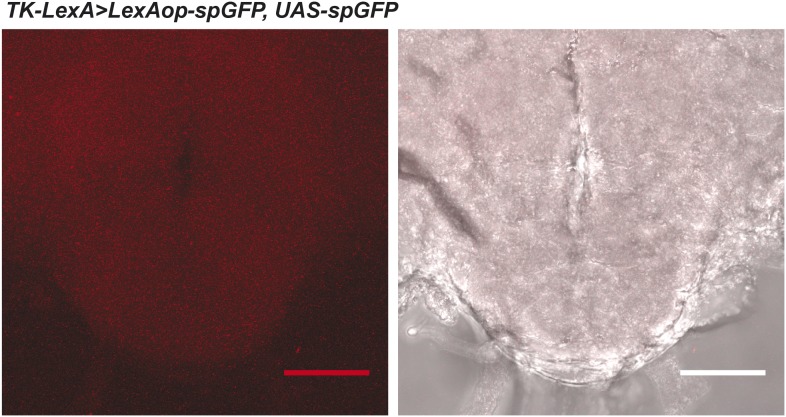
Figure 5u2014figure supplement 3.
Non-specific diffuse staining is observed in tissue from GRASP negative controls lacking the Gr68a-Gal4 driver.
Left: the brightness of the confocal image is exaggerated in order to visualize the tissue. Right: the fluorescent image is overlaid on a phase-contrast image of the tissue. Scale bar: 50 u03bcm. DOI:...
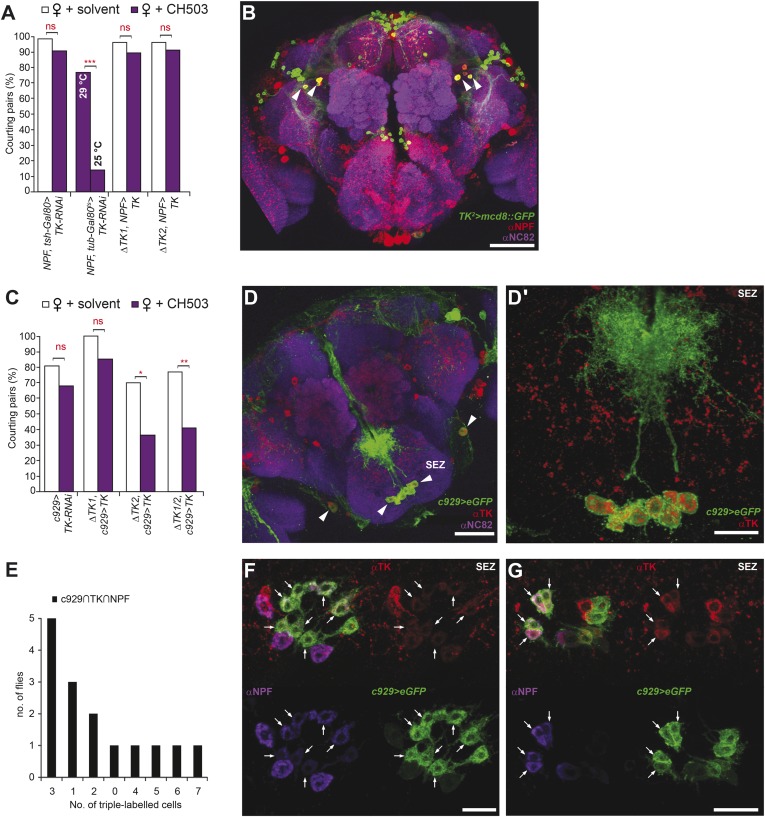
Figure 6.
Tachykinin release within the NPF - and c929 -defined circuits is required for the processing of CH503.
( A ) RNAi-mediated knockdown of TK only in central NPF-Gal4 circuits abrogates the CH503-induced courtship suppression response. Conditional knockdown only from late pupal stage onwards (29u00b0C per...
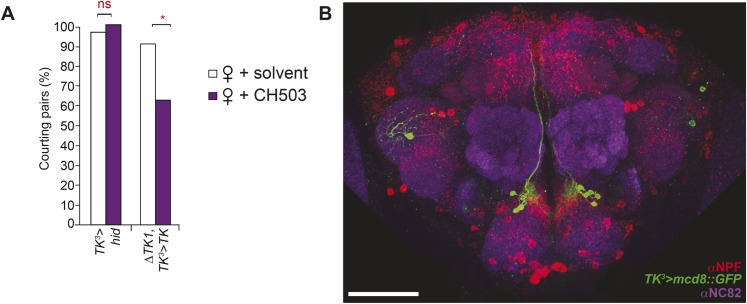
Figure 6u2014figure supplement 1.
The TK 3 -Gal4 circuit does not co-localize with NPF.
( A ) Inactivation of TK neurons using a third TK-Gal4 line results in a loss of sensitivity to CH503. The sensitivity is restored upon rescue of TK expression. ( B ) No co-localization or co-expressi...
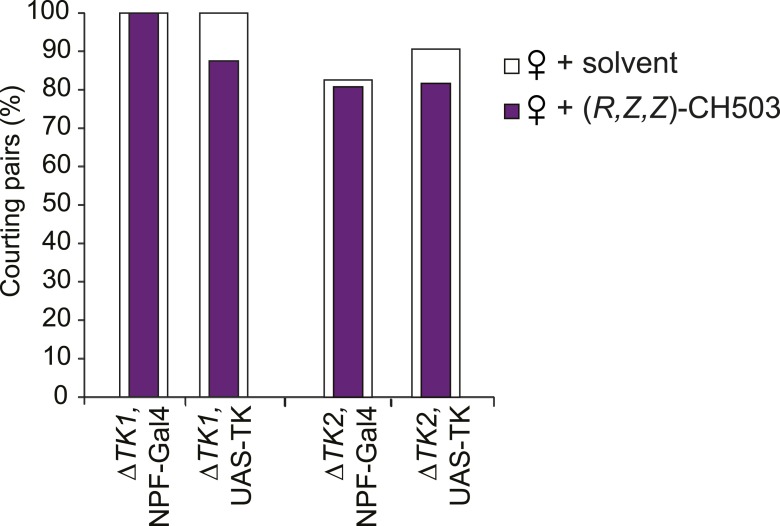
Figure 6u2014figure supplement 2.
Parental control lines for tachykinin mutant rescue experiments.
N = 24u201332, Fisher's exact probability test, all results are not significant. DOI: http://dx.doi.org/10.7554/eLife.06914.031
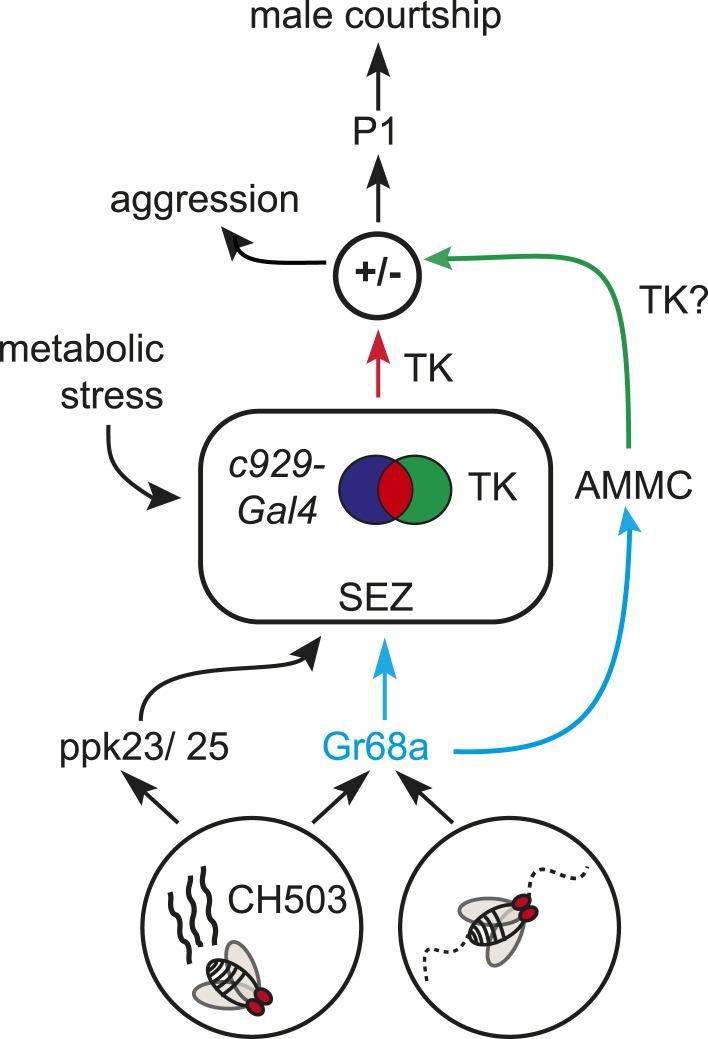
Figure 7.
A model for gustatory pheromone perception in peripheral and central neural circuits.
Gr68a neurons on the foreleg relay chemosensory and mechanosensory signals to the subesophageal zone (SEZ) and AMMC, respectively. Movement detection via Gr68a neurons contributes to the decision to c...
Figure images are served from the NIH/NLM PubMed Central Open Access Subset or Europe PMC; copyright remains with the publishers and authors.
💬 Discussion
0 commentsNo comments yet. Be the first to start a discussion!
Leave a Comment