Abstract
Mosquitoes are important vectors of disease and require sources of carbohydrates for reproduction and survival. Unlike host-related behaviors of mosquitoes, comparatively less is understood about the mechanisms involved in nectar-feeding decisions, or how this sensory information is processed in the mosquito brain. Here we show that Aedes spp. mosquitoes, including Aedes aegypti , are effective pollinators of the Platanthera obtusata orchid, and demonstrate this mutualism is mediated by the orchid’s scent and the balance of excitation and inhibition in the mosquito’s antennal lobe (AL). The P. obtusata orchid emits an attractive, nonanal-rich scent, whereas related Platanthera species—not visited by mosquitoes—emit scents dominated by lilac aldehyde. Calcium imaging experiments in the mosquito AL revealed that nonanal and lilac aldehyde each respectively activate the LC2 and AM2 glomerulus, and remarkably, the AM2 glomerulus is also sensitive to N,N-diethyl-meta-toluamide (DEET), a mosquito repellent. Lateral inhibition between these 2 glomeruli reflects the level of attraction to the orchid scents. Whereas the enriched nonanal scent of P. obtusata activates the LC2 and suppresses AM2, the high level of lilac aldehyde in the other orchid scents inverts this pattern of glomerular activity, and behavioral attraction is lost. These results demonstrate the ecological importance of mosquitoes beyond operating as disease vectors and open the door toward understanding the neural basis of mosquito nectar-seeking behaviors.
🔬 Techniques
🔭 Microscopes
🧬 Organisms
💻 Software
✨ Fluorophores
🧪 Sample Preparation
🏭 Microscope Brands
🔴 Lasers
💻 Software Details
💾 Data Repositories
🏛️ Research Organizations (ROR)
Affiliated research institutions:
📋 Methods
Procedures for floral volatile organic compound (VOC) collection and analysis, mosquito rearing, the preparation used for GC-EAD experiments, behavior experiments and associated stimuli, olfactory stimuli and pharmacological reagents used in calcium imaging experiments, and immunohistochemistry are described in SI Appendix , Supplementary Methods . Orchid-Pollinator Observations and Pollination Experiments. Flower observations. Pollinator activity was monitored in the Okanogan-Wenatchee National Forest (47.847° N, 120.707° W; WA) from late June to early July in 2016 and 2017 when the flowers of P. obtusata were in full bloom. Multiple direct and video observations of varying lengths from 30 min to 2.5 h were made for a total of 46.7 h (15 h of direct and 31.7 h of video recordings). The observations were conducted from 10 AM to 8 PM when mosquitoes were found to visit the flowers. Observations were recorded by visually inspecting each plant, with the trained observer ∼1 m away from the plant—this distance did not influence the feeding and mosquito–flower visitation since no mosquito took off from the plant in the field and instead remained busy feeding from flower after flower. To further prevent the potential for observer interference, video observations were made using GoPro Hero4 Silver (San Mateo, CA) fitted with a 128 GB Lexar High-Performance 633× microSD card. Videos were set at 720-pixel resolution, 30 frames per second, and “narrow” field of view. These settings were optimized for the memory capacity, battery life, and best resolution by the camera. Both observation methods, direct and video, provided similar visitation rates. The visitation time, insect identity, leg color, and sex (for mosquitoes), were recorded from both direct and video observations. The number of feedings (defined by the probing into the flower using the proboscis) and visits (nonfeeding or resting) were quantified per hour per flower for each pollinator type. Over the course of the experiments and observations, temperatures ranged from 9.6 °C to 32.3 °C, with a relative humidity range of 13.4 to 100% (iButtons; Maxim Integrated, San Jose, CA, DS1923). These experiments, therefore, captured both sunny and rainy weather conditions that were common in this area at this time of the year. Pollinator addition experiments. To evaluate the contribution of mosquitoes to the pollination of P. obtusata orchids, we performed pollinator addition experiments during June through July in 2016. Mosquitoes were collected from the Okanogan-Wenatchee National Forest using Centers for Disease Control Wilton traps baited with carbon dioxide (John W. Hock Company, Gainesville, FL). Carbon dioxide traps provide a standardized method to sample the mosquito assemblages near and among wetland habitats ( 41 , 42 ). Traps were placed within the sedge habitat, but more than 60 m from the nearest focal flower patch to prevent any disturbance. P. obtusata from the same site was enclosed in BugDorm cages (30 cm × 30 cm × 30 cm; BioQuip Products, Rancho Dominguez, CA, 1452) for which the bottom panel was removed to cover the orchid. Thirty mosquitoes were introduced into each cage through a sleeve located on the front panel and left without human interference for a duration of 48 h, after which the mosquitoes were collected from the enclosures and identified. The number and species of mosquitoes with pollinium attached were recorded, and the plant was bagged for determination of the fruit-to-flower ratio at the end of the field season. A total of 19 enclosures were used, 11 enclosures with a single plant and 8 enclosures with 2 to 3 plants. Pollen limitation studies. To determine the importance of pollination and out-crossing on P. obtusata fruit set, plants were subjected to 4 different experimental treatments during the June through July summer months. For 2 wk, plants were either unbagged ( n = 20 plants) or bagged to prevent pollinator visitation ( n = 19 plants). Organza bags (model B07735-1; Housweety, Causeway Bay, Hong Kong) were used to prevent pollinators from visiting the flowers. In addition, we determined the importance of cross- and self-pollination for P. obtusata . For cross-pollination, 6 pollinia were removed from 2 plants using a toothpick and gently brushed against the stigma of a neighboring plant ( n = 11 plants). To examine the effects of self-pollination, 6 pollinia were removed from 3 flowers and gently brushed the flowers on the same plant ( n = 9 plants). At the end of the field season, the number of flowers and the number of fruits produced per individual plants were recorded and the fruit-to-flower ratios were calculated. For comparing the fruit weights and the seed set for each treatment, up to 4 fruits from each individual of P. obtusata were collected. The weights were measured with a digital scale (Mettler Toledo, Columbus, OH), and the number of viable seeds per fruit were counted using an epifluorescent microscope (60× magnification; Nikon Ti4000). Fruit weights and seed sets were compared using a Student’s t test; fruit-to-flower ratios were compared using a Mann–Whitney U test. GC-EAD. Electroantennogram signals were filtered and amplified (100×; 0.1 to 500 Hz) using an A-M 1800 amplifier (Sequim, WA) connected to a personal computer via a BNC-2090A analog-to-digital board (National Instruments, Austin, TX) and digitized at 20 Hz using WinEDR software (Strathclyde Electrophysiology Software, Glasgow, UK). A Hum Bug noise eliminator (Quest Scientific, Vancouver, Canada) was used to decrease electrical noise. The antennal responses to peaks eluting from the GC were measured for each mosquito preparation and each peak and mosquito species. Bioactive peaks were those that elicited strong EAD responses, corresponding to deflections beyond the average noise floor of the baseline EAD signal. Responses by each individual preparation were used for principal component analysis (Ade4 package, R). The responses of 8 different mosquito species were tested to the scent extracts of 3 orchid species ( n = 8 mosquito species for P. obtusata and n = 4 mosquito species each for P. stricta and P. huronensis , with 3 to 17 replicates per mosquito species per orchid, for a total of 109 GC-EAD experiments). Two-Photon Excitation Microscopy. Calcium imaging in the Ae. increpitus mosquito AL. Odor-evoked responses in the Ae. increpitus mosquito AL were imaged with 9 female mosquitoes at the beginning of the season when mosquitoes were relatively young (as defined by wing and scale appearance). Calcium imaging experiments were conducted using application of the calcium indicator Fluo4 to the mosquito brain and using a stage that allows simultaneous calcium imaging and tethered flight ( 22 ). The mosquito was cooled on ice and transferred to a Peltier-cooled holder that enables the mosquito head to be fixed to the stage using UV glue. The custom stage permits the superfusion of saline to the head capsule and space for movement by the wings and proboscis ( 22 ) ( Fig. 3 ). Once the mosquito was fixed to the stage, a window in its head was cut to expose the brain, and the brain was continuously superfused with physiological saline ( 21 , 22 ). Next, the perineural sheath was gently removed from the AL using fine forceps, and 75 µL of the Fluo4 solution—made by 50 mg of Fluo4 in 30 µL Pluronic F-127 and then subsequently diluted in 950 µL of mosquito physiological saline—was pipetted to the holder allowing the brain to be completely immersed in the dye. Mosquitoes were kept in the dark at 15 °C for 1.5 h (the appropriate time for adequate penetration of the dye into the tissue), after which the brain was washed 3 times with physiological saline. After the rinse, mosquitoes were kept in the dark at room temperature for ∼10 to 20 min before imaging. Wing stroke amplitudes were acquired and analyzed using a custom camera-based computer vision system at frame rates of 100 Hz ( 22 , 43 ), where the mosquito was illuminated with infrared LEDs (880 nm), and images were collected with an infrared-sensitive camera synched to the 2-photon system. Stimulus-evoked initiation of flight and changes in the amplitude of the wing-stroke envelope were characterized for each odor stimulus (sensu ref. 22 ). Calcium-evoked responses in the AL were imaged using the Prairie Ultima IV 2-photon excitation microscope (Prairie Technologies) and Ti-Sapphire laser (Chameleon Ultra; Coherent). Experiments were performed at a depth of 40 µm from the ventral surface of the AL, allowing the calcium dynamics from ∼18 to 22 glomeruli to be repeatedly imaged across preparations. Images were collected at 2 Hz, and for each odor stimulus images were acquired for 35 s, starting 10 s before the stimulus onset. Imaging data were extracted in Fiji/ImageJ and imported into Matlab (v2017; Mathworks, Natick, MA) for Gaussian filtering (2 × 2 pixel; σ = 1.5 to 3) and alignment using a single frame as the reference at a given imaging depth and subsequently registered to every frame to within 1/4 pixel. Trigger-averaged ΔF/F was used for comparing glomerular responses between odor stimuli. After an experiment, the AL was sequentially scanned at 1-µm depths from the ventral to dorsal surface. Ventral glomeruli to the 40-µm depth were 3-dimensionally (3D) reconstructed using Reconstruct software or Amira v5 (Indeed-Visual Concepts, Houston TX) to provide glomerular assignment and registration between preparations. Glomeruli in the ventral region of the AL, based on their positions, were tentatively assigned names similar to those in Ae. aegypti ( 22 , 44 ). Calcium imaging in the Ae. aegypti mosquito AL. Odor-evoked responses in the Ae. aegypti AL were imaged taking advantage of our genetically encoded PUb-GCaMPs mosquito line ( 20 ). A total of 20 preparations were used: 10 for single odorant and orchid mixture experiments, 6 for ratio experiments, and 4 for experiments using GABA-receptor antagonists. Glomeruli were imaged at 40 µm from the ventral surface, as glomeruli at this depth show strong responses to odorants in the orchid headspace, including nonanal, octanal, and lilac aldehyde, and at this depth, ∼14 to 18 glomeruli can be neuroanatomically identified and registered between preparations. The expression of GCaMP occurred in glia, local interneurons, and projection neurons. Nevertheless, double-labeling for GFP (GCaMPs) and glutamine synthase (GS; glial marker) revealed broad GFP labeling that did not always overlap with the glial stain, with GS staining often occurring on astroglial-like processes on the rind around glomeruli, and strong GFP occurring within the glomeruli ( SI Appendix , Fig. S10 ). Thus, in our calcium imaging experiments we took care to image from the central regions of the glomeruli and avoid the sheaths and external glomerular loci. Moreover, strong GFP staining occurred in soma membranes located in the medial and lateral cell clusters, which contain the projection neurons and GABAergic local interneurons, respectively; the vast majority of these cell bodies did not stain for GS ( SI Appendix , Fig. S10 ). Relatedly, GCaMP6s expression is very high in AL local interneurons and projection neurons (PNs), such that during odor stimulation the PNs and axonal processes can often be imaged, and 3D reconstructions can take place through simultaneous optical sections with odor stimulation. Nonetheless, we assume the glomerular responses are a function of multiple cell types. In other insects, GABAergic modulation has been shown to operate on olfactory receptor neurons, local interneurons, and PNs ( 27 – 29 ). Similar to experiments with Ae. increpitus , the majority the mosquitoes were UV glued to the stage to allow free movement of their wings and proboscis; however, for experiments using GABA-receptor antagonists the proboscis was glued to the stage for additional stability. Once the mosquito was fixed to the stage, a window in its head was cut to expose the brain, and the brain was continuously superfused with physiological saline ( 21 ). Data and Resource Availability. Data on the behavioral, chemical, ecological, and calcium imaging experiments can be found on Mendeley Data. Software is available at https://github.com/riffelllab . Mosquito lines are available upon request.
Show full methods section
Procedures for floral volatile organic compound (VOC) collection and analysis, mosquito rearing, the preparation used for GC-EAD experiments, behavior experiments and associated stimuli, olfactory stimuli and pharmacological reagents used in calcium imaging experiments, and immunohistochemistry are described in SI Appendix , Supplementary Methods . Orchid-Pollinator Observations and Pollination Experiments. Flower observations. Pollinator activity was monitored in the Okanogan-Wenatchee National Forest (47.847° N, 120.707° W; WA) from late June to early July in 2016 and 2017 when the flowers of P. obtusata were in full bloom. Multiple direct and video observations of varying lengths from 30 min to 2.5 h were made for a total of 46.7 h (15 h of direct and 31.7 h of video recordings). The observations were conducted from 10 AM to 8 PM when mosquitoes were found to visit the flowers. Observations were recorded by visually inspecting each plant, with the trained observer ∼1 m away from the plant—this distance did not influence the feeding and mosquito–flower visitation since no mosquito took off from the plant in the field and instead remained busy feeding from flower after flower. To further prevent the potential for observer interference, video observations were made using GoPro Hero4 Silver (San Mateo, CA) fitted with a 128 GB Lexar High-Performance 633× microSD card. Videos were set at 720-pixel resolution, 30 frames per second, and “narrow” field of view. These settings were optimized for the memory capacity, battery life, and best resolution by the camera. Both observation methods, direct and video, provided similar visitation rates. The visitation time, insect identity, leg color, and sex (for mosquitoes), were recorded from both direct and video observations. The number of feedings (defined by the probing into the flower using the proboscis) and visits (nonfeeding or resting) were quantified per hour per flower for each pollinator type. Over the course of the experiments and observations, temperatures ranged from 9.6 °C to 32.3 °C, with a relative humidity range of 13.4 to 100% (iButtons; Maxim Integrated, San Jose, CA, DS1923). These experiments, therefore, captured both sunny and rainy weather conditions that were common in this area at this time of the year. Pollinator addition experiments. To evaluate the contribution of mosquitoes to the pollination of P. obtusata orchids, we performed pollinator addition experiments during June through July in 2016. Mosquitoes were collected from the Okanogan-Wenatchee National Forest using Centers for Disease Control Wilton traps baited with carbon dioxide (John W. Hock Company, Gainesville, FL). Carbon dioxide traps provide a standardized method to sample the mosquito assemblages near and among wetland habitats ( 41 , 42 ). Traps were placed within the sedge habitat, but more than 60 m from the nearest focal flower patch to prevent any disturbance. P. obtusata from the same site was enclosed in BugDorm cages (30 cm × 30 cm × 30 cm; BioQuip Products, Rancho Dominguez, CA, 1452) for which the bottom panel was removed to cover the orchid. Thirty mosquitoes were introduced into each cage through a sleeve located on the front panel and left without human interference for a duration of 48 h, after which the mosquitoes were collected from the enclosures and identified. The number and species of mosquitoes with pollinium attached were recorded, and the plant was bagged for determination of the fruit-to-flower ratio at the end of the field season. A total of 19 enclosures were used, 11 enclosures with a single plant and 8 enclosures with 2 to 3 plants. Pollen limitation studies. To determine the importance of pollination and out-crossing on P. obtusata fruit set, plants were subjected to 4 different experimental treatments during the June through July summer months. For 2 wk, plants were either unbagged ( n = 20 plants) or bagged to prevent pollinator visitation ( n = 19 plants). Organza bags (model B07735-1; Housweety, Causeway Bay, Hong Kong) were used to prevent pollinators from visiting the flowers. In addition, we determined the importance of cross- and self-pollination for P. obtusata . For cross-pollination, 6 pollinia were removed from 2 plants using a toothpick and gently brushed against the stigma of a neighboring plant ( n = 11 plants). To examine the effects of self-pollination, 6 pollinia were removed from 3 flowers and gently brushed the flowers on the same plant ( n = 9 plants). At the end of the field season, the number of flowers and the number of fruits produced per individual plants were recorded and the fruit-to-flower ratios were calculated. For comparing the fruit weights and the seed set for each treatment, up to 4 fruits from each individual of P. obtusata were collected. The weights were measured with a digital scale (Mettler Toledo, Columbus, OH), and the number of viable seeds per fruit were counted using an epifluorescent microscope (60× magnification; Nikon Ti4000). Fruit weights and seed sets were compared using a Student’s t test; fruit-to-flower ratios were compared using a Mann–Whitney U test. GC-EAD. Electroantennogram signals were filtered and amplified (100×; 0.1 to 500 Hz) using an A-M 1800 amplifier (Sequim, WA) connected to a personal computer via a BNC-2090A analog-to-digital board (National Instruments, Austin, TX) and digitized at 20 Hz using WinEDR software (Strathclyde Electrophysiology Software, Glasgow, UK). A Hum Bug noise eliminator (Quest Scientific, Vancouver, Canada) was used to decrease electrical noise. The antennal responses to peaks eluting from the GC were measured for each mosquito preparation and each peak and mosquito species. Bioactive peaks were those that elicited strong EAD responses, corresponding to deflections beyond the average noise floor of the baseline EAD signal. Responses by each individual preparation were used for principal component analysis (Ade4 package, R). The responses of 8 different mosquito species were tested to the scent extracts of 3 orchid species ( n = 8 mosquito species for P. obtusata and n = 4 mosquito species each for P. stricta and P. huronensis , with 3 to 17 replicates per mosquito species per orchid, for a total of 109 GC-EAD experiments). Two-Photon Excitation Microscopy. Calcium imaging in the Ae. increpitus mosquito AL. Odor-evoked responses in the Ae. increpitus mosquito AL were imaged with 9 female mosquitoes at the beginning of the season when mosquitoes were relatively young (as defined by wing and scale appearance). Calcium imaging experiments were conducted using application of the calcium indicator Fluo4 to the mosquito brain and using a stage that allows simultaneous calcium imaging and tethered flight ( 22 ). The mosquito was cooled on ice and transferred to a Peltier-cooled holder that enables the mosquito head to be fixed to the stage using UV glue. The custom stage permits the superfusion of saline to the head capsule and space for movement by the wings and proboscis ( 22 ) ( Fig. 3 ). Once the mosquito was fixed to the stage, a window in its head was cut to expose the brain, and the brain was continuously superfused with physiological saline ( 21 , 22 ). Next, the perineural sheath was gently removed from the AL using fine forceps, and 75 µL of the Fluo4 solution—made by 50 mg of Fluo4 in 30 µL Pluronic F-127 and then subsequently diluted in 950 µL of mosquito physiological saline—was pipetted to the holder allowing the brain to be completely immersed in the dye. Mosquitoes were kept in the dark at 15 °C for 1.5 h (the appropriate time for adequate penetration of the dye into the tissue), after which the brain was washed 3 times with physiological saline. After the rinse, mosquitoes were kept in the dark at room temperature for ∼10 to 20 min before imaging. Wing stroke amplitudes were acquired and analyzed using a custom camera-based computer vision system at frame rates of 100 Hz ( 22 , 43 ), where the mosquito was illuminated with infrared LEDs (880 nm), and images were collected with an infrared-sensitive camera synched to the 2-photon system. Stimulus-evoked initiation of flight and changes in the amplitude of the wing-stroke envelope were characterized for each odor stimulus (sensu ref. 22 ). Calcium-evoked responses in the AL were imaged using the Prairie Ultima IV 2-photon excitation microscope (Prairie Technologies) and Ti-Sapphire laser (Chameleon Ultra; Coherent). Experiments were performed at a depth of 40 µm from the ventral surface of the AL, allowing the calcium dynamics from ∼18 to 22 glomeruli to be repeatedly imaged across preparations. Images were collected at 2 Hz, and for each odor stimulus images were acquired for 35 s, starting 10 s before the stimulus onset. Imaging data were extracted in Fiji/ImageJ and imported into Matlab (v2017; Mathworks, Natick, MA) for Gaussian filtering (2 × 2 pixel; σ = 1.5 to 3) and alignment using a single frame as the reference at a given imaging depth and subsequently registered to every frame to within 1/4 pixel. Trigger-averaged ΔF/F was used for comparing glomerular responses between odor stimuli. After an experiment, the AL was sequentially scanned at 1-µm depths from the ventral to dorsal surface. Ventral glomeruli to the 40-µm depth were 3-dimensionally (3D) reconstructed using Reconstruct software or Amira v5 (Indeed-Visual Concepts, Houston TX) to provide glomerular assignment and registration between preparations. Glomeruli in the ventral region of the AL, based on their positions, were tentatively assigned names similar to those in Ae. aegypti ( 22 , 44 ). Calcium imaging in the Ae. aegypti mosquito AL. Odor-evoked responses in the Ae. aegypti AL were imaged taking advantage of our genetically encoded PUb-GCaMPs mosquito line ( 20 ). A total of 20 preparations were used: 10 for single odorant and orchid mixture experiments, 6 for ratio experiments, and 4 for experiments using GABA-receptor antagonists. Glomeruli were imaged at 40 µm from the ventral surface, as glomeruli at this depth show strong responses to odorants in the orchid headspace, including nonanal, octanal, and lilac aldehyde, and at this depth, ∼14 to 18 glomeruli can be neuroanatomically identified and registered between preparations. The expression of GCaMP occurred in glia, local interneurons, and projection neurons. Nevertheless, double-labeling for GFP (GCaMPs) and glutamine synthase (GS; glial marker) revealed broad GFP labeling that did not always overlap with the glial stain, with GS staining often occurring on astroglial-like processes on the rind around glomeruli, and strong GFP occurring within the glomeruli ( SI Appendix , Fig. S10 ). Thus, in our calcium imaging experiments we took care to image from the central regions of the glomeruli and avoid the sheaths and external glomerular loci. Moreover, strong GFP staining occurred in soma membranes located in the medial and lateral cell clusters, which contain the projection neurons and GABAergic local interneurons, respectively; the vast majority of these cell bodies did not stain for GS ( SI Appendix , Fig. S10 ). Relatedly, GCaMP6s expression is very high in AL local interneurons and projection neurons (PNs), such that during odor stimulation the PNs and axonal processes can often be imaged, and 3D reconstructions can take place through simultaneous optical sections with odor stimulation. Nonetheless, we assume the glomerular responses are a function of multiple cell types. In other insects, GABAergic modulation has been shown to operate on olfactory receptor neurons, local interneurons, and PNs ( 27 – 29 ). Similar to experiments with Ae. increpitus , the majority the mosquitoes were UV glued to the stage to allow free movement of their wings and proboscis; however, for experiments using GABA-receptor antagonists the proboscis was glued to the stage for additional stability. Once the mosquito was fixed to the stage, a window in its head was cut to expose the brain, and the brain was continuously superfused with physiological saline ( 21 ). Data and Resource Availability. Data on the behavioral, chemical, ecological, and calcium imaging experiments can be found on Mendeley Data. Software is available at https://github.com/riffelllab . Mosquito lines are available upon request.
📊 Figures
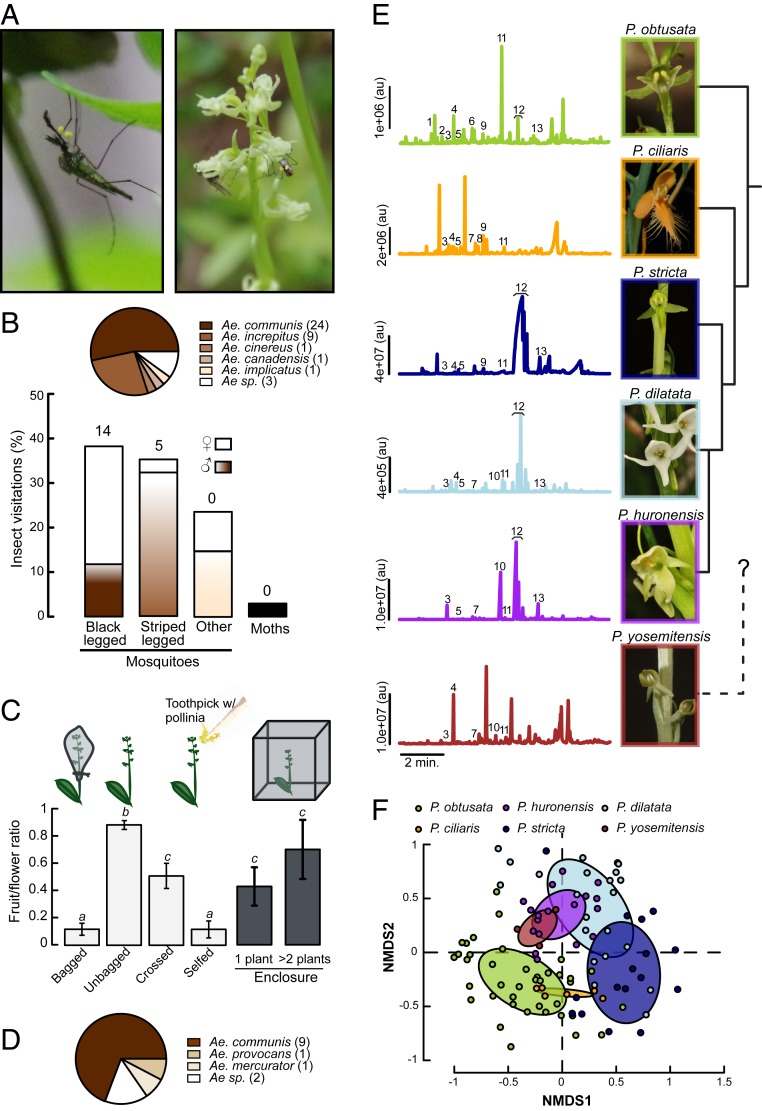
Fig. 1.
Association between the P. obtusata orchid and mosquito pollinators. ( A ) Picture ( Left image) of a black legged male mosquito bearing 2 pollinia on its head, and ( Right image) a male mosquito feed...
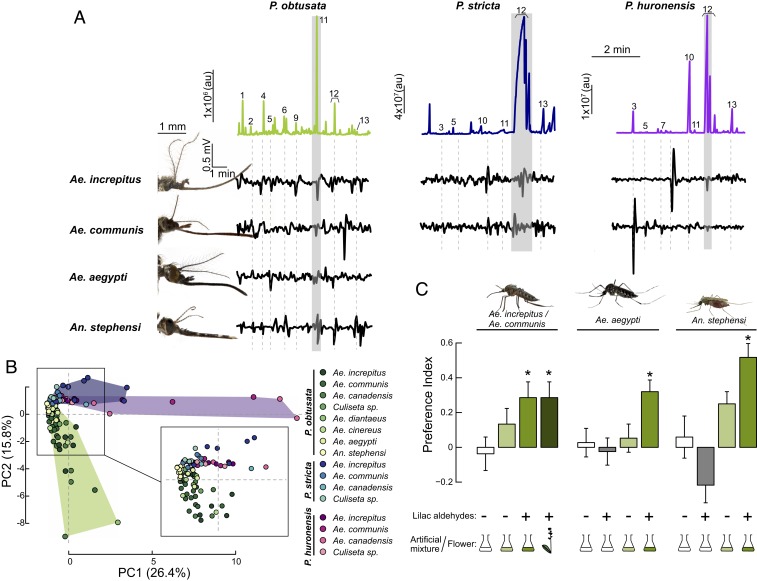
Fig. 2.
Identification of behaviorally effective orchid volatiles in mosquitoes. ( A ) Gas chromatogram traces for the P. obtusata ( Left ), P. stricta (Middle ), and P. huronensis ( Right ) headspaces, with ...
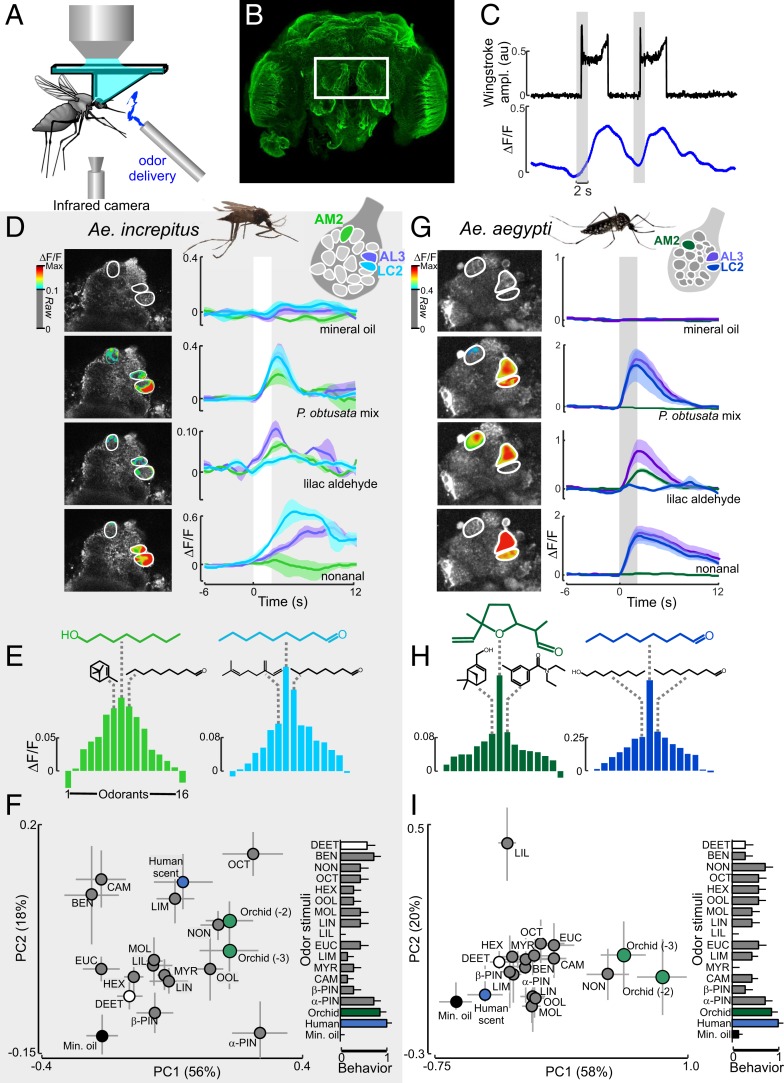
Fig. 3.
Mosquito antennal lobe responses to the P. obtusata scent. ( A ) Schematic of the 2-photon setup used to record calcium dynamics in the mosquito AL. ( B ) Ae. aegypti brain (u03b1-tubulin stain). The ...
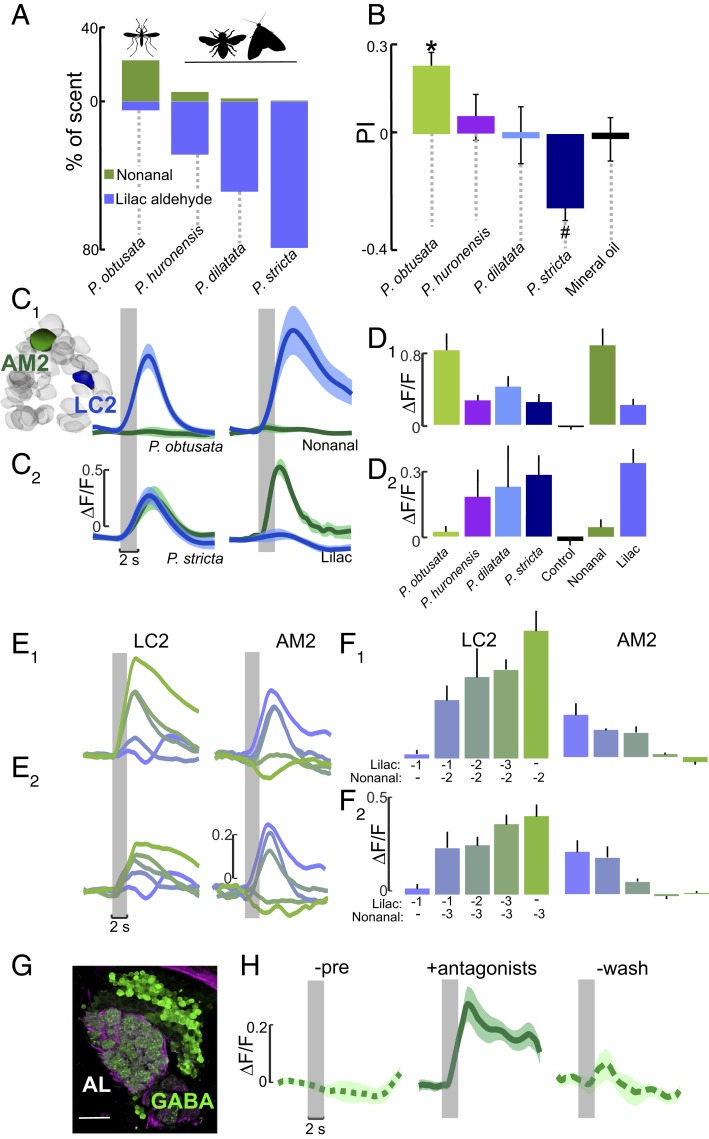
Fig. 4.
Glomeruli encoding the orchid scents are sensitive to odorant ratios. ( A ) Percentage of nonanal and lilac aldehyde concentrations in the different Platanthera orchid scents, which have 6- to 40-fold...
Figure images are served from the NIH/NLM PubMed Central Open Access Subset or Europe PMC; copyright remains with the publishers and authors.
💬 Discussion
0 commentsNo comments yet. Be the first to start a discussion!
Leave a Comment