Abstract
Fenestrations are transcellular pores in endothelial cells that facilitate transfer of substrates between blood and the extravascular compartment. In order to understand the regulation and formation of fenestrations, the relationship between membrane rafts and fenestrations was investigated in liver sinusoidal endothelial cells where fenestrations are grouped into sieve plates. Three dimensional structured illumination microscopy, scanning electron microscopy, internal reflectance fluorescence microscopy and two-photon fluorescence microscopy were used to study liver sinusoidal endothelial cells isolated from mice. There was an inverse distribution between sieve plates and membrane rafts visualized by structured illumination microscopy and the fluorescent raft stain, Bodipy FL C5 ganglioside GM1. 7-ketocholesterol and/or cytochalasin D increased both fenestrations and lipid-disordered membrane, while Triton X-100 decreased both fenestrations and lipid-disordered membrane. The effects of cytochalasin D on fenestrations were abrogated by co-administration of Triton X-100, suggesting that actin disruption increases fenestrations by its effects on membrane rafts. Vascular endothelial growth factor (VEGF) depleted lipid-ordered membrane and increased fenestrations. The results are consistent with a sieve-raft interaction, where fenestrations form in non-raft lipid-disordered regions of endothelial cells once the membrane-stabilizing effects of actin cytoskeleton and membrane rafts are diminished.
🔬 Techniques
🔭 Microscopes
✨ Fluorophores
🧪 Sample Preparation
🔬 Cell Lines
🏭 Microscope Brands
🧪 Reagent Suppliers
📷 Detectors
🔎 Objectives
💻 Software Details
🏛️ Research Organizations (ROR)
Affiliated research institutions:
📋 Methods
Animals 3–4 and 12 month old C57/Bl6 mice were obtained from the Animal Resource Centre in Perth Western Australia. Animals were housed at the ANZAC Research Institute on a 12 hour light/dark cycle and provided with ad libitum access to food and water. The study was approved by the Animal Welfare Committee of the Sydney South Western Area Health Service. Materials Reagents included: Liberase TM Research Grade (Roche, Basel, Switzerland); RPMI (Gibco Grand Island, NY), Percoll, Cytochalasin D, Triton X-100, methyl-β-cyclodextrin, 7-ketocholesterol, mouse recombinant vascular endothelial growth factor VEGF (Sigma Aldrich, St Louis, MO). Stains included 6-lauroyl-2-dimethylaminonaphthalene LAURDAN, Cell-Mask Orange, Bodipy FL C5 ganglioside GM1 and NBD-cholesterol (Invitrogen, Eugene, OR). LSEC Isolation Mouse LSEC isolation was performed as described previously [33] by perfusion of the liver with Liberase TM (0.15 Wünsch units/ml). Non-parenchymal cells were removed by a two-step Percoll gradient and Kupffer cells were removed by selective adherence to plastic. LSECs (seeded at 0.5×10 6 cells/cm 2 ) were cultured (37°C, 5% CO 2 ) in serum free RPMI-1640 for 3 hours before use.
LSEC Treatments
Cells were treated with a variety of agents and probes to elucidate the relationship between rafts, actin and fenestrations. Membrane rafts were disrupted using 7KC [16] while non-raft regions were removed using Triton X-100 [17] . Actin was disrupted using cytochalasin D [20] . All experiments were performed in triplicate. 7KC stock solution was prepared by drop-wise adding 15 mg/ml 7KC solution in ethanol to 50 mg/ml methyl-β-cyclodextrin in PBS at 80°C to a final sterol concentration of 1.5 mg/ml. 5, 10 or 20 µl of this solution were then added to 1 ml of cell medium to obtain 9, 18, 36 or 73 µM 7KC concentrations respectively. LSECs were treated for 7 min. For Triton X-100 experiments, LSECs were incubated with 0.001% Triton X-100 in RPMI for 1 minute. For cytochalasin D experiments, LSECs were incubated with 0.5 µg/ml cytochalasin D in RPMI for 30 minutes. Experiments were also performed with both cytochalasin D with Triton X-100, and cytochalasin D with 7KC. In addition, experiments were performed where LSECs were incubated with VEGF (100 ng/ml) for 4 hours. Liver Perfusion with 7KC Liver perfusions were performed in 12 month old mice as previously described [34] . The perfusate was Krebs-Henseleit bicarbonate buffer (10 mmol/L glucose, p H 7.4, saturated with 95% O 2 /5% CO 2 , 1% bovine serum albumin, 37°C). The perfusate flow rate was maintained at approximately 2 mL/min/g of liver using a cartridge pump (Masterflex L/S, model 794-32; Cole-Palmer, Extech Equipment, Boronia, Australia) in a non-recirculating system. Viability was confirmed by macroscopic appearance, portal venous pressure, light microscopy and electron microscopy. Control animals (n = 3) were perfused with Krebs Henseleit buffer for 10 min and 7KC treatment animals (n = 3) were perfused for 2 min with Krebs Henseleit buffer alone followed by 8 min with 9 µM 7KC solution in Krebs Henseleit buffer. After completion of treatment experiments, liver specimens were fixed for electron microscopy by gravity-fed perfusion with 2% glutaraldehyde/3% paraformaldehyde in 0.1 mol/L sodium cacodylate buffer (0.1 mol/L sucrose, 2 mmol/L CaCl 2 ). Randomly selected specimens were analysed by SEM as described below. Fixation, Staining and Imaging of LSECs SEM was performed as described [35] , [36] . Isolated LSECs were fixed in 2.5% glutaraldehyde in 0.1 mol/L sodium cacodylate buffer, osmicated, dehydrated in ethanol and hexamethyl-disilazane, mounted on stubs, sputter coated with platinum, and examined using a JEOL 6380 Scanning Electron Microscope. Figures at 10,000× magnification were used to measure fenestration diameter and LSEC porosity using Image J ( http://rsb.info.nih.gov/ij/ , between 464–2483 fenestrations assessed in each treatment group). Porosity is defined as the percentage of cell membrane covered by fenestrations. 3D-SIM was performed as described previously [11] . LSECs were stained with Cell-Mask Orange (Life Technologies, Carlsbad, CA) which is a cell membrane marker, and Bodipy FL C5 ganglioside GM1 which is a marker of membrane rafts then fixed with 4% fresh paraformaldehyde in PBS. The cells were imaged with a structured illumination microscope based on the Deltavision/OMX V2.0 (Applied Precision Inc, Issaquah, WA). Image reconstructions were made with the OMX specific SoftWoRx v4.5.0 software package (Applied Precision Inc, Issaquah, WA). Three dimensional figures were generated by iso-surface rendering (iso-rendering) which builds up a 3D model from multiple two dimensional images (Volocity 3D Image Analysis Software, PerkinElmer, MA). TIRFM was performed as described previously [18] using Bodipy FL C5 ganglioside GM1 or NBD-cholesterol. A custom built microscope was used with excitation at 473 nm from a diode-pumped solid-state laser delivered via a single mode optical fibre and a rotatable mirror. Excitation was delivered into the backport of an inverted epifluorescence IX71 Olympus microscope equipped with a 60×1.45 NA oil-immersion TIRF objective. Fluorescence was collected on an electron-multiplying CCD camera in the range 500–593 nm and 600–680 nm using a two-channel imager. Two-photon fluorescence microscopy was performed as described [18] . LAURDAN undergoes a spectral blue-shift from 490 nm when in lipid-disordered non-raft regions to 440 nm when in lipid-ordered raft domains, thus can identify both raft and non-raft regions simultaneously [18] . Two-channel time-resolved live cell imaging was performed using a confocal laser-scanning microscope (TCS SP5, Leica Microsystems GmbH, Wetzlar, Germany) with a 1.2NA 63× water-immersion objective and multiphoton excitation from a mode-locked, femtosecond-pulsed Ti:Sapphire laser (Mai-Tai, Spectra Physics, Mountain View, CA). LAURDAN was excited at 800 nm and fluorescence was split using a dichroic mirror (458 nm) passed through a bandpass filter centered on 425 and 483 nm. Fluorescence was quantified using ImageJ and converted to generalized polarization (GP) values (n = 30–143 cells for each group) [18] .
Show full methods section
Animals 3–4 and 12 month old C57/Bl6 mice were obtained from the Animal Resource Centre in Perth Western Australia. Animals were housed at the ANZAC Research Institute on a 12 hour light/dark cycle and provided with ad libitum access to food and water. The study was approved by the Animal Welfare Committee of the Sydney South Western Area Health Service. Materials Reagents included: Liberase TM Research Grade (Roche, Basel, Switzerland); RPMI (Gibco Grand Island, NY), Percoll, Cytochalasin D, Triton X-100, methyl-β-cyclodextrin, 7-ketocholesterol, mouse recombinant vascular endothelial growth factor VEGF (Sigma Aldrich, St Louis, MO). Stains included 6-lauroyl-2-dimethylaminonaphthalene LAURDAN, Cell-Mask Orange, Bodipy FL C5 ganglioside GM1 and NBD-cholesterol (Invitrogen, Eugene, OR). LSEC Isolation Mouse LSEC isolation was performed as described previously [33] by perfusion of the liver with Liberase TM (0.15 Wünsch units/ml). Non-parenchymal cells were removed by a two-step Percoll gradient and Kupffer cells were removed by selective adherence to plastic. LSECs (seeded at 0.5×10 6 cells/cm 2 ) were cultured (37°C, 5% CO 2 ) in serum free RPMI-1640 for 3 hours before use.
LSEC Treatments
Cells were treated with a variety of agents and probes to elucidate the relationship between rafts, actin and fenestrations. Membrane rafts were disrupted using 7KC [16] while non-raft regions were removed using Triton X-100 [17] . Actin was disrupted using cytochalasin D [20] . All experiments were performed in triplicate. 7KC stock solution was prepared by drop-wise adding 15 mg/ml 7KC solution in ethanol to 50 mg/ml methyl-β-cyclodextrin in PBS at 80°C to a final sterol concentration of 1.5 mg/ml. 5, 10 or 20 µl of this solution were then added to 1 ml of cell medium to obtain 9, 18, 36 or 73 µM 7KC concentrations respectively. LSECs were treated for 7 min. For Triton X-100 experiments, LSECs were incubated with 0.001% Triton X-100 in RPMI for 1 minute. For cytochalasin D experiments, LSECs were incubated with 0.5 µg/ml cytochalasin D in RPMI for 30 minutes. Experiments were also performed with both cytochalasin D with Triton X-100, and cytochalasin D with 7KC. In addition, experiments were performed where LSECs were incubated with VEGF (100 ng/ml) for 4 hours. Liver Perfusion with 7KC Liver perfusions were performed in 12 month old mice as previously described [34] . The perfusate was Krebs-Henseleit bicarbonate buffer (10 mmol/L glucose, p H 7.4, saturated with 95% O 2 /5% CO 2 , 1% bovine serum albumin, 37°C). The perfusate flow rate was maintained at approximately 2 mL/min/g of liver using a cartridge pump (Masterflex L/S, model 794-32; Cole-Palmer, Extech Equipment, Boronia, Australia) in a non-recirculating system. Viability was confirmed by macroscopic appearance, portal venous pressure, light microscopy and electron microscopy. Control animals (n = 3) were perfused with Krebs Henseleit buffer for 10 min and 7KC treatment animals (n = 3) were perfused for 2 min with Krebs Henseleit buffer alone followed by 8 min with 9 µM 7KC solution in Krebs Henseleit buffer. After completion of treatment experiments, liver specimens were fixed for electron microscopy by gravity-fed perfusion with 2% glutaraldehyde/3% paraformaldehyde in 0.1 mol/L sodium cacodylate buffer (0.1 mol/L sucrose, 2 mmol/L CaCl 2 ). Randomly selected specimens were analysed by SEM as described below. Fixation, Staining and Imaging of LSECs SEM was performed as described [35] , [36] . Isolated LSECs were fixed in 2.5% glutaraldehyde in 0.1 mol/L sodium cacodylate buffer, osmicated, dehydrated in ethanol and hexamethyl-disilazane, mounted on stubs, sputter coated with platinum, and examined using a JEOL 6380 Scanning Electron Microscope. Figures at 10,000× magnification were used to measure fenestration diameter and LSEC porosity using Image J ( http://rsb.info.nih.gov/ij/ , between 464–2483 fenestrations assessed in each treatment group). Porosity is defined as the percentage of cell membrane covered by fenestrations. 3D-SIM was performed as described previously [11] . LSECs were stained with Cell-Mask Orange (Life Technologies, Carlsbad, CA) which is a cell membrane marker, and Bodipy FL C5 ganglioside GM1 which is a marker of membrane rafts then fixed with 4% fresh paraformaldehyde in PBS. The cells were imaged with a structured illumination microscope based on the Deltavision/OMX V2.0 (Applied Precision Inc, Issaquah, WA). Image reconstructions were made with the OMX specific SoftWoRx v4.5.0 software package (Applied Precision Inc, Issaquah, WA). Three dimensional figures were generated by iso-surface rendering (iso-rendering) which builds up a 3D model from multiple two dimensional images (Volocity 3D Image Analysis Software, PerkinElmer, MA). TIRFM was performed as described previously [18] using Bodipy FL C5 ganglioside GM1 or NBD-cholesterol. A custom built microscope was used with excitation at 473 nm from a diode-pumped solid-state laser delivered via a single mode optical fibre and a rotatable mirror. Excitation was delivered into the backport of an inverted epifluorescence IX71 Olympus microscope equipped with a 60×1.45 NA oil-immersion TIRF objective. Fluorescence was collected on an electron-multiplying CCD camera in the range 500–593 nm and 600–680 nm using a two-channel imager. Two-photon fluorescence microscopy was performed as described [18] . LAURDAN undergoes a spectral blue-shift from 490 nm when in lipid-disordered non-raft regions to 440 nm when in lipid-ordered raft domains, thus can identify both raft and non-raft regions simultaneously [18] . Two-channel time-resolved live cell imaging was performed using a confocal laser-scanning microscope (TCS SP5, Leica Microsystems GmbH, Wetzlar, Germany) with a 1.2NA 63× water-immersion objective and multiphoton excitation from a mode-locked, femtosecond-pulsed Ti:Sapphire laser (Mai-Tai, Spectra Physics, Mountain View, CA). LAURDAN was excited at 800 nm and fluorescence was split using a dichroic mirror (458 nm) passed through a bandpass filter centered on 425 and 483 nm. Fluorescence was quantified using ImageJ and converted to generalized polarization (GP) values (n = 30–143 cells for each group) [18] .
Statistics
Results are presented as mean ± SEM or median. Multiple groups were compared with either ANOVA with a post-hoc Student-Newman-Keuls test, or Kruskal-Wallis test with a post hoc Dunn’s method (Sigmastat v11, Systat Software Inc).
Materials Reagents included: Liberase TM Research Grade (Roche, Basel, Switzerland); RPMI (Gibco Grand Island, NY), Percoll, Cytochalasin D, Triton X-100, methyl-β-cyclodextrin, 7-ketocholesterol, mouse recombinant vascular endothelial growth factor VEGF (Sigma Aldrich, St Louis, MO). Stains included 6-lauroyl-2-dimethylaminonaphthalene LAURDAN, Cell-Mask Orange, Bodipy FL C5 ganglioside GM1 and NBD-cholesterol (Invitrogen, Eugene, OR).
Supporting Information Figure S1 Concentration-dependent effects of Triton X-100 on isolated LSECs. Scanning electron micrographs of LSECs after treatment with 0.1, 0.01 and 0.001% Triton X-100 at 25C. The effects of Triton X-100 were diminished when performed at 4C, while cell damage occurred with higher concentrations of Triton X-100. (scale bar 1 µm) (TIFF) Click here for additional data file. Figure S2 Concentration-dependent effects of 7KC on isolated LSECs. Scanning electron micrographs of LSECs after treatment with 18, 36 and 73 µM 7KC. Cell damage occurred at higher concentrations of 7KC. (scale bar 1 µm) (TIFF) Click here for additional data file. Figure S3 The effects of 7KC (9 µM) and Triton X-100 (0.0001%) on NBD-cholesterol staining in isolated LSECs. There was an increase in staining with Triton X-100 and a reduction with 7KC. (TIFF) Click here for additional data file. Video S1 3D-SIM of LSECs stained with Bodipy FL C5 ganglioside GM1, a marker for rafts (green) and Cell-Mask Orange, a cell membrane marker (orange). There is an inverse distribution between liver sieve plates and membrane rafts. (MOV) Click here for additional data file. Video S2 3D-SIM of LSECs stained with Bodipy FL C5 ganglioside GM1, a marker for rafts (green) and Cell-Mask Orange, a cell membrane marker (orange). There is an inverse distribution between liver sieve plates and membrane rafts. (MOV) Click here for additional data file. Video S3 3D-SIM of LSECs stained with Bodipy FL C5 ganglioside GM1, a marker for rafts (green) and Cell-Mask Orange, a cell membrane marker (orange). There is an inverse distribution between liver sieve plates and membrane rafts. (MOV) Click here for additional data file.
📊 Figures
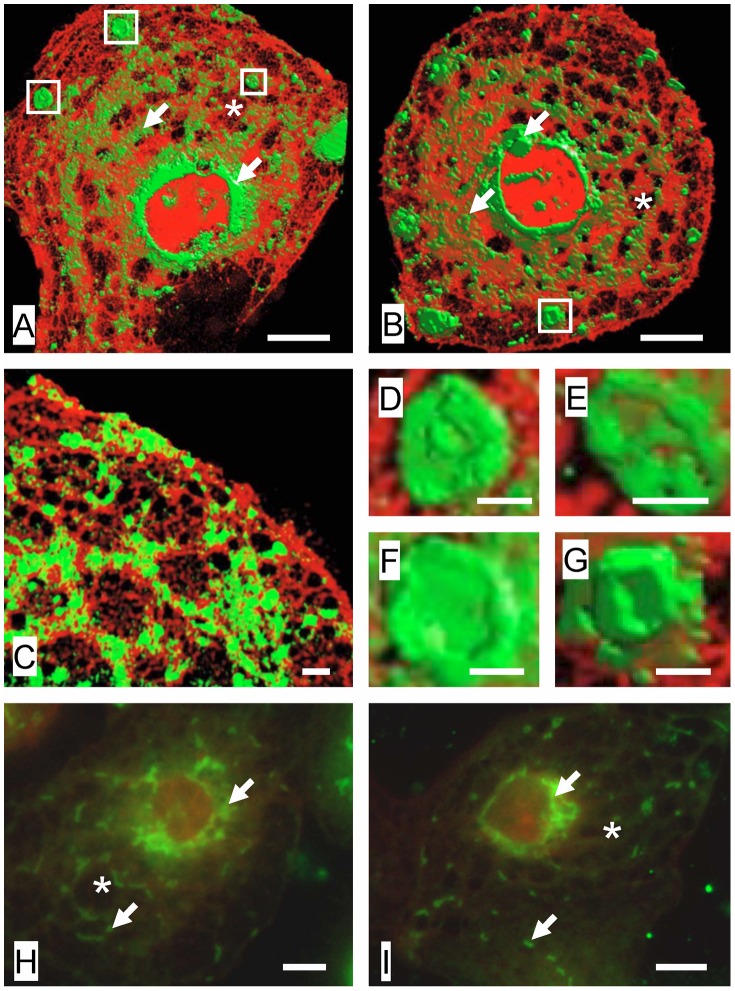
Figure 1
Visualization of membrane rafts and fenestrations.
(Au2013C) 3D-SIM of LSECs stained with Bodipy FL C5 ganglioside GM1, a marker for rafts (green) and Cell-Mask Orange, a cell membrane marker (orange). There is an inverse distribution between liver si...
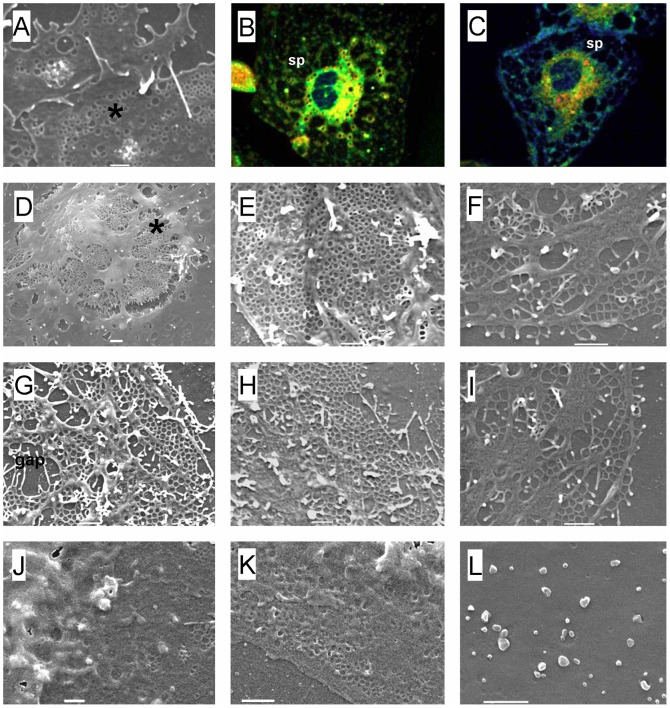
Figure 2
Effects of manipulating membrane rafts on fenestrations.
(A) SEM of normal LSEC. Fenestrations (*) are clustered in sieve plates. (B) Two-photon fluorescence microscopy of normal LSEC stained with LAURDAN, a stain which changes from red/yellow in raft regio...
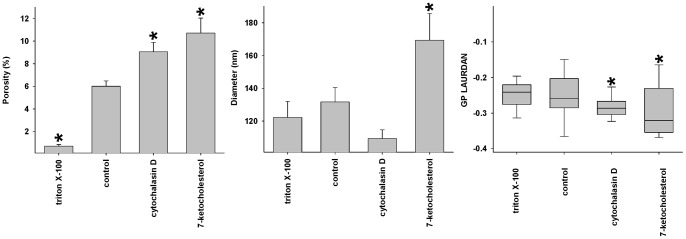
Figure 3
Effects of manipulating rafts on porosity.
The effects of 7KC, Triton X-100 and cytochalasin D on the porosity and diameter of fenestrations (determined using SEM) and generalized polarization (GP, following staining with LAURDAN imaged using ...
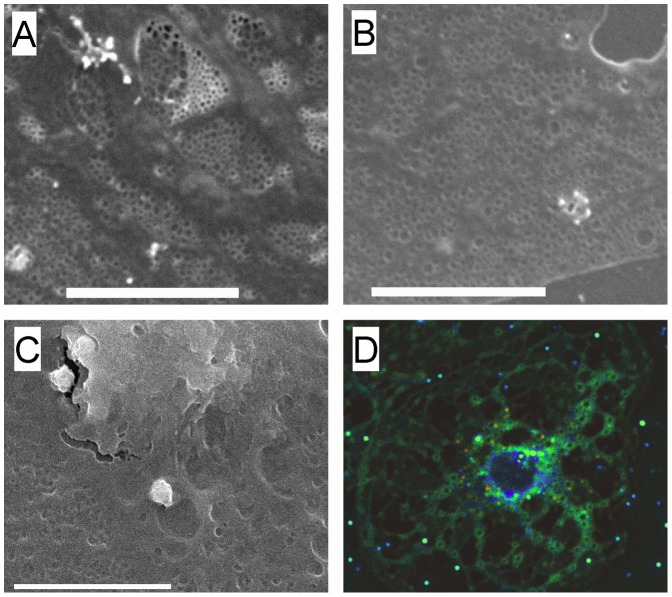
Figure 4
Effects of manipulating actin on fenestrations.
(A) SEM of control LSEC showing fenestrations clustered in sieve plates. (B) SEM of LSEC following treatment with cytochalasin D showing an increase in fenestrations. (C) SEM of LSEC following treatme...
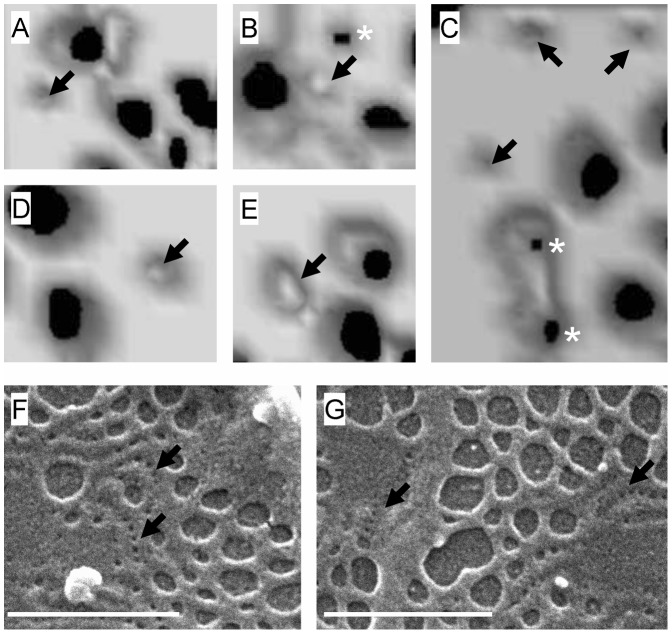
Figure 5
Pores and fenestrations.
(Au2013E) Isorendered 3D-SIM reconstructions of fenestrations from LSECs. Around the sieve plates are a few pores (u2192) and some early fenestrations can be identified forming at the base of the pore...
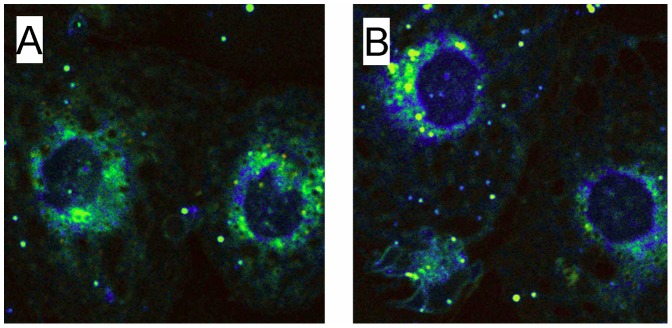
Figure 6
Effects of VEGF on membrane rafts.
(A) Two-photon fluorescence microscopy of LSECs stained with LAURDAN. (B) Two-photon fluorescence microscopy of LSECs stained with LAURDAN following treatment with VEGF, showing increased blue stainin...
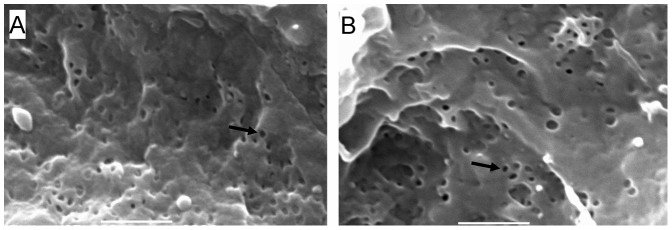
Figure 7
Effects of 7KC on the perfused mouse liver.
(A) Scanning electron micrograph of a mouse perfused liver sinusoid. (B) Scanning electron micrograph of a mouse liver sinusoid following perfusion with 7KC (scale bar 1 u00b5M, u2192 fenestration).
Figure images are served from the NIH/NLM PubMed Central Open Access Subset or Europe PMC; copyright remains with the publishers and authors.
💬 Discussion
0 commentsNo comments yet. Be the first to start a discussion!
Leave a Comment