Abstract
Diffusion tensor imaging (DTI) is used extensively in neuroscience to noninvasively estimate white matter (WM) microarchitecture. However, the diffusion signal is inherently ambiguous because it infers WM structure from the orientation of water diffusion and cannot identify the biological sources of diffusion changes. To compare inferred WM estimates to directly labeled axonal elements, we performed a novel within-subjects combination of high-resolution ex vivo DTI with two-photon laser microscopy of intact mouse brains rendered optically transparent by Clear Lipid-exchanged, Anatomically Rigid, Imaging/immunostaining compatible, Tissue hYdrogel (CLARITY). We found that myelin basic protein (MBP) immunofluorescence significantly correlated with fractional anisotropy (FA), especially in WM regions with coherent fiber orientations and low fiber dispersion. Our results provide evidence that FA is particularly sensitive to myelination in WM regions with these characteristics. Furthermore, we found that radial diffusivity (RD) was only sensitive to myelination in a subset of WM tracts, suggesting that the association of RD with myelin should be used cautiously. This combined DTI-CLARITY approach illustrates, for the first time, a framework for using brain-wide immunolabeling of WM targets to elucidate the relationship between the diffusion signal and its biological underpinnings. This study also demonstrates the feasibility of a within-subject combination of noninvasive neuroimaging and tissue clearing techniques that has broader implications for neuroscience research.
🔬 Techniques
🔭 Microscopes
💻 Software
✨ Fluorophores
🧪 Sample Preparation
🏭 Microscope Brands
🧪 Reagent Suppliers
🔴 Lasers
💻 Software Details
🏛️ Research Organizations (ROR)
Affiliated research institutions:
📋 Methods
2.1.
Subjects
For initial pilot experiments to test the compatibility of performing the CLARITY protocol following ex vivo DTI in the same brains, we used three male thy1-eYFP -H mice (Jackson Laboratories, Bar Harbor ME), 3–6 months old (Chang et al., in press). For the main experiments, we used four male C57BL/6 J mice (Jackson Laboratories), 3–6 months old. Mice were housed under 12 h light/dark cycle with ad libitum access to food and water. All animal procedures were approved by the Feinstein Institute Medical Research Institutional Animal Care and Use Committee and maintained according to National Institutes of Health guidelines. 2.2. ex vivo DTI Mice were transcardially perfused with a customized CLARITY liquid hydrogel (see Sec 2.3 for details) that also included 0.1 mM gadopentetate dimeglumine (Gd-DTPA; Magnevist). Brains were then removed and incubated in 4% PFA-liquid hydrogel for 3 days at 4 °C on a laboratory rocker. Prior to DTI scanning, the brains were immersed in a PBS-Magnevist solution for 48 h. Magnevist was used as a T1-shortening contrast agent for MRI to achieve shorter repetition times (TR), thereby allowing faster DTI acquisitions while maintaining a good signal-to-noise ratio ( Aggarwal et al., 2010 ; Jiang and Johnson, 2011 ). For MRI, the brains were placed in 15 mm NMR glass tubes, which were filled with Fomblin ® oil (Solvay Solexis, Thorofare, NJ), an MR-invisible liquid for susceptibility matching and limiting tissue dehydration. Diffusion-weighted images were acquired on an 11.7 T NMR spectrometer (Bruker BioSpin, Billerica, MA) using a three-dimensional gradient-and-spin-echo (3D DW-GRASE) sequence with twin navigator-echo phase correction ( Aggarwal et al., 2010 ), along 15 independent directions and a b -value of 1500 s/mm 2 . Total scanning time for each specimen was approximately 16.5 h. The temperature of the specimens was maintained at 28 °C during imaging in order to avoid polymerization of the CLARITY hydrogel. DTI parameters were as follows: effective echo time (TE) of 31 ms, pulse repetition time (TR) of 800 ms, 4 signal averages with phase cycling, diffusion gradient duration/separation of 3/12 ms, and receiver bandwidth of 100 kHz. Typical imaging field of view and matrix size were 12.8×8.0×16.3 mm and 128×80×162, respectively. The native resolution was 100 μm isotropic. Images were reconstructed using IDL6.4 (ITT Visual Information Solutions, Boulder, CO) with zero-padding of the k-space data by a factor of 2. From the diffusion-weighted images, maps of FA, AD, RD, MD, C l , and C p were calculated using FSL ( http://www.fmrib.ox.ac.uk/fsl ) software as follows: AD=λ1, RD=(λ2+λ3)/2, MD=(λ1+λ2+λ3)/3, C l =(λ1 - λ2)/ λ1, C p = (λ2 - λ3)/λ1, and FA = 3 2 ( λ 1 − MD ) 2 + ( λ 2 − MD ) 2 + ( λ 3 − MD ) 2 λ 1 2 + λ 2 2 + λ 3 2 . TrackVis ( http://www.trackvis.org ) was used for post hoc calculations and visualization. DTI regions of interest (ROIs) were created in TrackVis with manually drawn ROIs using the Free Hand tool by E.H.C. 2.3.
Show full methods section
2.1.
Subjects
For initial pilot experiments to test the compatibility of performing the CLARITY protocol following ex vivo DTI in the same brains, we used three male thy1-eYFP -H mice (Jackson Laboratories, Bar Harbor ME), 3–6 months old (Chang et al., in press). For the main experiments, we used four male C57BL/6 J mice (Jackson Laboratories), 3–6 months old. Mice were housed under 12 h light/dark cycle with ad libitum access to food and water. All animal procedures were approved by the Feinstein Institute Medical Research Institutional Animal Care and Use Committee and maintained according to National Institutes of Health guidelines. 2.2. ex vivo DTI Mice were transcardially perfused with a customized CLARITY liquid hydrogel (see Sec 2.3 for details) that also included 0.1 mM gadopentetate dimeglumine (Gd-DTPA; Magnevist). Brains were then removed and incubated in 4% PFA-liquid hydrogel for 3 days at 4 °C on a laboratory rocker. Prior to DTI scanning, the brains were immersed in a PBS-Magnevist solution for 48 h. Magnevist was used as a T1-shortening contrast agent for MRI to achieve shorter repetition times (TR), thereby allowing faster DTI acquisitions while maintaining a good signal-to-noise ratio ( Aggarwal et al., 2010 ; Jiang and Johnson, 2011 ). For MRI, the brains were placed in 15 mm NMR glass tubes, which were filled with Fomblin ® oil (Solvay Solexis, Thorofare, NJ), an MR-invisible liquid for susceptibility matching and limiting tissue dehydration. Diffusion-weighted images were acquired on an 11.7 T NMR spectrometer (Bruker BioSpin, Billerica, MA) using a three-dimensional gradient-and-spin-echo (3D DW-GRASE) sequence with twin navigator-echo phase correction ( Aggarwal et al., 2010 ), along 15 independent directions and a b -value of 1500 s/mm 2 . Total scanning time for each specimen was approximately 16.5 h. The temperature of the specimens was maintained at 28 °C during imaging in order to avoid polymerization of the CLARITY hydrogel. DTI parameters were as follows: effective echo time (TE) of 31 ms, pulse repetition time (TR) of 800 ms, 4 signal averages with phase cycling, diffusion gradient duration/separation of 3/12 ms, and receiver bandwidth of 100 kHz. Typical imaging field of view and matrix size were 12.8×8.0×16.3 mm and 128×80×162, respectively. The native resolution was 100 μm isotropic. Images were reconstructed using IDL6.4 (ITT Visual Information Solutions, Boulder, CO) with zero-padding of the k-space data by a factor of 2. From the diffusion-weighted images, maps of FA, AD, RD, MD, C l , and C p were calculated using FSL ( http://www.fmrib.ox.ac.uk/fsl ) software as follows: AD=λ1, RD=(λ2+λ3)/2, MD=(λ1+λ2+λ3)/3, C l =(λ1 - λ2)/ λ1, C p = (λ2 - λ3)/λ1, and FA = 3 2 ( λ 1 − MD ) 2 + ( λ 2 − MD ) 2 + ( λ 3 − MD ) 2 λ 1 2 + λ 2 2 + λ 3 2 . TrackVis ( http://www.trackvis.org ) was used for post hoc calculations and visualization. DTI regions of interest (ROIs) were created in TrackVis with manually drawn ROIs using the Free Hand tool by E.H.C. 2.3.
CLARITY whole-brain clearing and imaging
We performed the CLARITY procedure as previously described ( Chung et al., 2013 ; Tomer et al., 2014 ; Yang et al., 2014 ) with custom modifications in order to maximize antibody penetration and minimize tissue expansion . We used a hydrogel containing 4% paraformaldehyde (PFA), 1.75% acrylamide, 0.01875% bis-acrylamide, and 0.25% VA-044 initiator. Prior to DTI, we perfused brains with this custom hydrogel solution, then performed the ex vivo DTI scanning. Following DTI, brains were then polymerized at 37 °C for 3 h to form the brain-hydrogel hybrid. There was only one perfusion and one CLARITY hydrogel used in this study ( Fig. 1A ). Tissue clearing was achieved with passive CLARITY (PACT; Tomer et al., 2014 ; Yang et al., 2014 ) until brains were optically transparent (30–40 days). While this passive technique is markedly slower, we found that it achieved excellent tissue transparency and structural preservation without tissue inflation. Transmittance through cleared whole brains was measured at three laser wavelengths (Chang et al., in press) using a fluorescence spectrometer (Public Lab, Cambridge, MA). Once transparent, the brains were washed in 1× PBS+0.1% Triton X for 2 days, changing the solution every 24 h. Brains were then incubated in primary antibody solution, anti-myelin basic protein (1:50, EMD Millipore), 0.5 M sodium borate solution, (pH 8.5) and 0.1% Triton-X (wt/vol) for 14 days at 37 °C on an orbital shaker. Brains were then washed for 7 days in 0.5 M sodium borate with 0.1% Triton-X on a shaker at 37 °C, followed by secondary antibody labeling with Alexa Fluor 633 (1:50, Life technologies) in 0.5 M sodium borate + 0.1% Triton-X for another 14 days at 37 °C on an orbital shaker. The brains were placed in a final wash for 7 days following secondary labeling. Prior to two-photon laser scanning microscopy (2P-LSM) imaging, brains were immersed in refractive index matching solution (RIMS; Yang et al., 2014 ) for 3 days at RT and sealed with Molykote 111 compound (Dow Corning) in a custom imaging chamber (iSpacer, Jun Lab) protected from light. For 2P-LSM, we used an Olympus FV1000-MPE with Mai Tai DeepSee Ti:Sapphire laser (SpectraPhysics) and an Olympus XLFLUOR 340 objective with a magnification of 4× and 0.28 NA. A subset of high-resolution images was acquired using an Olympus XLPLN10XSVMP objective (10×, 0.6 NA). Whole brain images were acquired using FluoView Mosiac stage control and tiling software to construct stitched z-stacks at a resolution of 3.98×3.98×50 μm. The dorsal half of the brain was imaged first in the iSpacer chamber, then inverted to image the ventral half. Image z-stacks were translated and stitched using ImageJ and Imaris 8.0 (Bitplane; Zurich, Switzerland) to produce whole brain volumes. A subset of image z-stacks were imaged at a higher resolution of 1.99×1.99×25 μm in order to better resolve fiber fascicles. This higher resolution data is shown in Fig. 5. Multitiled (15% overlap) whole brain images were visualized and analyzed in 3D using Imaris 8.0. WM ROIs were traced (by E.H.C.) using Imaris in Surpass mode and automatic Surface creation with absolute intensity thresholding, followed by manual refinements. MBP fluorescence intensity values ranged from 0–4095 and mean intensity values within ROIs were used for comparisons. 2.4.
DTI-CLARITY analyses
Two separate coordinate systems were used for measurement and ROI definitions: DTI space and CLARITY space. These spaces were defined via registration to reference images from one selected reference brain (mouse #3) in the DTI and CLARITY space separately. This particular mouse brain was acquired in very similar orientation in both DTI and CLARITY space, therefore finding anatomical landmarks on the corresponding images was straightforward in these pairs of images. Similar anatomical structures were then identified and traced in each brain using the Surfaces module (semi-automatic based on intensity thresholding) in Imaris for CLARITY images and manual ROI tracing using TrackVis for DTI images. This resulted in 14 discrete 3D ROIs for each mouse brain, one set of 14 in the DTI space and another in the CLARITY space ( Fig. 1B ). The corresponding structures were visually checked based on anatomical landmarks, and subsequently their volumes showed excellent correlations between the two image spaces (Fig. 3B). WM ROIs were identified by tracing the MBP immunofluorescence signal in Imaris and the WM boundaries on FA maps in TrackVis). The identified ROI structures (Fig. 2B, C) were the anterior commissure (posterior aspect), corpus callosum (genu, body, splenium), fimbria (left, right), fornix (left, right), stria medullaris (left, right), fasciculus retroflexus (left, right) and the mammillothalamic tract (left, right). Once 3D ROIs were identified in the corresponding space, we registered FA images by applying a twelve-parameter affine linear transformation with FMRIB Linear Image Registration Tool (FLIRT; Jenkinson et al., 2002 ) and then applying the transform to the other scalar images. For CLARITY images, we down-sampled (1/10) and transformed the microscopy images into a 3D Nifti format with an in-house R ( http://www.R-project.org/ ) script. Downsampling was necessary because at the original resolution, the required memory was over the capacity of our workstation (> 400GB of RAM). We then applied a twelve-parameter affine registration (with FLIRT) to individual MBP maps to the corresponding reference brain in the MBP space. Transformation matrices for the original resolution were calculated by concatenating the transformations (down-sampling, registration, up-sampling) and applied to the native-resolution microscopy images. We further refined registrations manually using 3D Slicer ( http://www.slicer.org ; Fedorov et al., 2012 ). The mean MBP immunofluorescence intensities (from Imaris) and mean FA values (from TrackVis) within WM ROIs were measured and used for statistical comparisons. Statistical tests were performed using IBM SPSS version 22.0 and R (version 3.0) with mixed effect model analyses. For mixed models, we used anatomical region (ROI) as a categorical variable (fixed effect) and the DTI-derived metric (FA, AD, or RD) as a continuous variable to predict MBP, controlling for subject variability (random effect). Comparisons were performed using ANOVA or Spearman's correlation, with a P value of
📊 Figures
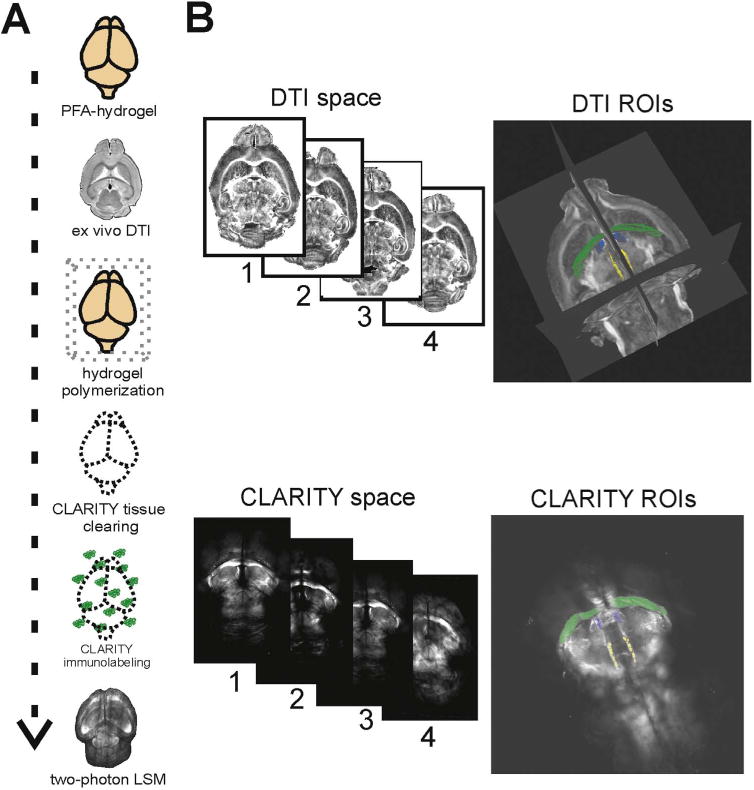
Fig. 1
Brain-wide analyses combining ex vivo DTI and CLARITY. ( A ) Schematic of experimental design for DTI-CLARITY multimodal approach. ( B ) DTI images were registered to a single reference brain within D...
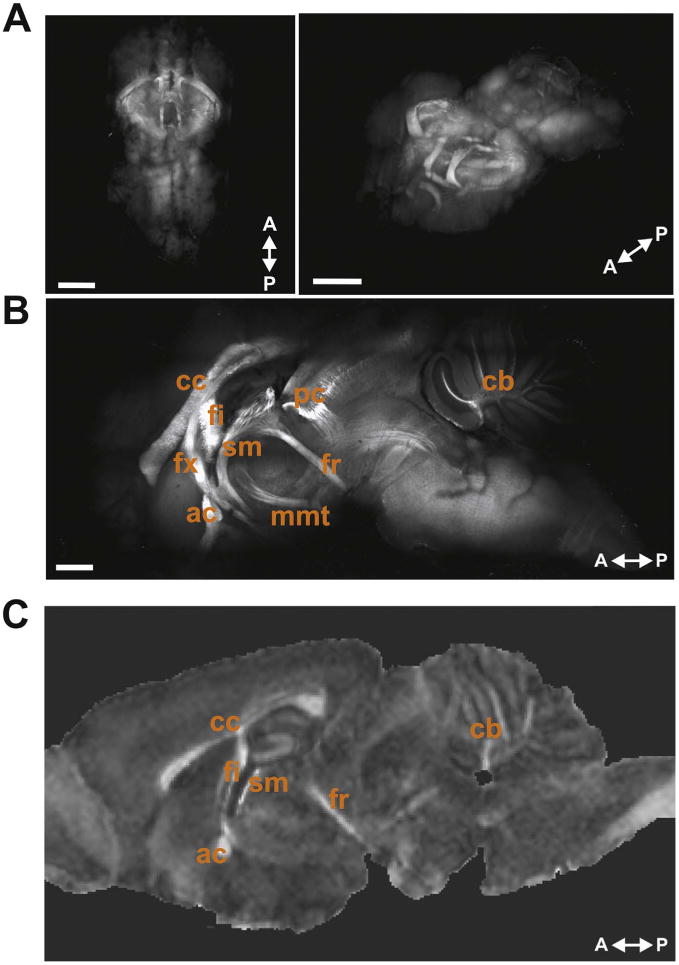
Fig. 2
Whole mouse brain CLARITY MBP immunolabeling. ( A ) Images of CLARITY MBP whole brain in 3D showing a top-down view (left) and rotated horizontal view (right). Scale bars, 2 mm. ( B ) 1500 u00b5m sagi...
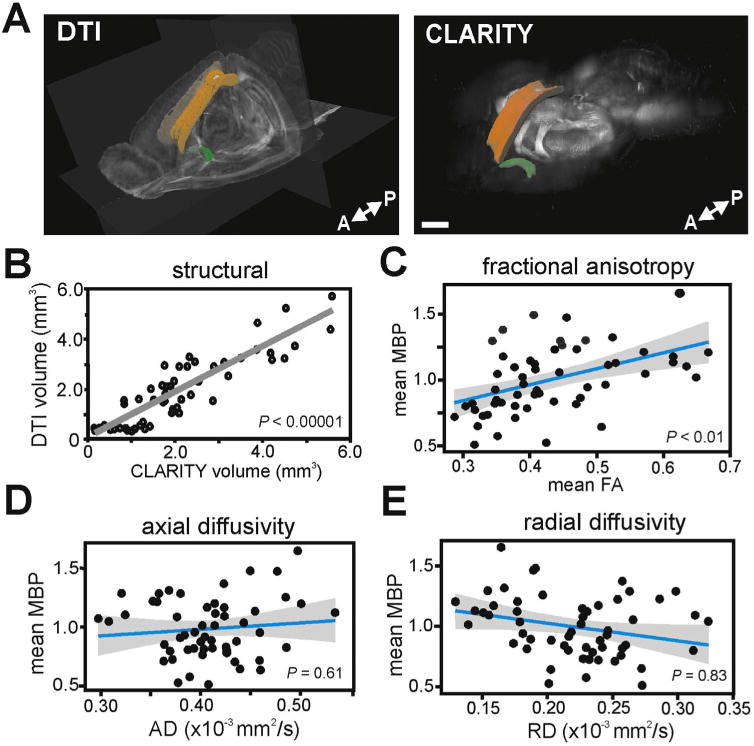
Fig. 3
FA is correlated with MBP immunofluorescence. ( A ) Images show ROI-based comparisons of WM ROIs in DTI space (left) and MBP-positive WM structures in CLARITY space (right). Displayed ROIs are corpus ...
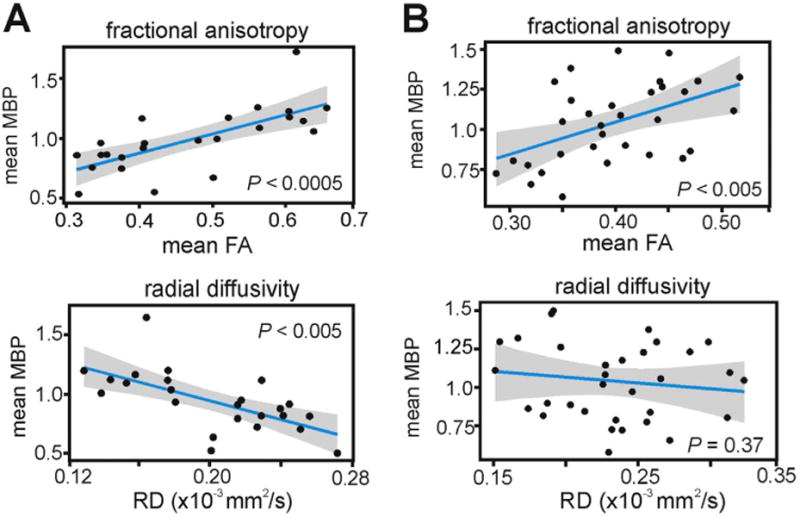
Fig. 4
RD does not correlate with myelination in a subset of WM tracts. ( A ) Within a subset of mainly commissural WM tracts, FA and RD were significantly correlated with MBP immunofluorescence. ( B ) RD di...
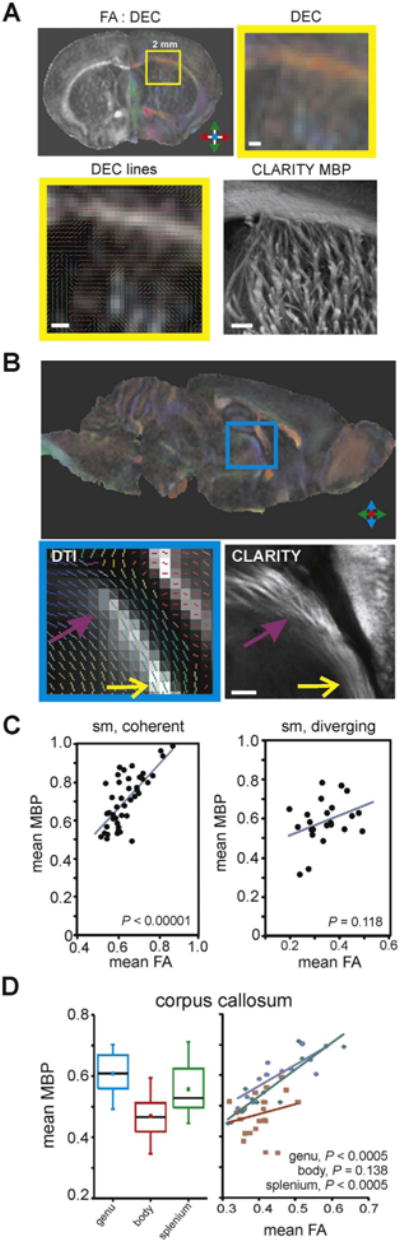
Fig. 5
Spatial resolution differences and within-tract analyses. ( A ) Comparison of coronal FA and direction-encoded color (DEC) FA maps to CLARITY MBP microscopy. The low spatial resolution of the DTI imag...
Figure images are served from the NIH/NLM PubMed Central Open Access Subset or Europe PMC; copyright remains with the publishers and authors.
💬 Discussion
0 commentsNo comments yet. Be the first to start a discussion!
Leave a Comment