Abstract
Regulatory volume decrease (RVD) is a process by which cells restore their original volume in response to swelling. In this study, we have focused on the role played by two different Aquaporins (AQPs), Aquaporin‐4 (AQP4), and Aquaporin‐1 (AQP1), in triggering RVD and in mediating calcium signaling in astrocytes under hypotonic stimulus. Using biophysical techniques to measure water flux through the plasma membrane of wild‐type (WT) and AQP4 knockout (KO) astrocytes and of an astrocyte cell line (DI TNC1) transfected with AQP4 or AQP1, we here show that AQP‐mediated fast swelling kinetics play a key role in triggering and accelerating RVD. Using calcium imaging, we show that AQP‐mediated fast swelling kinetics also significantly increases the amplitude of calcium transients inhibited by Gadolinium and Ruthenium Red, two inhibitors of the transient receptor potential vanilloid 4 (TRPV4) channels, and prevented by removing extracellular calcium. Finally, inhibition of TRPV4 or removal of extracellular calcium does not affect RVD. All together our study provides evidence that (1) AQP influenced swelling kinetics is the main trigger for RVD and in mediating calcium signaling after hypotonic stimulus together with TRPV4, and (2) calcium influx from the extracellular space and/or TRPV4 are not essential for RVD to occur in astrocytes. GLIA 2016;64:139–154
🔬 Techniques
✨ Fluorophores
🧪 Sample Preparation
🔬 Cell Lines
🏭 Microscope Brands
🧪 Reagent Suppliers
📷 Detectors
🏛️ Research Organizations (ROR)
Affiliated research institutions:
📋 Methods
Ethics Statement
All experiments conformed to international guidelines on the ethical use of animals and were designed to minimize the number of animals used and their suffering (Italian Health Department Approved Project n°100/2014-B). The mice used here were bred in the approved facility at the University of Bari. Mice were kept under a 12-h dark to light cycle, at constant room temperature and humidity (22°C±2°C, 75%), with food and water ad libitum , and supplied with environmental enrichment materials, such as toys and shelters. Animals AQP4 KO pups with a CD1 genetic background ( Basco et al., 2013 ) and age matched controls were used for astrocyte primary cultures prepared as described below.
Astrocytes Primary Cultures
Mouse astrocyte primary cultures were prepared from newborn pups as previously described ( Nicchia et al., 2000 ). Cells were cultured in DMEM-Glutamax medium supplemented with 10% fetal bovine serum (FBS), 100 U mL −1 penicillin and 100 mg mL −1 streptomycin, and maintained at 37°C in a 5% CO 2 incubator. All the cell culture products were purchased from Thermoscientific ( http://www.thermoscientific.com ).
Cell Cultures and Transfection The DI
TNC1 cell line, established from primary cultures of type 1 astrocytes from brain diencephalon tissue of 1-day-old rats, was purchased from American Tissue Culture Collection ( http://www.lgcstandards-atcc.org ). DI TNC1 cells were cultured and maintained as described previously ( Mola et al., 2009 ). To generate DI TNC1 cells stably transfected with AQP4 or AQP1, pmCherry-N1 human AQP4-M23 and pTarget human AQP1 constructs were used, respectively. Cells were transfected using Lipofectamine 2000 ( http://www.thermoscientific.com ) following the manufacturer’s instructions. pBABE-puro vector ( http://www.addgene.org ) was used to confer puromycin resistance.
Show full methods section
Ethics Statement
All experiments conformed to international guidelines on the ethical use of animals and were designed to minimize the number of animals used and their suffering (Italian Health Department Approved Project n°100/2014-B). The mice used here were bred in the approved facility at the University of Bari. Mice were kept under a 12-h dark to light cycle, at constant room temperature and humidity (22°C±2°C, 75%), with food and water ad libitum , and supplied with environmental enrichment materials, such as toys and shelters. Animals AQP4 KO pups with a CD1 genetic background ( Basco et al., 2013 ) and age matched controls were used for astrocyte primary cultures prepared as described below.
Astrocytes Primary Cultures
Mouse astrocyte primary cultures were prepared from newborn pups as previously described ( Nicchia et al., 2000 ). Cells were cultured in DMEM-Glutamax medium supplemented with 10% fetal bovine serum (FBS), 100 U mL −1 penicillin and 100 mg mL −1 streptomycin, and maintained at 37°C in a 5% CO 2 incubator. All the cell culture products were purchased from Thermoscientific ( http://www.thermoscientific.com ).
Cell Cultures and Transfection The DI
TNC1 cell line, established from primary cultures of type 1 astrocytes from brain diencephalon tissue of 1-day-old rats, was purchased from American Tissue Culture Collection ( http://www.lgcstandards-atcc.org ). DI TNC1 cells were cultured and maintained as described previously ( Mola et al., 2009 ). To generate DI TNC1 cells stably transfected with AQP4 or AQP1, pmCherry-N1 human AQP4-M23 and pTarget human AQP1 constructs were used, respectively. Cells were transfected using Lipofectamine 2000 ( http://www.thermoscientific.com ) following the manufacturer’s instructions. pBABE-puro vector ( http://www.addgene.org ) was used to confer puromycin resistance.
Antibodies
The following primary antibodies were used: goat anti-AQP4 polyclonal ( http://www.scbt.com ) and mouse anti-GFAP ( https://www.sigmaaldrich.com ). The following secondary antibodies were used: AlexaFluor488 donkey anti-goat and AlexaFluor647 donkey anti-mouse ( http://www.thermoscientific.com ) for immunofluorescence, and horseradish peroxidase (HRP) conjugated donkey anti-goat and donkey anti-mouse IgG ( http://www.scbt.com ) for Western blot.
Immunofluorescence
Primary astrocyte cultures were plated on coverslips and fixed in 4% paraformaldehyde, washed in phosphate buffered saline (PBS), and permeabilized with 0.3% Triton X-100 in PBS. After blocking with 1% BSA in PBS, cells were incubated with primary antibodies for 2 h at RT. After washings in PBS, cells were incubated for 1 h at RT with Alexa conjugated secondary antibodies. Coverslips were mounted on slides, using a mounting medium (PBS, 50% Glycerol, 0.1% N-Propil-Gallate) and examined by using a confocal microscope (TCS SP3, Leica). Once captured, the auto contrast function was applied to all the whole images using Adobe Photoshop CS5 in order to create a more accurate tonal and color correction workflow.
Western Blot Analysis
Astrocyte primary cultures were solubilized in at least ten volumes of RIPA buffer (25 mM Tris–HCl, pH 7,6; 150 mM NaCl; 1% Triton X-100; 1% sodium deoxycholate; 0,1% SDS) added with a cocktail of protease inhibitors ( https://lifescience.roche.com ). The lysis was performed on ice for 1 h and the samples were then centrifuged at 22,000 g for 45 min. The protein content of the supernatant was measured with a bicinchoninic acid (BCA) Protein Assay Kit ( http://www.thermoscientific.com ). Equal amounts of protein samples were separated by 12% Tris-Glycine-SDS-PAGE and transferred to polyvinylidene fluoride (PVDF) membranes ( http://www.merckmillipore.com/ ). Membranes with blotted proteins were incubated with primary antibodies, washed, and incubated with peroxidase-conjugated secondary antibodies. Reactive proteins were revealed with an enhanced chemiluminescent detection system ( http://www.thermoscientific.com ) and visualized on a Versadoc imaging system ( http://www.bio-rad.com ).
Osmotic Permeability Assays for Cell Swelling and RVD Analysis TIRF
Assay for Cell Swelling Analysis
Cells grown on 20 mm diameter round glass coverslips were washed with DPBS (0.9 mM CaCl 2 ; 0.5 mM MgCl 2 ; 2.7 mM KCl; 1.5 mM KH 2 PO 4 ; 138 mM NaCl; and 8 mM Na 2 HPO 4 ) and incubated with 1 μM of Calcein-AM ( http://www.thermoscientific.com ) for 45 min at RT. To determine AQP4-dependent water permeability, the osmotic properties of astrocytes were analyzed by total internal reflection fluorescence (TIRF) microscopy, measured in response to the osmotic gradient ( Nicchia et al., 2008 ). TIRF microfluorimetry allows measuring continuously the volume of adherent cells whose fluorescence is excited by the TIR evanescent field in a thin section (~150 nm) of cytosol at the cell-glass coverslip interface. Because the total number of fluorophores in the cytosol is constant, the fluorophore concentration and therefore the emitted fluorescence is inversely related to the cell volume ( Farinas et al., 1995 ) when 1 μM of Calcein-AM is used. Water permeability was measured using a Nikon Laser TIRF setup equipped with a 488 nm Argon laser mounted on a Nikon TE2000U Microscope that also allows phase-contrast and epifluorescence techniques to be combined with TIRF technology. An incidence angle greater than the critical angle was achieved by the use of a 60× CFI Plan Apo of 1.45 numerical aperture. The coverslips were mounted in a custom perfusion chamber, as described by Solenov et al. (2004) , designed for rapid solution exchange without causing cell detachment. Astrocytes in isotonic DPBS were perfused with hypotonic solution (100 mOsm L −1 , obtained by adding the appropriate amount of NaCl to NaCl-free DPBS) at high perfusion rate (40 mL min −1 with 0.4 s of exchange time between a colorless and dye-containing aqueous solution) at 10°C. The influx of water induced astrocyte swelling and a consequent reduction of Calcein-AM emitted fluorescence. Being WT and KO astrocytes characterized by a comparable morphology, and subjected to the same osmotic gradient, the osmotic properties of their plasma membrane were characterized by comparing the time constant for swelling, obtained from the experimental data, fitted to a exponential function (one phase decay).
Fluorescence-quenching Assay for Cell Swelling and RVD Analysis
Cells were seeded on black, clear bottom 96-well-plates (Corning, NY) at a density of 12,000 cells per well and used 24 h after plating. Nearly 80–85% confluent cells were washed with DPBS and incubated at 37°C for 45 min with 10 μM of Calcein-AM as previously described ( Mola et al. 2009 ). At 10 μM concentration, cytosolic Calcein-AM is quenched by intracellular components (proteins or salts) whose concentrations change upon cell swelling and shrinking. Therefore, differently from the TIRF assay, the measured changes in fluorescence are directly proportional to changes in cell volume ( Solenov et al., 2004 ). Calcein-AM fluorescence was recorded on a Flex Station3 plate reader equipped with an integrated automatic liquid handling module ( http://www.moleculardevices.com ) able to transfer compounds from a source plate to the assay plate during data acquisition. Cells were rinsed in isotonic DPBS and hypotonicity was applied 15 s after the beginning of each reading by adding an equal volume of NaCl-free DPBS in order to obtain 150 mOsm L −1 . The direct addition of the hypotonic solution to the preexisting isotonic solution caused an immediate hypotonic stimulus. Time course fluorescence data following mixing of cells were recorded at 37°C over the indicated period (100 s or 20 min) in order to record the swelling phase and the RVD phase. Data acquisition was performed using SoftMax Pro software, and the data were analyzed with Prism (Graph Pad) software. Being WT and KO astrocytes, as well as AQP transfected and WT-DI TNC1, characterized by a comparable morphology, and subjected to the same osmotic gradient, the osmotic properties of their plasma membrane were characterized by comparing the time constant (for the swelling-phase and the RVD phase) obtained by fitting the data with an exponential function. The RVD was also expressed as a percentage of volume recovery calculated from the maximum level of fluorescence after exposure to hypotonic solution and the level of fluorescence reached after the RVD.
Intracellular Calcium Measurements
The kinetic of intracellular calcium concentration was measured using the imaging technique based on the use of a Nikon ECLIPSE TE 2000-S microscope and a FlexStation3 plate reader.
Calcium Imaging
Intracellular calcium measurements were performed as previously described ( Scemes, 2008 ) at RT. Briefly, primary cultured astrocytes grown on confocal dishes were loaded with the ratiometric calcium indicator, Fura-2-AM (8 μM; Molecular Probes) for 40 min and then rinsed in DPBS. The hypotonic stimulus was induced 15 s after the beginning of each reading by adding an equal volume of NaCl-free DPBS in order to obtain 150 mOsm L −1 . Measurements of calcium concentration in single cells were performed using an inverted fluorescence microscope (Nikon ECLIPSE TE 2000-S) equipped with a cooled CCD camera controlled by the Metafluor 4.6 software (Universal Imaging, Downingtown, PA). For each experiment around 30 cells per coverlip were analyzed. Fura-2 ratio values were translated into intracellular calcium concentrations according to an in vitro calibration curve of the form: [calcium]In=KD{( R − R min )/( R max − R )} (F380min/F380max), where [calcium]In is the calculated intracellular calcium concentration, KD is the dissociation constant of free-calcium for Fura-2 [KD=224 nM; ( Grynkiewicz et al., 1985 )], R is the ratio intensity, R min is the ratio of the intensity obtained at zero calcium, R max is the ratio of the intensity at saturated calcium, F380min is the fluorescence intensity measured with zero calcium at 380 nm, and F380max is the fluorescence intensity measured with saturated calcium at 380 nm. Microplate Reader Twenty four hours after plating in 96-well black-walled, clear bottom plates, cells were loaded with 8 μM Fura-2-AM in DMEM growth medium for 30 min at 37°C. Cells were then washed with DPBS and stabilized in the same buffer for 10 min at 37°C. Rapid changes in intracellular calcium levels in response of extracellular stimuli were monitored using a FlexStation3 plate reader thermostatically regulated at 37°C. The hypotonic stimulus was induced 40 s after the beginning of the data acquisition by adding an equal volume of NaCl-free DPBS in order to obtain 150 mOsm L −1 and the fluorescence was recorded for 200 s. Compounds were added from a 96-well reservoir plate with pipette heights, fluid transfer volume and rate of addition optimized to minimize disturbance of the cells while ensuring rapid mixing. Fluorescence response was measured using the ratio peaks RFU at 340 and 380 nm (F340/F380) and relative timing. Data analysis was performed using SoftMaxPro and Prism (Graph Pad).
Cyclopiazonic Acid Treatment
The content of intracellular calcium stores was assessed by using cyclopiazonic acid (CPA), an inhibitor of SERCA pump. Fura-2-AM loaded cells were perfused with 50 μM CPA in calcium- and magnesium-free DPBS added with 1 mM EGTA. The cells were perfused with regular DPBS after 300 sec of recording to evaluate calcium influx.
Gadolinium and Ruthenium Red Treatment
Gadolinium and Ruthenium Red were used at 10 and 20 μM to assess the contribution of membrane ion channels to the swelling-induced intracellular calcium response and RVD. Cells were exposed to each drug 5 min prior to the functional analysis described above. The possibility that Gadolinium and Ruthenium Red affect the fluorescence over time of Fura-2-AM or Calcein-AM loaded cells was ruled out by measuring their fluorescence before and after the addition of the pharmacological agents ( Supp. Info. Fig. 1 ).
Statistical Analysis
Data are expressed as mean±SE of the number of experiments (n) indicated in the figure legend. In all the assays “n” is referred to the number of independent experiments performed on different cell preparations. For each experiment at least three to four different coverslips or wells were analyzed. Statistically significant differences were computed using one-way Anova or t test, the significance level being set at P
📊 Figures
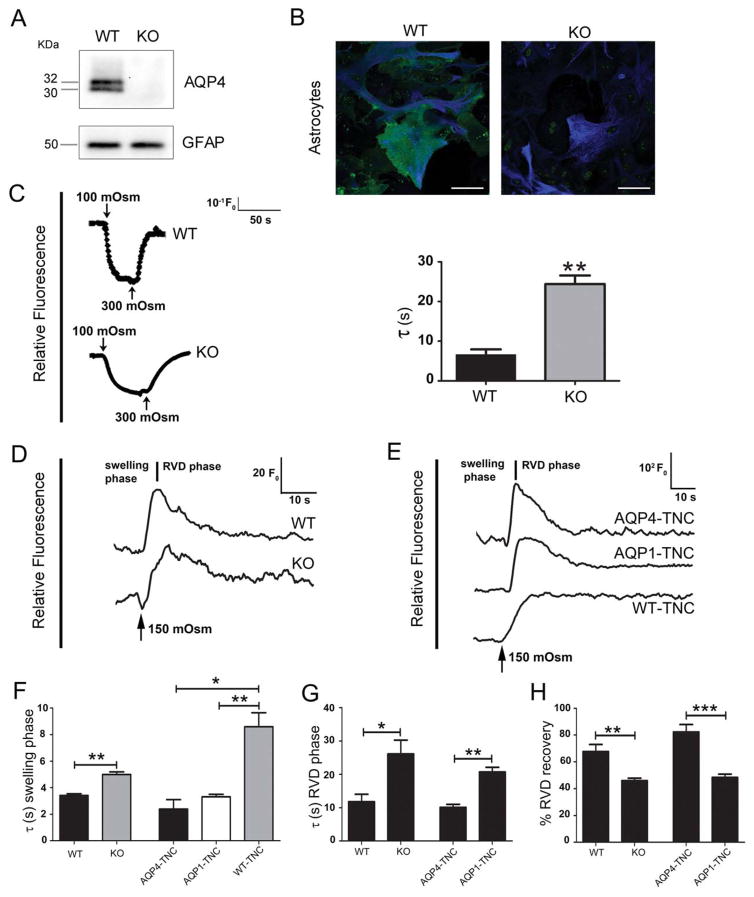
FIGURE 1
Water transport and RVD in primary cultured astrocytes endogenously expressing AQP4 and in DI TNC1 transfected with AQP4 or AQP1. ( A ) Western blots showing AQP4 and GFAP expression in WT and AQP4 KO...

FIGURE 2
Hypotonic stimulus induced intracellular calcium rise in WT and AQP4 KO astrocytes. ( A,B ) Time courses of intracellular calcium concentration changes recorded from WT ( A ) and AQP4 KO (B) astrocyte...
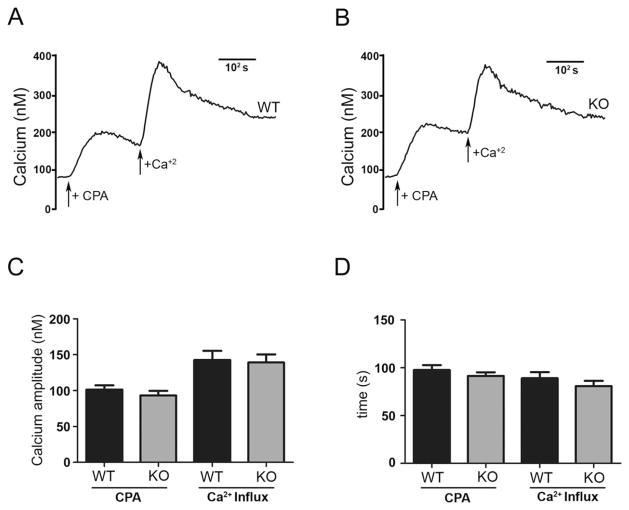
FIGURE 3
Intracellular calcium content and calcium release activated channels are not altered in AQP4 KO astrocytes. ( A , B ) Kinetics of cytosolic calcium changes induced by CPA (+CPA) and following addition...
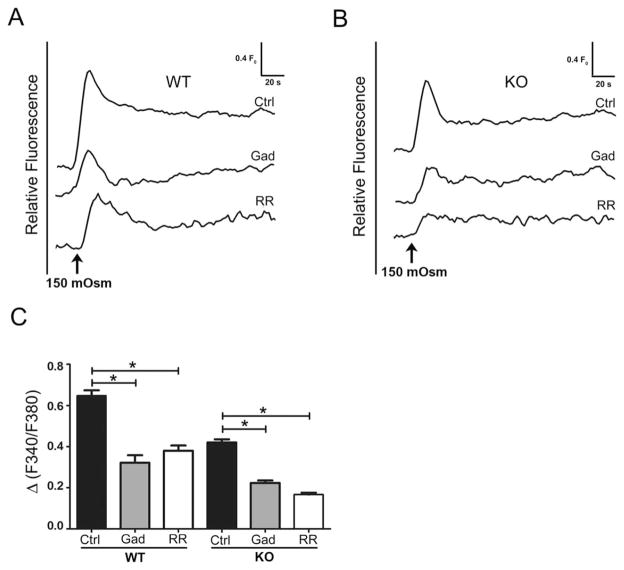
FIGURE 4
Gadolinium and Ruthenium Red partially block calcium increase induced by hypotonicity-induced astrocyte swelling. Superimposed kinetics of calcium responses recorded from untreated (Ctrl) and Gadolini...
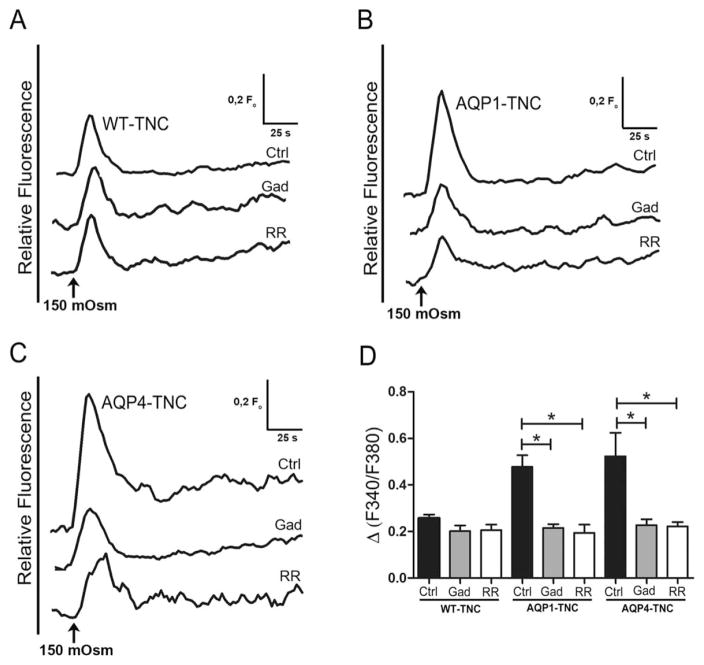
FIGURE 5
Intracellular calcium response under hypothonic stimulus in WT and AQP1 or AQP4 transfected DI TNC1 treated with Gadolinium or Ruthenium Red. Superimposed kinetics of calcium concentration after hypot...
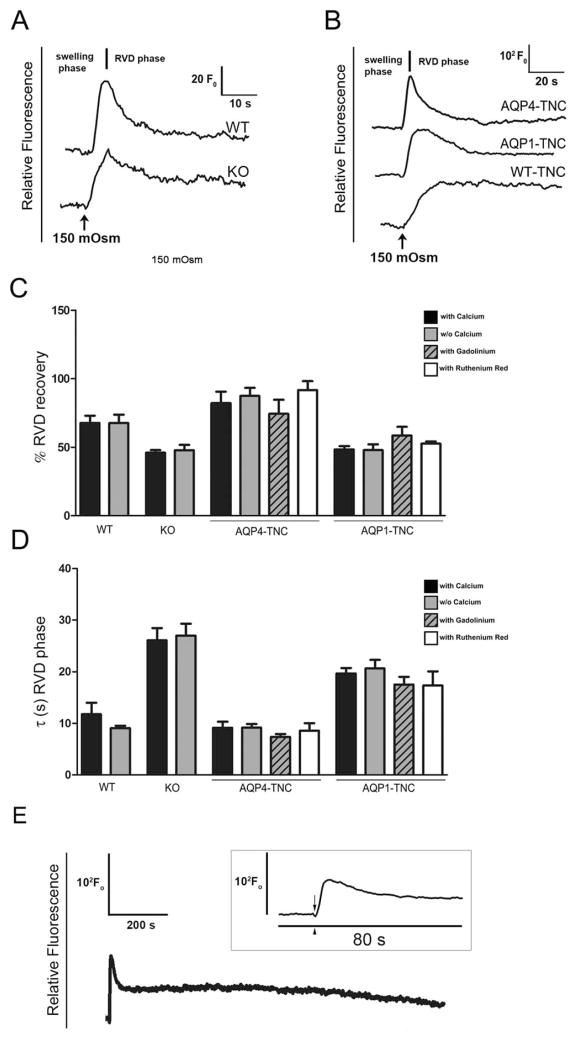
FIGURE 6
RVD in WT, AQP4 KO astrocytes and AQP expressing DI TNC1 is not dependent on extracellular calcium and TRPV4. ( A , B ) Kinetics of RVD recorded from astrocyte primary cultures (A) and DI TNC1 (B) exp...

FIGURE 7
Schematic representation of the mechanism proposed to describe the different effect of slow and fast swelling kinetics on calcium response and RVD. The absence ( A ) or presence ( B ) of AQP water cha...
Figure images are served from the NIH/NLM PubMed Central Open Access Subset or Europe PMC; copyright remains with the publishers and authors.
💬 Discussion
0 commentsNo comments yet. Be the first to start a discussion!
Leave a Comment