Abstract
ABSTRACT All positive-strand RNA viruses induce membrane structures in their host cells which are thought to serve as suitable microenvironments for viral RNA synthesis. The structures induced by enteroviruses, which are members of the family Picornaviridae , have so far been described as either single- or double-membrane vesicles (DMVs). Aside from the number of delimiting membranes, their exact architecture has also remained elusive due to the limitations of conventional electron microscopy. In this study, we used electron tomography (ET) to solve the three-dimensional (3-D) ultrastructure of these compartments. At different time points postinfection, coxsackievirus B3-infected cells were high-pressure frozen and freeze-substituted for ET analysis. The tomograms showed that during the exponential phase of viral RNA synthesis, closed smooth single-membrane tubules constituted the predominant virus-induced membrane structure, with a minor proportion of DMVs that were either closed or connected to the cytosol in a vase-like configuration. As infection progressed, the DMV number steadily increased, while the tubular single-membrane structures gradually disappeared. Late in infection, complex multilamellar structures, previously unreported, became apparent in the cytoplasm. Serial tomography disclosed that their basic unit is a DMV, which is enwrapped by one or multiple cisternae. ET also revealed striking intermediate structures that strongly support the conversion of single-membrane tubules into double-membrane and multilamellar structures by a process of membrane apposition, enwrapping, and fusion. Collectively, our work unravels the sequential appearance of distinct enterovirus-induced replication structures, elucidates their detailed 3-D architecture, and provides the basis for a model for their transformation during the course of infection. IMPORTANCE Positive-strand RNA viruses hijack specific intracellular membranes and remodel them into special structures that support viral RNA synthesis. The ultrastructural characterization of these “r e plication structures” is key to understanding their precise role. Here, we resolved the three-dimensional architecture of enterovirus-induced membranous compartments and their transformation in time by applying electron tomography to cells infected with coxsackievirus B3 (CVB3). Our results show that closed single-membrane tubules are the predominant initial virus-induced structure, whereas double-membrane vesicles (DMVs) become increasingly abundant at the expense of these tubules as infection progresses. Additionally, more complex multilamellar structures appear late in infection. Based on compelling intermediate structures in our tomograms, we propose a model for transformation from the tubules to DMVs and multilamellar structures via enwrapping events. Our work provides an in-depth analysis of the development of an unsuspected variety of distinct replication structures during the course of CVB3 infection.
🔬 Techniques
🔭 Microscopes
💻 Software
✨ Fluorophores
🧪 Sample Preparation
🔬 Cell Lines
🏭 Microscope Brands
🧪 Reagent Suppliers
📷 Detectors
💻 Software Details
🏛️ Research Organizations (ROR)
Affiliated research institutions:
📋 Methods
Cells, antibodies, and virus. Vero E6 cells were maintained in Dulbecco’s modified Eagle’s medium (Gibco) supplemented with 10% fetal calf serum and 90 IU/ml of penicillin and streptomycin, and grown at 37°C in 5% CO 2 . The rabbit antiserum directed against the nonstructural protein 3A was described previously ( 42 ). Rabbit antisera against CVB3 3C and 3D were generously provided by C. E. Cameron (Pennsylvania State University).
Mouse monoclonal antibodies against dsRNA
(J2) and against β-actin were purchased from English & Scientific Consulting and Sigma Aldrich, respectively. The secondary antibodies Alexa Fluor 594-conjugated goat-anti-rabbit IgG and Alexa Fluor 488-conjugated goat-anti-mouse IgG were purchased from Molecular Probes. Coxsackievirus B3 (CVB3) was obtained by transfecting in vitro -transcribed RNA derived from the p53CB3/T7 plasmid, which contains the cDNA of CVB3 strain Nancy driven by a T7 RNA polymerase promoter ( 15 ). Virus titers were determined by endpoint titration analysis and expressed as 50% cell culture infectious doses (CCID 50 ). All virus infections were carried out using a multiplicity of infection (MOI) of 30 to 50. Immunofluorescence assay. Vero E6 cells grown on coverslips were infected with CVB3 for 30 minutes, after which the inoculum was removed and fresh medium was added. At various time points postinfection, cells were fixed with 4% paraformaldehyde and permeabilized with phosphate-buffered saline containing 0.1% Triton X-100. Cells were then stained with primary and secondary antibodies and analyzed with a wide-field Leica BMR microscope. Western blot analysis. CVB3-infected Vero E6 cells were collected in lysis buffer (50 mM Tris-HCl [pH 7.4], 150 mM NaCl, 1 mM EDTA, 1% Nonidet P-40, 0.05% sodium dodecyl sulfate) and heated for 5 min at 95°C after addition of Laemmli sample buffer. Samples were run on a 12.5% polyacrylamide gel and transferred to a nitrocellulose membrane (Bio-Rad). Viral proteins 3A and 3D, as well as β-actin, which served as a loading control, were detected with primary antibodies and secondary IRDye anti-mouse or anti-rabbit antibodies (Li-Cor Biosciences). Imaging was done with the Odyssey system. Quantitative PCR. RNA was isolated from infected cells using a GenElute mammalian total miniprep RNA kit (Sigma). cDNA was synthesized using a TaqMan reverse transcription reagents kit (Roche), which contains random hexamers as primers. Then, a quantitative PCR (qPCR) was performed with the forward primer 5′ CGTGGGGCTACAATCAAGTT 3′ , the reverse primer 5′ TAACAGGAGCTTTGGGCATC 3′ , and the LightCycler 480 SYBR Green I master kit (Roche) for 45 cycles (5 s at 95°C, 10 s at 60°C, and 20 s at 72°C) on a LightCycler 480 (Roche). EM sample preparation. Vero E6 cells were grown on sapphire discs and infected with CVB3 for 1 h. The cells were high-pressure frozen at different time points p.i. using a Leica EM PACT2. EM sample preparation was always accompanied by an immunofluorescence assay as a control to assess the phase of infection. Freeze-substitution was performed in an automated freeze-substitution system (Leica AFS2). Multiple freeze-substitution media were tested to improve the visualization of the membranes of the virus-induced structures, which, in agreement with previous reports ( 7 , 10 ), appeared to be more difficult to contrast than other cellular membranes. In this respect, the inclusion of water and glutaraldehyde was found to be beneficial. The selected freeze-substitution medium was acetone containing 10% H 2 O, 2% osmium tetroxide, and 1% anhydrous glutaraldehyde. Samples were first maintained for 44 h at −90°C and then warmed to −20°C within 7 h, kept at −20°C for 12 h, warmed to 0°C within 2 h, and left at 0°C for 1 h. After washing with acetone at 0°C, samples were gradually infiltrated with epoxy resin LX-112 (Ladd Research) and polymerized at 60°C. Thin sections of 100 nm were counterstained with uranyl acetate and lead citrate. For the 3-D analysis, sample preparation was identical, except that 0.1% low-molecular-weight tannic acid (Electron Microscopy Sciences) was added to the freeze-substitution medium to provide additional contrast to the membranes. Samples were cut into 150- to 200-nm-thick serial sections that were placed on parallel bar copper grids (R100; Electron Microscopy Sciences) coated with Formvar and carbon. Colloidal 10-nm gold particles were layered on both sides of the sections to serve as markers for alignment. Electron microscopy. All the EM data (2-D and 3-D) were acquired in a FEI Tecnai12 BioTWIN electron microscope operating at 120 kV and equipped with an Eagle 4k cooled slow-scan charge-couple device (CCD) camera (FEI Company), using binning mode 2. Electron tomography. For each time point, multiple tilt series were collected for different cells using a dual-axis tomography holder (Fischione) and SerialEM acquisition software ( 45 ). The images, covering 130° around the specimen in 1° increments along two orthogonal axes, were recorded with a pixel size of 1.2 nm at the specimen level. For selected areas, dual-axis tilt series were acquired in three consecutive serial sections. The alignment, computation of electron tomograms, and joining of serial tomograms were performed using IMOD software ( 46 ). For visualization and presentation purposes, the tomograms were mildly denoised using a nonlinear anisotropic diffusion algorithm ( 47 ). The 3-D surface renderings were created with AMIRA (TSG Europe), drawing masks to separate the individual structures, which were then automatically thresholded.
Show full methods section
Cells, antibodies, and virus. Vero E6 cells were maintained in Dulbecco’s modified Eagle’s medium (Gibco) supplemented with 10% fetal calf serum and 90 IU/ml of penicillin and streptomycin, and grown at 37°C in 5% CO 2 . The rabbit antiserum directed against the nonstructural protein 3A was described previously ( 42 ). Rabbit antisera against CVB3 3C and 3D were generously provided by C. E. Cameron (Pennsylvania State University).
Mouse monoclonal antibodies against dsRNA
(J2) and against β-actin were purchased from English & Scientific Consulting and Sigma Aldrich, respectively. The secondary antibodies Alexa Fluor 594-conjugated goat-anti-rabbit IgG and Alexa Fluor 488-conjugated goat-anti-mouse IgG were purchased from Molecular Probes. Coxsackievirus B3 (CVB3) was obtained by transfecting in vitro -transcribed RNA derived from the p53CB3/T7 plasmid, which contains the cDNA of CVB3 strain Nancy driven by a T7 RNA polymerase promoter ( 15 ). Virus titers were determined by endpoint titration analysis and expressed as 50% cell culture infectious doses (CCID 50 ). All virus infections were carried out using a multiplicity of infection (MOI) of 30 to 50. Immunofluorescence assay. Vero E6 cells grown on coverslips were infected with CVB3 for 30 minutes, after which the inoculum was removed and fresh medium was added. At various time points postinfection, cells were fixed with 4% paraformaldehyde and permeabilized with phosphate-buffered saline containing 0.1% Triton X-100. Cells were then stained with primary and secondary antibodies and analyzed with a wide-field Leica BMR microscope. Western blot analysis. CVB3-infected Vero E6 cells were collected in lysis buffer (50 mM Tris-HCl [pH 7.4], 150 mM NaCl, 1 mM EDTA, 1% Nonidet P-40, 0.05% sodium dodecyl sulfate) and heated for 5 min at 95°C after addition of Laemmli sample buffer. Samples were run on a 12.5% polyacrylamide gel and transferred to a nitrocellulose membrane (Bio-Rad). Viral proteins 3A and 3D, as well as β-actin, which served as a loading control, were detected with primary antibodies and secondary IRDye anti-mouse or anti-rabbit antibodies (Li-Cor Biosciences). Imaging was done with the Odyssey system. Quantitative PCR. RNA was isolated from infected cells using a GenElute mammalian total miniprep RNA kit (Sigma). cDNA was synthesized using a TaqMan reverse transcription reagents kit (Roche), which contains random hexamers as primers. Then, a quantitative PCR (qPCR) was performed with the forward primer 5′ CGTGGGGCTACAATCAAGTT 3′ , the reverse primer 5′ TAACAGGAGCTTTGGGCATC 3′ , and the LightCycler 480 SYBR Green I master kit (Roche) for 45 cycles (5 s at 95°C, 10 s at 60°C, and 20 s at 72°C) on a LightCycler 480 (Roche). EM sample preparation. Vero E6 cells were grown on sapphire discs and infected with CVB3 for 1 h. The cells were high-pressure frozen at different time points p.i. using a Leica EM PACT2. EM sample preparation was always accompanied by an immunofluorescence assay as a control to assess the phase of infection. Freeze-substitution was performed in an automated freeze-substitution system (Leica AFS2). Multiple freeze-substitution media were tested to improve the visualization of the membranes of the virus-induced structures, which, in agreement with previous reports ( 7 , 10 ), appeared to be more difficult to contrast than other cellular membranes. In this respect, the inclusion of water and glutaraldehyde was found to be beneficial. The selected freeze-substitution medium was acetone containing 10% H 2 O, 2% osmium tetroxide, and 1% anhydrous glutaraldehyde. Samples were first maintained for 44 h at −90°C and then warmed to −20°C within 7 h, kept at −20°C for 12 h, warmed to 0°C within 2 h, and left at 0°C for 1 h. After washing with acetone at 0°C, samples were gradually infiltrated with epoxy resin LX-112 (Ladd Research) and polymerized at 60°C. Thin sections of 100 nm were counterstained with uranyl acetate and lead citrate. For the 3-D analysis, sample preparation was identical, except that 0.1% low-molecular-weight tannic acid (Electron Microscopy Sciences) was added to the freeze-substitution medium to provide additional contrast to the membranes. Samples were cut into 150- to 200-nm-thick serial sections that were placed on parallel bar copper grids (R100; Electron Microscopy Sciences) coated with Formvar and carbon. Colloidal 10-nm gold particles were layered on both sides of the sections to serve as markers for alignment. Electron microscopy. All the EM data (2-D and 3-D) were acquired in a FEI Tecnai12 BioTWIN electron microscope operating at 120 kV and equipped with an Eagle 4k cooled slow-scan charge-couple device (CCD) camera (FEI Company), using binning mode 2. Electron tomography. For each time point, multiple tilt series were collected for different cells using a dual-axis tomography holder (Fischione) and SerialEM acquisition software ( 45 ). The images, covering 130° around the specimen in 1° increments along two orthogonal axes, were recorded with a pixel size of 1.2 nm at the specimen level. For selected areas, dual-axis tilt series were acquired in three consecutive serial sections. The alignment, computation of electron tomograms, and joining of serial tomograms were performed using IMOD software ( 46 ). For visualization and presentation purposes, the tomograms were mildly denoised using a nonlinear anisotropic diffusion algorithm ( 47 ). The 3-D surface renderings were created with AMIRA (TSG Europe), drawing masks to separate the individual structures, which were then automatically thresholded.
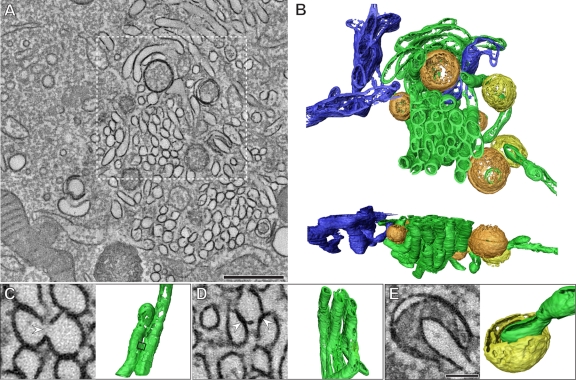
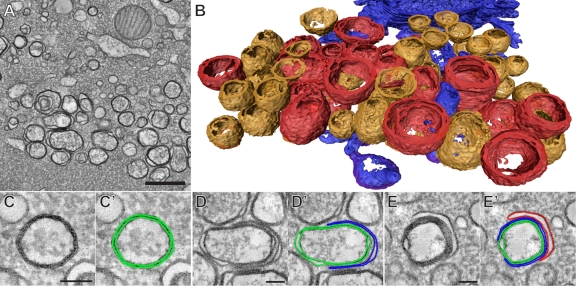
SUPPLEMENTAL MATERIAL Movie S1 ET and 3-D modeling of early CVB3-induced membrane structures. The video illustrates the serial tomographic reconstruction presented in Fig. 3 , which encompassed a total cellular volume of around 2.3 µm by 2.3 µm by 0.6 µm. From the series of consecutive slices (2.2 nm thick) through the serial tomogram, a surface-rendered model was derived in which the clustering of parallel tubules becomes particularly apparent. DMVs are colored according to their topology, in yellow (open in a vase-like configuration) or orange (closed). ER membranes are in blue. Download Movie S1, MOV file, 17.3 MB . Movie S1, MOV file, 17.3 MB Movie S2 ET-based modeling of late CVB3-induced compartments. The animation illustrates the results presented in Fig. 4 , first through consecutive slices (2.2 nm thick) through the serial tomogram (total volume around 2.3 µm by 2.3 µm by 0.4 µm) and then with the surface-rendered model derived from it. The model highlights the relative abundance of DMVs (orange) and multilamellar structures (red) at this stage of infection. Blue, ER; light blue, mitochondria. Download Movie S2, MOV file, 12.6 MB . Movie S2, MOV file, 12.6 MB Movie S3 Intermediate structures between tubules and DMVs. The movie shows the tomograms of the structures presented in Fig. 6, plus two additional examples of open DMVs. Each frame is a 4.8-nm-thick xy slice of the corresponding structure. Download Movie S3, MOV file, 10.3 MB . Movie S3, MOV file, 10.3 MB Movie S4 Examples of enwrapping structures present in the tomograms. Reconstructions of other CVB3-induced structures that represent additional examples of enwrapping. The animation consists of consecutive xy slices (4.8 nm thick) through the tomograms. First, an open DMV enwrapping a tubule is shown. Fusion of the ends of such an open DMV could give rise to a minor proportion of DMVs present in the tomograms that contain a vesicle inside, which may have pinched off from the enwrapped tubule (second). Similarly, multiple layered cisternae enwrap different structures, such as tubules (third) or DMVs (fourth). Scale bars, 100 nm. Download Movie S4, MOV file, 7.6 MB . Movie S4, MOV file, 7.6 MB
📊 Figures
FIGu00a01
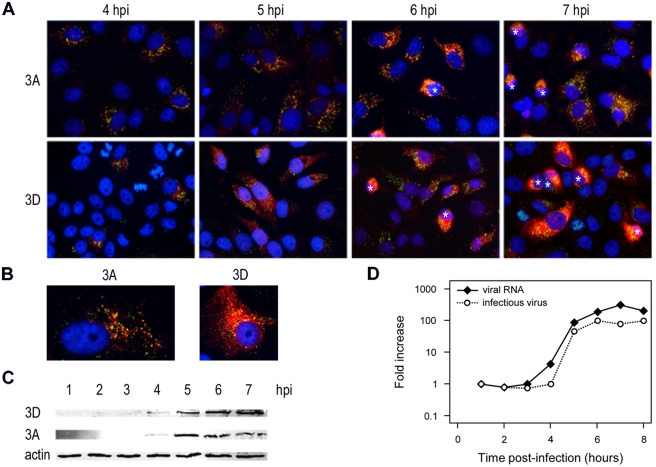
Time course analysis of CVB3 infection in Vero E6 cells. (A and B) Fluorescent images of CVB3-infected cells stained for dsRNA (green) and for viral proteins 3A and 3D (red). Nuclei are stained with H...
FIGu00a02
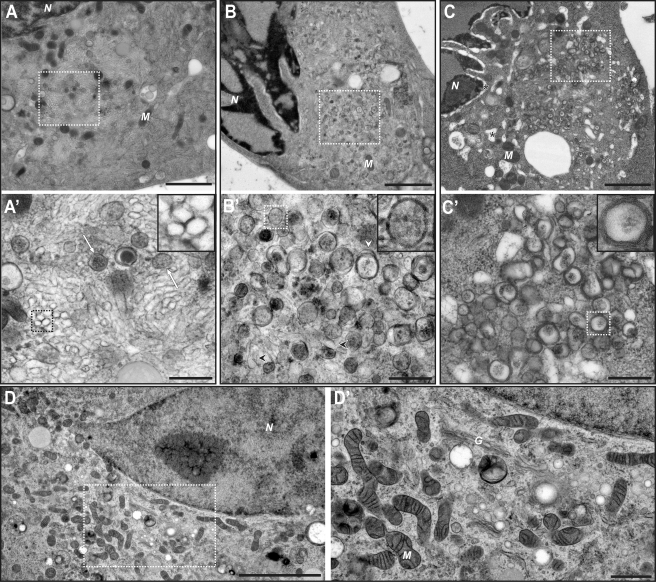
Electron micrographs of CVB3-infected Vero E6 cells, high-pressure frozen at 5u00a0h p.i. (A and Au2032), 6u00a0h p.i. (B and Bu2032), and 7u00a0h p.i. (C and Cu2032). (A) At 5u00a0h p.i., large clust...
FIGu00a03
ET of the early CVB3-induced membrane modifications (5u00a0h p.i.) (see also Movieu00a0S1 in the supplemental material). (A) Tomographic slice through the serial tomogram, with clusters of single-memb...
FIGu00a04
ET of the CVB3-induced modifications typical of late infection (7u00a0h p.i.) (see also Movieu00a0S2 in the supplemental material). (A) The multiple membranes in the vesicles found at this stage are c...
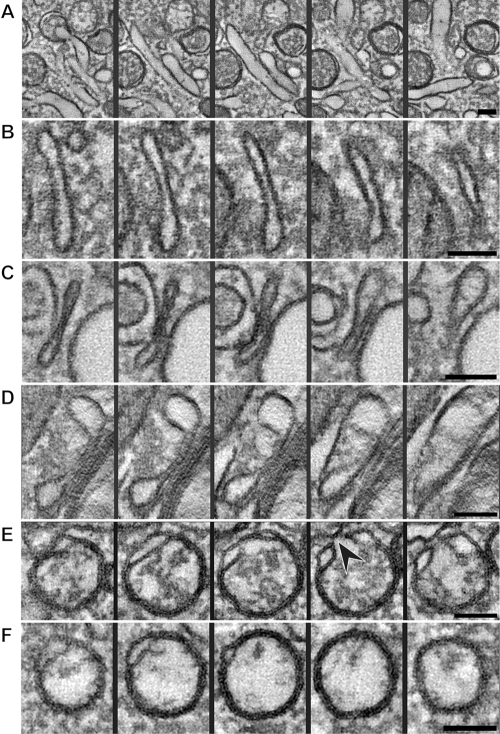
FIGu00a05
Tomographic xy slices through different structures possibly involved in the transition from a tubule to a closed DMV (see also Movieu00a0S3 in the supplemental material). (A) A longitudinally oriented...
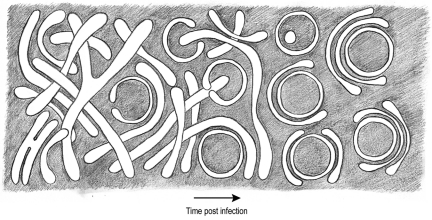
FIGu00a06
ET-based transition model for CVB3-induced replication structures. The single membrane tubules present early in infection transform into double- and multiple-membrane structures as CVB3 infection proc...
Figure images are served from the NIH/NLM PubMed Central Open Access Subset or Europe PMC; copyright remains with the publishers and authors.
💬 Discussion
0 commentsNo comments yet. Be the first to start a discussion!
Leave a Comment