Abstract
AbstractGiant mitochondria are peculiarly shaped, extremely large mitochondria in hepatic parenchymal cells, the internal structure of which is characterised by atypically arranged cristae, enlarged matrix granules and crystalline inclusions. The presence of giant mitochondria in human tissue biopsies is often linked with cellular adversity, caused by toxins such as alcohol, xenobiotics, anti-cancer drugs, free-radicals, nutritional deficiencies or as a consequence of high fat Western diets. To date, non-alcoholic fatty liver disease is the most prevalent liver disease in lipid dysmetabolism, in which mitochondrial dysfunction plays a crucial role. It is not well understood whether the morphologic characteristics of giant mitochondria are an adaption or caused by such dysfunction. In the present study, we employ a complementary multimodal imaging approach involving array tomography and transmission electron tomography in order to comparatively analyse the structure and morphometric parameters of thousands of normal- and giant mitochondria in four patients diagnosed with non-alcoholic fatty liver disease. In so doing, we reveal functional alterations associated with mitochondrial gigantism and propose a mechanism for their formation based on our ultrastructural findings.
🔬 Techniques
🔭 Microscopes
🧪 Sample Preparation
🏭 Microscope Brands
🧪 Reagent Suppliers
📷 Detectors
💻 Software Details
🏛️ Research Organizations (ROR)
Affiliated research institutions:
📋 Methods
Human NAFLD samples
In this study, fifty-seven wedge biopsies were studied from patients that underwent partial hepatectomy at Maastricht University Medical Centre between September 2005 and September 2009. 32 of the 57 biopsies acquired revealed the presence of GM, of which 4 samples were selected based on a positive double-blind diagnosis for NAFLD made by a clinical pathologist for subsequent 3-D ultrastructural analysis. The study was performed in accordance with the ethical standards of the Declaration of Helsinki, and written informed consent was obtained from each patient. The study was approved by the Medical Ethical Committee of the Maastricht University Medical Centre (Approval number: NCT02422238 ). Investigation of healthy subjects was out of the scope of this investigation as the collection of tissue biopsies in healthy subjects in not a standard routine practice.
Sample preparation for electron microscopy
Human liver wedge biopsies measuring ~ 1 cm × 1 cm × 1 cm were fixed with 1.5% glutaraldehyde in 0.067 M sodium cacodylate buffer (pH 7.4) (primary fixative) by means of injection perfusion fixation as previously described in detail 47 . Following the injection of the fixative which induces discolouration and hardening of the soft tissue starting at 20 s, tissues were cut into 1 mm × 1 mm × 1 mm blocks and allowed to react in the primary fixative for no longer than 20 min proceeding injection. Tissues were washed with 0.2 M sodium cacodylate buffer (pH 7.4) and post-fixed in 1% osmium tetroxide in 0.2 M phosphate buffer (pH 7.4) for 1 h at room temperature in darkness. Samples were washed with distilled water and dehydrated in an ascending series of ethanol concentrations starting at 70%. Following complete dehydration, samples were infiltrated with 50% Epon in absolute ethanol overnight, 100% Epon for 1 h and 100% Epon overnight. Tissues were transferred to BEEM capsules in 100% Epon and polymerised at 60 °C for 67 h. Array tomography (AT) In order to reconstruct large cellular volumes, hundreds of serial sections per sample were collected in accordance with the methods developed by Micheva and Smith 65 . Using a dissector blade, Epon-embedded blocks were trimmed forming a trapezoid approximately 2 × wider than the height of the block. A sparring mixture of Welwood glue and xylene (1:2) was applied to the long edge of the trapezoid and allowed to dry for 2 min. The application of the glue/xylene mixture was essential for adhesion between consecutive sections, ensuring the holistic reconstruction of 3-D structures from a series of 2-D sections 66 . For each sample, a series of 400 consecutive sections of 150 nm-thick sections (depth sectioned = ~ 60 µm/sample) was collected on a hydrophilized glass slide by means of glow discharging for 30 s. The slide was then placed on a hot plate (~ 60 °C), allowing the water to evaporate and the sections to stretch out and firmly adhere to the slide (2 min). Next, the glass slide was carbon-coated (15 nm) in order to render it electrically conductive and mounted on a SEM stub. Silver paint was applied from the top surface of the slide, to the underlying stub to further improve conductivity.
Show full methods section
Human NAFLD samples
In this study, fifty-seven wedge biopsies were studied from patients that underwent partial hepatectomy at Maastricht University Medical Centre between September 2005 and September 2009. 32 of the 57 biopsies acquired revealed the presence of GM, of which 4 samples were selected based on a positive double-blind diagnosis for NAFLD made by a clinical pathologist for subsequent 3-D ultrastructural analysis. The study was performed in accordance with the ethical standards of the Declaration of Helsinki, and written informed consent was obtained from each patient. The study was approved by the Medical Ethical Committee of the Maastricht University Medical Centre (Approval number: NCT02422238 ). Investigation of healthy subjects was out of the scope of this investigation as the collection of tissue biopsies in healthy subjects in not a standard routine practice.
Sample preparation for electron microscopy
Human liver wedge biopsies measuring ~ 1 cm × 1 cm × 1 cm were fixed with 1.5% glutaraldehyde in 0.067 M sodium cacodylate buffer (pH 7.4) (primary fixative) by means of injection perfusion fixation as previously described in detail 47 . Following the injection of the fixative which induces discolouration and hardening of the soft tissue starting at 20 s, tissues were cut into 1 mm × 1 mm × 1 mm blocks and allowed to react in the primary fixative for no longer than 20 min proceeding injection. Tissues were washed with 0.2 M sodium cacodylate buffer (pH 7.4) and post-fixed in 1% osmium tetroxide in 0.2 M phosphate buffer (pH 7.4) for 1 h at room temperature in darkness. Samples were washed with distilled water and dehydrated in an ascending series of ethanol concentrations starting at 70%. Following complete dehydration, samples were infiltrated with 50% Epon in absolute ethanol overnight, 100% Epon for 1 h and 100% Epon overnight. Tissues were transferred to BEEM capsules in 100% Epon and polymerised at 60 °C for 67 h. Array tomography (AT) In order to reconstruct large cellular volumes, hundreds of serial sections per sample were collected in accordance with the methods developed by Micheva and Smith 65 . Using a dissector blade, Epon-embedded blocks were trimmed forming a trapezoid approximately 2 × wider than the height of the block. A sparring mixture of Welwood glue and xylene (1:2) was applied to the long edge of the trapezoid and allowed to dry for 2 min. The application of the glue/xylene mixture was essential for adhesion between consecutive sections, ensuring the holistic reconstruction of 3-D structures from a series of 2-D sections 66 . For each sample, a series of 400 consecutive sections of 150 nm-thick sections (depth sectioned = ~ 60 µm/sample) was collected on a hydrophilized glass slide by means of glow discharging for 30 s. The slide was then placed on a hot plate (~ 60 °C), allowing the water to evaporate and the sections to stretch out and firmly adhere to the slide (2 min). Next, the glass slide was carbon-coated (15 nm) in order to render it electrically conductive and mounted on a SEM stub. Silver paint was applied from the top surface of the slide, to the underlying stub to further improve conductivity.
Inverted backscattered field emission scanning electron microscopy
(BSEM) was conducted using a Zeiss Sigma, operating at 4 kV at a working distance of 5.3 mm. Images (8 K × 8 K pixels, 16-bit, 11.9 × 11.9 × 150 nm voxel dimensions, pixel dwell time 3 µs) were acquired at 1200× magnification yielding a XY field of view of 98.4 µm 2 . In order to achieve anatomically consistent image registration over the 400 images captured for each dataset, a series of digital fiducial markers were manually aligned with cellular features of interest that change predictably between successive sections, such as parenchymal cell nuclei. This facilitated coarse alignment of images, accounting for rotational differences of regions of interest between serial sections, due to imperfectly straight ribbons, section compression and shearing caused by sectioning. Proceeding data acquisition, AT datasets were processed using Fiji, a freeware open-source image processing software package 67 . Datasets were converted to 8-bit pixel depth and resampled to a final voxel size of 37.5 × 37.5 × 150 nm by means of average pixel binning. Image histogram stack normalisation was performed, in order to improve global image contrast. Images were automatically aligned using the StackReg plugin for Fiji 68 and finally cropped to produce a symmetrical 3-D dataset. Transmission electron tomography (TET) In order to reconstruct the fine internal ultrastructure of GM, 120 nm-thick sections were generated from the same blocks previously sectioned and mounted onto 200 mesh copper grids. Sections were then post-stained with 2% aqueous uranyl acetate and Reynold’s lead citrate for 10 min each. Two tomograms were acquired at 15,000× and 30,000× magnifications respectively, using a JEM-2100 (Jeol, Japan) transmission electron microscope operating at 200 kV. Single axis tilt series were captured with a bottom-mounted UltraScan 4000 large-format CCD camera (Gatan, Japan) over a − 60° to + 60° tilt range (increment 1°) using automated tomography acquisition software (TEMography, 3-D Reconstruction Software, JEOL, Japan). Tilt series were aligned and computed into a tomogram using back-projection algorithms (TEMography). 3-D Segmentation, visualisation and sampling protocol For 3-D modelling and visualisation, datasets were processed using IMOD a suite of image processing, modelling and display programs used for 3-D reconstruction and segmentation of tomographic data and EM serial sections 69 . For AT datasets, cellular structures of interest were segmented by means of manual tracing of high-contrast lines using 3dmod, a graphical user interface application that is bundled with the IMOD software package 69 . Four cells from each patient were selected (16 cells in total), and each cell was divided into four equal planes (64 planes in total) along the XZ axis. In order to eliminate potential selection bias, all mitochondria intersecting one of the four XY -slicer images—tangential to the four XZ divisions for each cell—was segmented, rendered and classified either as a “normal” or “giant mitochondrion” on the basis of morphological features. For each HPC, the plasma membrane and associated nuclei were also modelled. Of special note, in order to provide a more detailed visual example and morphometric illustration of an entire cell of interest, the total mitochondrial population, intracellular lipid droplets and HPC nuclei were also modelled (patient 4) . For TET datasets, the inner and outer mitochondrial membranes were delineated by means of manual tracing, whilst intramitochondrial crystalline inclusions and enlarged matrix granules were segmented via semi-automated thresholding-based segmentation approaches. Visualisation of both AT and TET datasets of volume-rendered pseudocoloured structures of interest was performed within IMOD.
Morphometry and statistical analysis
Quantitative measurements of a range of common morphometric parameters was performed on individual mitochondria using IMOD. Object measures including surface area and volume were obtained using the “imodinfo” script, whilst mitochondrial length and width measurements were obtained manually using the “measure tool”. For each patient, data are reported as means ± S.D. Two-tailed T-tests assuming unequal variance were used to evaluate differences between NM and GM, with the level of significance set at 0.05. Statistical analysis was performed using GraphPad Prism (version 7.02).
3-D Segmentation, visualisation and sampling protocol For 3-D modelling and visualisation, datasets were processed using IMOD a suite of image processing, modelling and display programs used for 3-D reconstruction and segmentation of tomographic data and EM serial sections 69 . For AT datasets, cellular structures of interest were segmented by means of manual tracing of high-contrast lines using 3dmod, a graphical user interface application that is bundled with the IMOD software package 69 . Four cells from each patient were selected (16 cells in total), and each cell was divided into four equal planes (64 planes in total) along the XZ axis. In order to eliminate potential selection bias, all mitochondria intersecting one of the four XY -slicer images—tangential to the four XZ divisions for each cell—was segmented, rendered and classified either as a “normal” or “giant mitochondrion” on the basis of morphological features. For each HPC, the plasma membrane and associated nuclei were also modelled. Of special note, in order to provide a more detailed visual example and morphometric illustration of an entire cell of interest, the total mitochondrial population, intracellular lipid droplets and HPC nuclei were also modelled (patient 4) . For TET datasets, the inner and outer mitochondrial membranes were delineated by means of manual tracing, whilst intramitochondrial crystalline inclusions and enlarged matrix granules were segmented via semi-automated thresholding-based segmentation approaches. Visualisation of both AT and TET datasets of volume-rendered pseudocoloured structures of interest was performed within IMOD.
Supplementary Information Supplementary information 1. Supplementary information 2. Supplementary information 3. Supplementary information 4. Supplementary information 5. Supplementary information 6.
📊 Figures
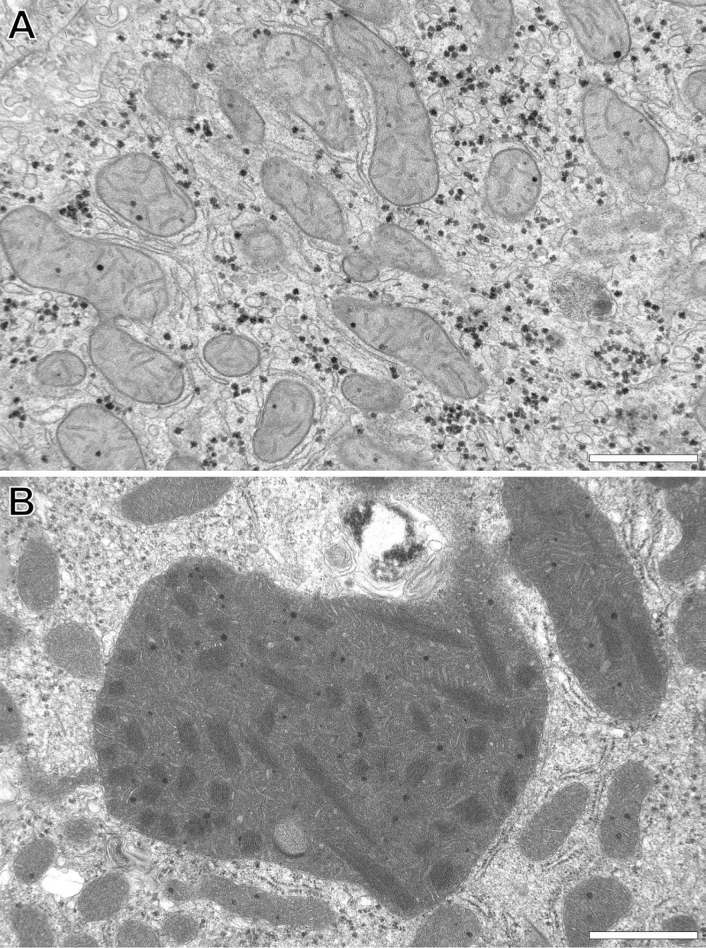
Figure 1
Representative transmission electron microscopy images of human liver parenchymal mitochondria. ( A ) Reveals normal-shaped and -size mitochondria versus ( B ) which shows a giant mitochondrion that i...
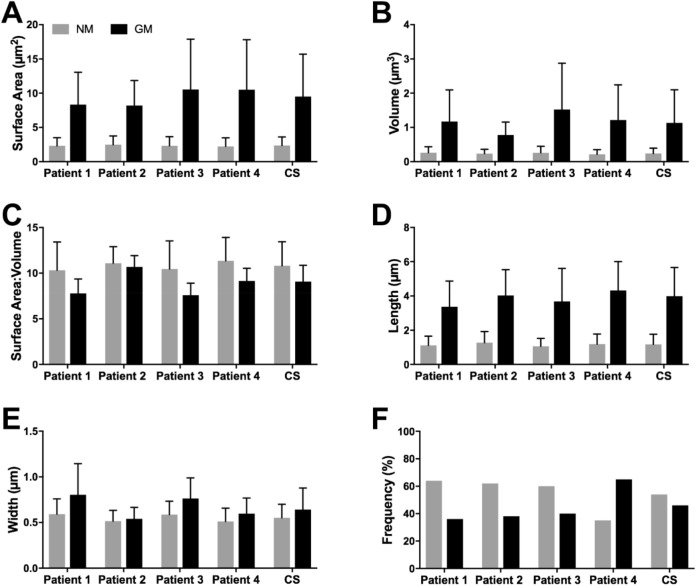
Figure 2
Quantitative comparison of a range of common morphometric parameters obtained from normal- ( n =u20092451) and giant mitochondria ( n =u20092081). ( A ) Mean giant mitochondria surface area (9.51u2009...
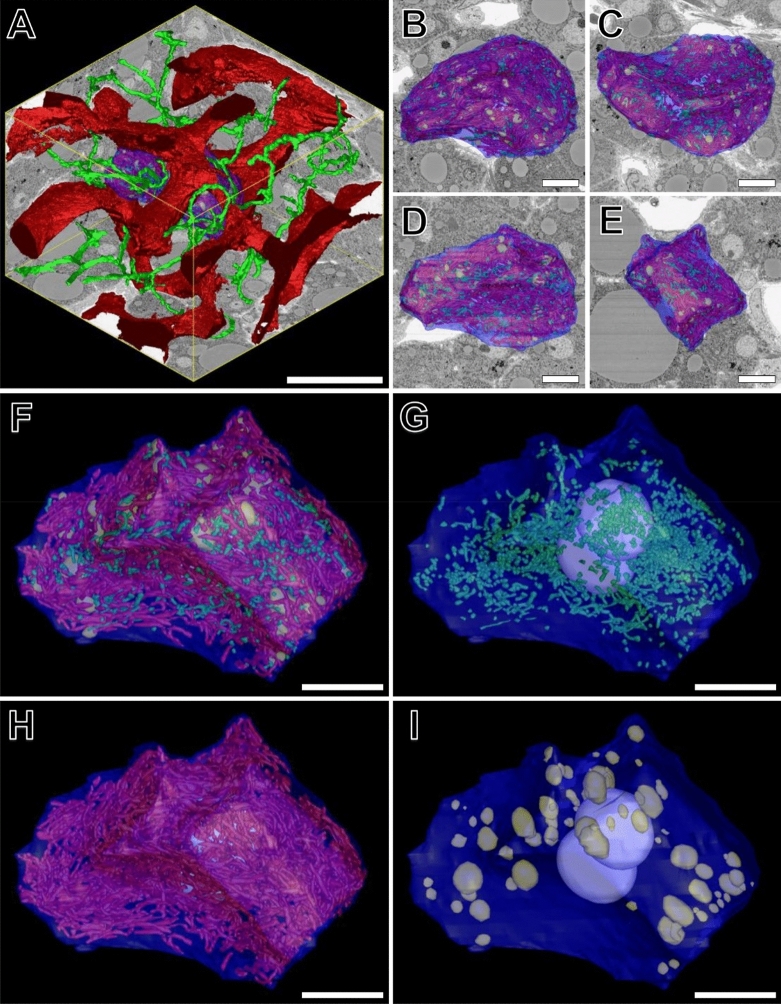
Figure 3
( A ) Reconstructed 3-D volume consisting of 400 consecutive images (section thicknessu2009=u2009150u00a0nm). XY =u200984.82u00a0u00b5m, Z =u200960u00a0u00b5m. Total volumeu2009=u2009453,249u00a0u00b5...
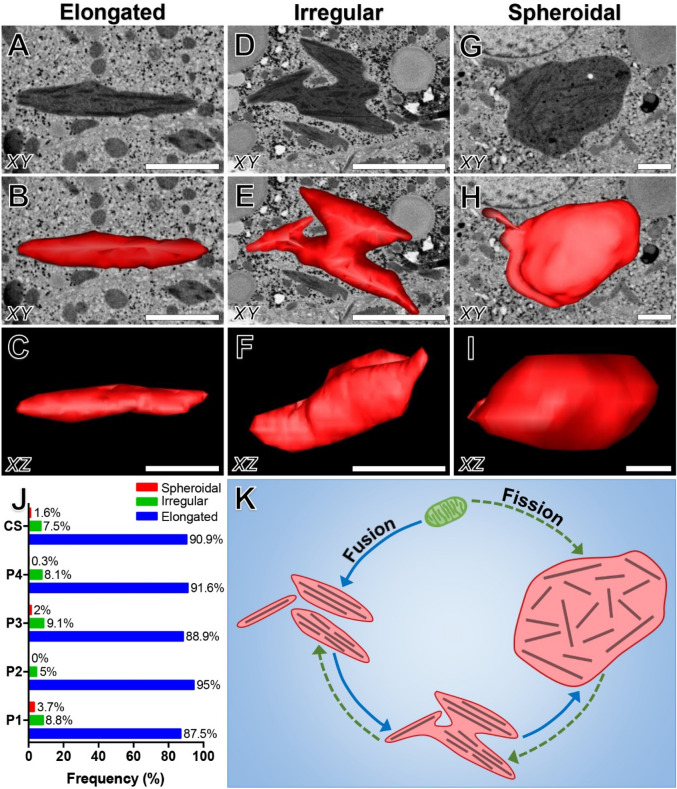
Figure 4
A comparative overview of the three most common giant mitochondria morphologies, and proposed mechanism for their formation. ( Au2013C ) Elongated mitochondria revealing a spindle or rod-shaped morpho...
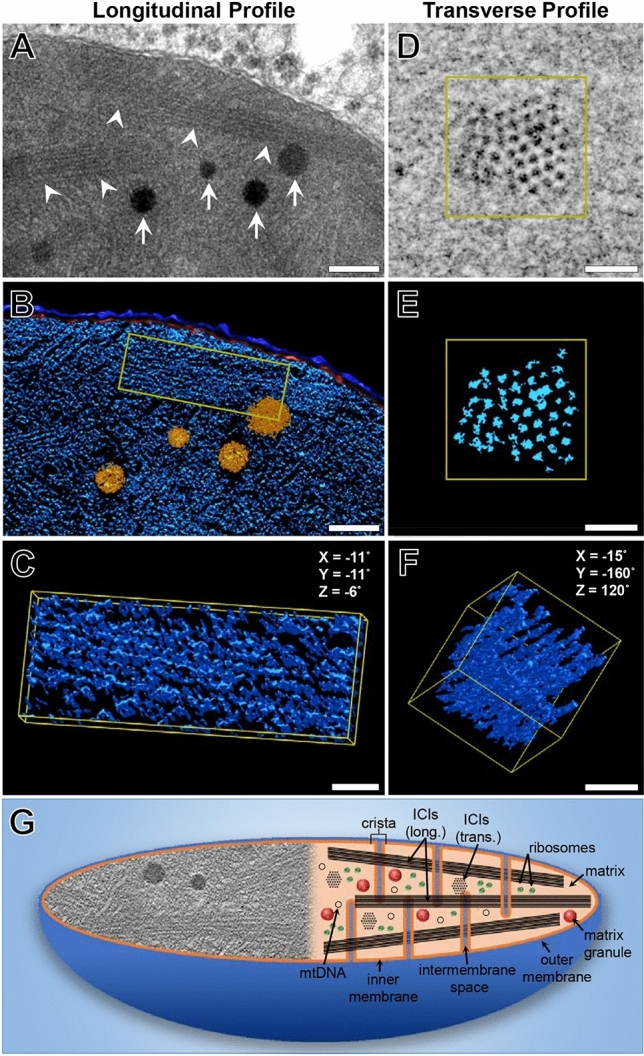
Figure 5
The 3-D structure of intramitochondrial crystalline inclusions (ICIs) and enlarged matrix granules revealed by transmission electron tomography. ( A ) High-magnification image (15,000u00d7u2009magnifi...
Figure images are served from the NIH/NLM PubMed Central Open Access Subset or Europe PMC; copyright remains with the publishers and authors.
💬 Discussion
0 commentsNo comments yet. Be the first to start a discussion!
Leave a Comment