Abstract
AbstractPrevious studies have demonstrated that temporarily increasing the permeability of the blood-brain barrier using focused ultrasound can reduce β-amyloid plaque load and improve cognitive function in animal models of Alzheimer’s disease. However, the underlying mechanism and duration for which the effects of one treatment persists for are unknown. Here, we used in vivo two-photon fluorescence microscopy to track changes in β-amyloid plaque sizes in the TgCRND8 mouse model of Alzheimer’s disease after one focused ultrasound treatment. We found that one treatment reduced plaques to 62 ± 16% (p ≤ 0.001) of their original volume two days post-sonication; this decrease in size persisted for two weeks. We then sought to evaluate the effectiveness of biweekly focused ultrasound treatments using magnetic resonance imaging-guided focused ultrasound treatments. Three to five biweekly treatments resulted in a 27 ± 7% (p ≤ 0.01) decrease in plaque number and 40 ± 10% (p ≤ 0.01) decrease in plaque surface area compared to untreated littermates. This study demonstrates that one focused ultrasound treatment reduces the size of existing β-amyloid plaques for two weeks, and that repeated biweekly focused ultrasound treatments is an effective method of reducing β-amyloid pathology in moderate-to-late stages of Alzheimer’s disease.
🔬 Techniques
🔭 Microscopes
✨ Fluorophores
🧪 Sample Preparation
🏭 Microscope Brands
🧪 Reagent Suppliers
🔴 Lasers
💻 Software Details
🏛️ Research Organizations (ROR)
Affiliated research institutions:
📋 Methods
Experimental design
All analyses were conducted blinded to the genotype and treatment group. Randomization was performed by choosing groups based on position of animal cages on the racks. A table of the two experiments can be found in Supplementary Table S8 .
Animal preparation for all FUS experiments
All procedures were approved by Sunnybrook Research Institute’s Animal Care and Use Committee and conducted in accordance with the guidelines set by the Canadian Council on Animal Care. Since Aβ levels do not differ between male and female TgCRND8 mice 24 , both sexes were used in this study. TgCRND8 mice were used due to the aggressive progression of Ab pathology in this model. For two-photon fluorescence microscopy experiments, a total of nine female 6-month-old TgCRND8 mice were split into FUS-treated (‘Tg FUS’, n = 5) and control (‘Tg CTL’, n = 4) groups. A separate cohort of 42 male and female 7-month-old TgCRND8 mice were used for MRgFUS experiments. Subjects were split into transgenic FUS-treated (‘Tg FUS’, n = 13), transgenic control (‘Tg CTL’, n = 7), non-transgenic FUS-treated (‘nTg FUS’, n = 11), and non-transgenic control (‘nTg CTL’, n = 11) groups. Transgenic animals were preferentially separated into the Tg FUS group in anticipation of experimental difficulties. Timelines for MRgFUS and two-photon fluorescence microscopy experiments are shown in Fig. 1 . Mice were taken out of the study and sacrificed if they met any of the following endpoints: failure to groom, weight loss exceeding 20% of normal body mass, abdominal distention, persistent self-trauma, abnormal locomotion, vocalization, abnormal discharge.
Show full methods section
Experimental design
All analyses were conducted blinded to the genotype and treatment group. Randomization was performed by choosing groups based on position of animal cages on the racks. A table of the two experiments can be found in Supplementary Table S8 .
Animal preparation for all FUS experiments
All procedures were approved by Sunnybrook Research Institute’s Animal Care and Use Committee and conducted in accordance with the guidelines set by the Canadian Council on Animal Care. Since Aβ levels do not differ between male and female TgCRND8 mice 24 , both sexes were used in this study. TgCRND8 mice were used due to the aggressive progression of Ab pathology in this model. For two-photon fluorescence microscopy experiments, a total of nine female 6-month-old TgCRND8 mice were split into FUS-treated (‘Tg FUS’, n = 5) and control (‘Tg CTL’, n = 4) groups. A separate cohort of 42 male and female 7-month-old TgCRND8 mice were used for MRgFUS experiments. Subjects were split into transgenic FUS-treated (‘Tg FUS’, n = 13), transgenic control (‘Tg CTL’, n = 7), non-transgenic FUS-treated (‘nTg FUS’, n = 11), and non-transgenic control (‘nTg CTL’, n = 11) groups. Transgenic animals were preferentially separated into the Tg FUS group in anticipation of experimental difficulties. Timelines for MRgFUS and two-photon fluorescence microscopy experiments are shown in Fig. 1 . Mice were taken out of the study and sacrificed if they met any of the following endpoints: failure to groom, weight loss exceeding 20% of normal body mass, abdominal distention, persistent self-trauma, abnormal locomotion, vocalization, abnormal discharge.
Two-photon fluorescence microscopy FUS experiments
Animal preparation for two-photon fluorescence microscopy experiments
Chronic cranial windows were installed when animals were 6-months-old such that they would be 7-months-old after three to four weeks of recovery 55 . The procedure for creating semi-sterile cranial windows in mice is well described in literature 53 , 55 , 56 . Briefly, animals were anesthetized with 2% isoflurane in a mix of medical air and oxygen. Body temperature was maintained at 37 °C using a rectal probe and heating pad fixed to the stereotaxic frame. All surgical tools, supplies, and drapes were autoclaved within 48 h of surgery. Prior to surgery, animals were administered dexamethasone sodium phosphate (0.2 mg/kg, intramuscular injection) and carprofen (5 mg/kg, intraperitoneal injection) to reduce edema and inflammation, respectively. Fur in the surgical area was removed with depilatory cream, and then cleaned with three alternating swabs of iodopovidone and alcohol. The scalp directly above the skull was removed and the periosteum was pushed back from the skull surface. A circular piece of skull 3–4 mm in diameter was removed from the parietal bone using a dental drill. The dura was left intact. The exposed brain was covered with a circular coverslip (5 mm diameter, # 1 thickness, Warner Instruments, Connecticut, USA), and secured to the skull using cyanoacrylate glue. Animals were recovered under a heat lamp, and given daily doses of carprofen (5 mg/kg), ketoprofen (5 mg/kg), antibiotics (Baytril, Bayer Corps, Kansas, USA), polysporin, and soft foods for three days post-surgery. Animals were given three to four weeks to recover prior to the onset of imaging to allow for the window to clear and inflammation to resolve 52 , 55 .
Two-photon fluorescence microscopy
All imaging was done with the FV1000MPE multiphoton laser scanning microscope (Olympus, Tokyo, Japan) and Ti:Sa laser (MaiTai, Spectra-Physics, Darmstadt, Germany). To visualize dense-core plaques, methoxy-X04 (Tocris, Bio-Techne Corporation, Minneapolis, USA) was injected intraperitoneally 24 h prior to each imaging session (diluted in 10% DMSO, 45% propylene glycol, 45% saline; delivered 5 mg/kg) 26 . To visualize blood vessels, 70 kDa Texas Red dextran (Invitrogen, Burlington, Canada; dissolved in PBS; 5 mg/kg) was injected intravenously through a tail vein. Two excitation wavelengths were used: 750 nm for methoxy-X04 26 , and 900 nm for Texas Red (Tg FUS: 14.1 ± 11.9 mW, Tg CTL: 6.81 ± 3.29 mW, mean ± SD; see Supplementary Methods for all laser powers used). Texas Red was only injected on the first day of imaging (day 0). On the first day of imaging (day 0), a water-immersion objective with 40× magnification power was used (LUMPLFLN 40×, NA: 0.80, Olympus, Tokyo, Japan). The objective lens was aligned with the center of the ring transducer. To observe blood vessel dynamics during sonication, XYZT stacks were collected. The following imaging parameters were used: 512 × 512 pixels (XY), 0.310 μm/pixel, 5 μm step-size for 250–300 μm total (Z), 12.5 μs/pixel. On subsequent experiment days, a water-immersion objective with 25× magnification power was used (XLPLN 25×, NA: 1.05; Olympus, Tokyo, Japan). Only images of plaques were collected. XYZ-stacks of plaques were acquired at a higher zoom: 512 × 512 pixels (XY), 0.310 μm/pixel or 0.331 μm/pixel, 2 μm step-size for 40–200 μm total (Z), 12.5 μs/pixel. An average of ten plaques were imaged per animal. XYZ-stacks of every plaque were obtained on day 0 (FUS treatment) and subsequently on days 2, 4, 7, 10, 12, 14, and 21. Tg FUS mice were only given FUS treatment once (day 0). Focused ultrasound treatments in two-photon microscopy experiments For FUS treatments, a PZT-4 cylindrical transducer (10 mm diameter, 1.5 mm thickness, 1.1 mm height) was driven at 1.1 MHz in thickness mode, producing a circular focal spot 57 . The depth of field of this transducer is 1 mm beneath the coverslip. The transducer was controlled by a function generator (Agilent, Palo Alto, CA, USA) and a 53 dB RF power amplifier (NP Technologies, Inc., Newbury Park, CA, USA); forward and reflected RF powers were measured using a power meter built in-house (Supplementary Fig. S9 ). On the first day of imaging (day 0), the ring transducer was mounted onto the cranial window. Both Tg FUS and Tg CTL animals were given an injection of Definity microbubble (MB) contrast agent (Lantheus Medical Imaging, North Billerica, MA), diluted 1:10 in saline (v/v), and delivered at a dose of 0.04 mL/kg 46 . Immediately after MB injection, Tg FUS animals were sonicated using the following FUS parameters: 10 ms pulse duration, 1 Hz pulse repetition frequency, 120 s total sonication duration, with estimated in situ pressures of 0.4–0.8 MPa 46 , 58 , 59 . The transducer was disconnected from the amplifier for Tg CTL animals. Successful FUS treatment was determined by the leakage of fluorescent dextran from blood vessels into the extravascular space, indicating increased BBB permeability.
Image processing
Two-photon fluorescence images were analyzed using a MATLAB script (MATLAB and Statistics Toolbox Release 2015, The MathWorks, Inc., Natick, MA, USA) written in-house (script available upon request). User input was limited to selecting the ROI containing the plaque in each image stack, thereby minimizing user bias. Our image processing algorithm involved five main steps: (1) importing image stack, (2) identifying ROI, (3) iterative thresholding 60 , (4) defragmenting, (5) computing volume (Supplementary Fig. S10 ). The only step that required user input was the selection of a ROI containing the plaque. In the thresholding step, we used an iterative thresholding process 60 to binarize the image stack into ‘foreground’ and ‘background’ pixels. In the defragmenting step, the foreground was filtered to isolate the pixels that were part of the plaque by evaluating if a sufficient number of neighbouring pixels were also ‘foreground’ pixels. Finally, the plaque volume and maximum cross-sectional area were calculated by counting the number of filled pixels surrounding the seed pixel that shared a face with a counted pixel (Supplementary Fig. S10 ). To determine if the rate of change in plaque size differentially affected larger or smaller plaques, plaques were binned as ‘larger’ or ‘smaller’ based on the median plaque volume in each dataset.
Statistical analysis
Statistical analyses were performed using GraphPad Prism (Prism version 7.03 for Windows, GraphPad Software, La Jolla California USA). To evaluate changes in plaque volume and maximum cross-sectional area, measurements obtained on days 2, 4, 7, 10, 12, 14, and 21 were normalized to measurements obtained on day 0 and expressed as a percentage. A one-way ANOVA and Holm-Sidak multiple comparisons test was used to compare differences in plaque size at every imaging day relative to that on day 0 (α = 0.05). A t-test was used to compare rates of change in plaque size between larger and smaller plaques. MR-guided FUS experiments Animal preparation for MR-guided FUS experiments Prior to every FUS treatment, mice were anesthetized using 5% isoflurane in medical air 61 – 63 . Once a sufficient plane of anesthesia was achieved, mice were weighed and maintained at 2% isoflurane. A 27-gauge catheter was inserted into a tail vein for intravenous access. Since air bubbles in the fur will obstruct the propagation of ultrasound, all fur on the head was removed using depilatory cream.
Magnetic resonance-guided FUS treatments
Magnetic resonance-guided FUS (MRgFUS) treatments were performed using the RK100 system (FUS Instruments, Toronto, Canada), consisting of a spherically curved focused transducer driven at 1.68 MHz (75 mm diameter, 60 mm ROC), which generated a focal spot 0.73 mm × 4.5 mm in the lateral and axial planes, respectively 17 . The following sonication parameters for BBB treatment were used: 10 ms bursts, 1 Hz burst repetition frequency, lasting 120 s in total 12 , 15 – 17 , 64 . Acoustic emissions were received by a polyvinylidene difluoride hydrophone located in the center of the transducer. The spatial coordinates of the RK100 were co-registered to that of the 7T MRI scanner (BioSpin 7030; Bruker, Billerica, MA) (Supplementary Fig. S9 ). Anesthetized mice were placed supine on a MRI-compatible sled made in-house. The head was coupled to a water-bath with ultrasound gel. T2-weighted images (TR = 2000/TE = 60) were acquired to visualize the brain anatomy for targeting purposes, and T1-weighted images were acquired (TR = 500/TE = 10) pre- and post-sonication to assess BBB permeability (Fig. 1 ). Four target spots, two per hemisphere, were chosen along the dorsal hippocampus, since it is considered to be equivalent to the posterior hippocampus in humans and important in memory systems affected in AD 65 . Animals were given an intravenous dose of Definity microbubble (MB) contrast agent (Lantheus Medical Imaging, North Billerica, MA), diluted 1:10 (v/v) in saline, at a dose of 0.02 mL/kg, prior to sonication. During sonication, forward and reflected power levels were recorded using a power meter. Acoustic pressures were incrementally increased by 0.025 MPa every burst until subharmonic emissions from microbubbles reached a threshold of 3.5 times the magnitude of background signals, at which point acoustic pressure was automatically reduced by 50% and maintained for the remainder of the sonication duration 48 . After sonication, Gadovist, a gadolinium-based contrast agent (diluted 1:50 in saline (v/v), 0.1 mL/kg of animal mass) was administered intravenously, and a T1-weighted image was acquired to confirm increased BBB permeability. Control animals received weight-equivalent doses of MBs and gadolinium contrast agent and spent equal time anesthetized in the MR, but were not exposed to FUS.
Evaluation of BBB permeability in T1w MRIs
BBB permeability was assessed by finding the relative enhancement of the treatment spots to untreated regions in the brain in post-sonication T1-weighted images. The pixel intensity of a 3 × 3 pixel area was measured for each of the four targeted spots, and the mean intensity value for all four targets was calculated. Relative enhancement was calculated by finding the ratio of this value to the mean intensity of the background, which was an untargeted area in the brain in the same image.
Tissue processing for MRgFUS experiments
Animals were anesthetized with intramuscular injections of a ketamine-xylazine cocktail (2:1) and perfused intracardially with ice-cold saline and 4% paraformaldehyde. Brains were removed and immersed in 4% paraformaldehyde at 4 °C overnight, cryoprotected with 30% sucrose immersion and 0.1% sodium azide at 4 °C overnight, embedded in OCT (Sakura Finetek, VWR, PA, USA), and stored at −80 °C. Brains were cryosectioned into 40 μm thick coronal sections, and kept in cryoprotectant (20% glycerin, 30% ethylene glycol, 50% 0.1 M phosphate buffer) at −10 °C. One in four serial sections were used for immunohistochemical analysis of plaques. Mouse anti-6F3D antibody (1:200, Dako, Glostrup, Denmark) and donkey anti-mouse Alexa Fluor 555 (1:200; Invitrogen, Ontario, Canada) were used to fluorescently label Aβ plaques. Stereological plaque analysis for MRgFUS experiments Stereological Aβ plaque analysis was conducted using StereoInvestigator software (MBF Bioscience, Vermont, USA). Anatomical boundaries of the dorsal hippocampus were defined by the boundaries of the alveus, third ventricle, and thalamus. The 5× objective was used for contour tracing, and the 20× objective was used for counting plaques. Two stereological probes were used: the optical fractionator probe to count the number of plaques, and the nucleator probe to measure the maximum cross-sectional area of counted plaques. A pilot study was first conducted to determine appropriate stereological parameters for both probes. The following parameters were used for the optical fractionator: counting frame area = 200 × 200 μm, sampling grid area = 500 × 500 μm, optical disector height = 20 μm, guard zone height = 2 μm, and section sampling frame = 1/4. The average coefficient of error (CE Schmitz-Hof) was 0.27 and 0.24 for the estimations of the number of plaques for Tg FUS and Tg CTL mice, respectively. Only plaques that were entirely contained within the section were counted. For each counted plaque, its maximum cross-sectional area was measured by marking its boundaries on four rays that radiated from the center of the plaque. Brain surface area covered by Aβ plaques, or plaque surface area, per section was determined by finding the product of the average number of plaques (optical fractionator) and the corresponding maximum cross-sectional area (nucleator).
Statistical analysis
Statistical analyses were performed using GraphPad Prism (Prism version 7.03 for Windows, GraphPad Software, La Jolla California USA). To evaluate animal mortality, two Fisher’s exact tests with genotype (Tg vs nTg) or treatment (FUS vs CTL) as the nominal variables were used. To evaluate weight fluctuation, a two-way ANOVA with ‘Group’ and ‘Treatment Number’ as the two independent variables was used. For comparison of post-sonication T1-weighted contrast enhanced images, an unpaired t -test was used. For comparison of plaque number, area, and surface area, an unpaired two-tailed t -test was used to evaluate Tg FUS and Tg CTL groups.
Experimental design
All analyses were conducted blinded to the genotype and treatment group. Randomization was performed by choosing groups based on position of animal cages on the racks. A table of the two experiments can be found in Supplementary Table S8 .
Electronic supplementary material Supplementary Figures Supplementary Materials
Electronic supplementary material Supplementary information accompanies this paper at 10.1038/s41598-018-32250-3.
📊 Figures
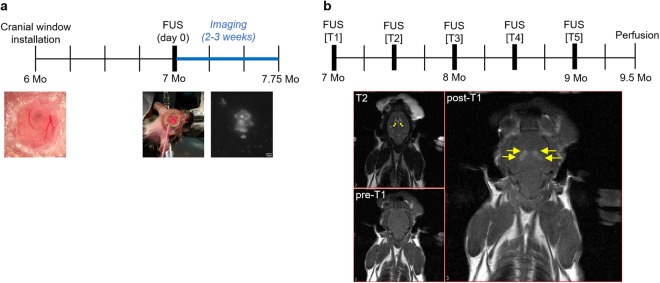
Figure 1
Timelines of two-photon fluorescence microscopy and MR-guided FUS experiments. Two-photon fluorescence microscopy FUS experiments. ( a ) Cranial windows were installed in the parietal bone when mice w...

Figure 2
Confirmation of FUS treatment in two-photon microscopy experiments. Maximum projection images of XYZ image stacks are shown. FUS-mediated increases in BBB permeability can be observed by the leakage o...
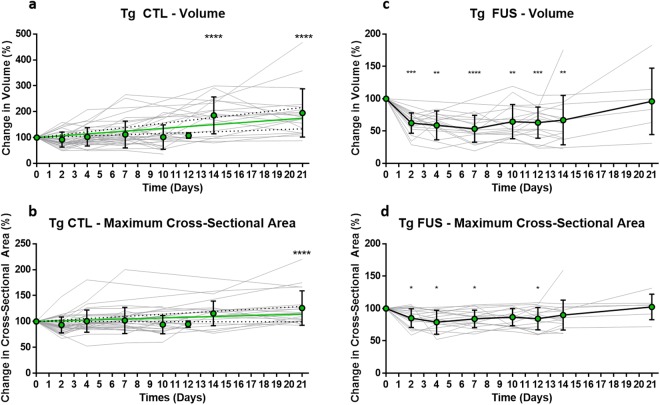
Figure 3
Changes in plaque volume in Tg CTL and Tg FUS animals over three weeks. Plaque volumes of 7-month-old Tg mice were assessed by taking depth-stacks on day 0, 2, 4, 7, 10, 12, 14, and 21, and normalizin...
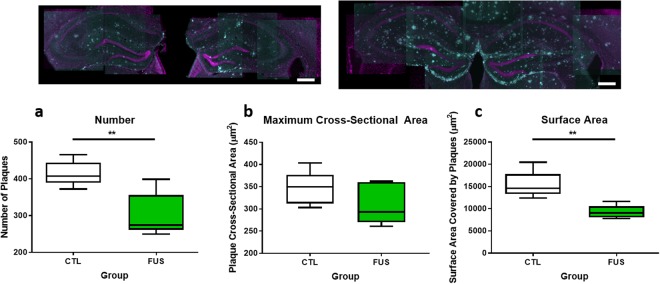
Figure 4
Boxplots showing comparisons of plaque number and surface area between Tg FUS and Tg CTL animals. Top : Representative maximum projection images of hippocampi in Tg FUS (left) and Tg CTL (right) anima...
Figure images are served from the NIH/NLM PubMed Central Open Access Subset or Europe PMC; copyright remains with the publishers and authors.
💬 Discussion
0 commentsNo comments yet. Be the first to start a discussion!
Leave a Comment