Abstract
AbstracteEF1A2 is one of the isoforms of the alpha subunit of the eukaryotic Elongation Factor 1. It is overexpressed in human tumors and is endowed with oncogenic properties, favoring tumor cell proliferation while inhibiting apoptosis. We demonstrate that plitidepsin, an antitumor agent of marine origin that has successfully completed a phase-III clinical trial for multiple myeloma, exerts its antitumor activity by targeting eEF1A2. The drug interacts with eEF1A2 with aKDof 80 nM and a target residence time of circa 9 min. This protein was also identified as capable of binding [14C]-plitidepsin in a cell lysate from K-562 tumor cells. A molecular modelling approach was used to identify a favorable binding site for plitidepsin at the interface between domains 1 and 2 of eEF1A2 in the GTP conformation. Three tumor cell lines selected for at least 100-fold more resistance to plitidepsin than their respective parental cells showed reduced levels of eEF1A2 protein. Ectopic expression of eEF1A2 in resistant cells restored the sensitivity to plitidepsin. FLIM-phasor FRET experiments demonstrated that plitidepsin localizes in tumor cells sufficiently close to eEF1A2 as to suggest the formation of drug-protein complexes in living cells. Altogether, our results strongly suggest that eEF1A2 is the primary target of plitidepsin.
🔬 Techniques
🔭 Microscopes
💻 Software
✨ Fluorophores
🧪 Sample Preparation
🔬 Cell Lines
🏭 Microscope Brands
🧪 Reagent Suppliers
📷 Detectors
🎨 Filters
💻 Software Details
💾 Data Repositories
🏛️ Research Organizations (ROR)
Affiliated research institutions:
📋 Methods
Reagents Plitidepsin (C 57 H 87 N 7 O 15 , MW:1109.6, CAS No. 137219-37-5, APL), [ 14 C]-plitidepsin (1.73 GBq/mmol), and a fluorescent coumarinated plitidepsin derivative (plitidepsin-DMAC) were prepared by PharmaMar (Colmenar Viejo, Spain). Stock solutions (1 mg/ml in DMSO) were prepared and stored at −20 °C. Complete (protease) and PhosStop (phosphatase) inhibitor cocktails were purchased from Roche Diagnostics (Mannheim, Germany). Anti-phospho-JNK (Thr183/Tyr185), anti-phospho-ERK1/2 (Thr202/Tyr204) and anti-phospho-p38 (Thr180/Tyr182) antibodies were purchased from Cell Signaling Technologies, Inc (Beverly, MA, USA). Anti-eEF1A and secondary HRP-conjugated goat anti-rabbit and goat anti-mouse antibodies were purchased from Santa Cruz Biotechnology (Santa Cruz, CA, USA). Anti-eEF1A2 (GTX102326) antibody was purchased from GeneTex (Irving, CA, USA). Anti-α-Tubulin (#T5168) antibody and subtilisin (EC 3.4.21.62) were purchased from Sigma-Aldrich, Inc. (St. Louis, MO, USA). A plasmid encoding eEF1A2-GFP (RG210716) was purchased from Origene (Rockville, MD, USA). Chromatography media (DEAE FF 16/10, SP HiPrep 16/10 and Superdex 200 16/600 columns) were obtained from GE Healthcare (Buckinghamshire, UK). All other reagents were from Sigma (St Louis, MO, USA). Cell techniques HeLa cervix adenocarcinoma (ATCC CCL-2), K-562 chronic myelogenous leukemia (ATCC CCL-243), NCI-H460 lung cancer (ATCC HTB-177) and HGC27 gastric cancer (ATCC CRL-2506) cells were obtained from ATCC (Manassas, VA, USA) and cultured following standard procedures. Viability assays were performed utilizing 3-(4,5-dimethylthiazol-2-yl)-2,5-diphenyltetrazolium bromide (MTT) according to methods described elsewhere 46 . The stably plitidepsin-resistant HeLa cell subline (HeLa-APL-R) was generated at PharmaMar as previously described 11 and the same protocol was used to generate other plitidepsin-resistant cell lines. For transfection and selection of cell clones, HeLa and HeLa-APL-R cells were seeded in 24 well plates at 40% confluence and allowed to stand for 24 hours at 37 °C and 5% CO 2 . Before transfection, the culture medium was changed to Opti-MEM (Life Technologies, Carlsbad, CA, USA). Plasmids encoding eEF1A2-GFP were incubated with Lipofectamine (Life Technologies, Carlsbad, CA, USA) under the recommendations of the manufacturer and added to the cell medium. After 24 h incubation at 37 °C and 5% CO 2 , the culture medium was replaced by the standard DMEM supplemented with 2 mg/ml of G-418 for the selection of clones expressing the exogenous gene. Clones were further selected following the expression of the GFP-fused protein through fluorescence microscopy. Differential gene expression through DNA array Total RNA was obtained from four samples of each HeLa and HeLa-APL-R cells with TRIzol reagent (Life technologies) under the recommendations of the manufacturer. Once purified, 15 μg RNA from each sample were reverse transcribed with a T7-Oligo(dT) promoter primer in the first-strand cDNA synthesis reaction, as indicated in the GeneChip One-Cycle Target Labeling Kit protocol (Affymetrix, Santa Clara, CA, USA). Second strand cDNA was then synthesized after eliminating the mRNA chain with RNase H. The double-stranded cDNA was then purified and served as the template for an in vitro transcription reaction in the presence of T7 RNA Polymerase and a biotinylated nucleotide analog/ribonucleotide mix for complementary RNA (cRNA) amplification and biotin labeling. The biotinylated cRNA targets were then cleaned up, fragmented, and hybridized to Human Genome U133A Arrays (Affymetrix, Santa Clara, CA, USA) during 16 h, using the GeneChip Hybridization, Wash and Stain Kit (Affymetrix, Santa Clara, CA, USA) following the manufacturer’s instructions. Then, arrays were washed and stained using the Fluidics Station 400 (Affymetrix, Santa Clara, CA, USA). Finally, arrays were scanned with a GeneChip Scanner 3000 (Affymetrix, Santa Clara, CA, USA). Data were subjected to quantile normalization to make them identical in statistical properties. Significance analysis of microarrays (SAM) was then applied to obtain the probe sets differentially expressed between HeLa and HeLa APL-R cells, establishing a Delta of 1.4 that gave a false discovery rate of 0.111. Tumor model gene expression profiles were analyzed by using Affymetrix U133 plus 2.0 arrays. The hybridizations were normalized by using the gc robust multichip averaging method from Bioconductor. eEF1A2 mRNA expression levels were determined by probe set “204540_at”. Isobaric Tag for Relative and Absolute Quantitation (iTRAQ) of differential protein expression Protein extracts were obtained from HeLa and HeLa APL-R cells with lysis buffer (20 mM Tris-HCl (pH 7.5), 150 mM NaCl, 1% (v/v) Nonidet P-40, 2 mM EDTA, Complete and PhosStop cocktails) and kept on ice for 15 min. Cell extracts were cleared by centrifugation at 14,000 × g for 30 min at 4 °C. Proteins were then precipitated with trichloroacetic acid/acetone, washed with 6 volumes of acetone at −20 °C and dissolved in 100 μL of 0.5 M triethylammonium bicarbonate (TEAB) pH 8, 8 M urea. Protein was quantitated through the Bradford method and 110 μg of each sample were diluted up to 40 μL with of 0.5 M TEAB pH 8. Samples were reduced with 5 mM tris-(2-carboxyethyl)phosphine (TCEP) at 60 °C for 1 h and the cysteine-groups blocked with 10 mM methyl methanethiosulfonate (MMTS) at room temperature for 10 min. Samples were then diluted with 0.5 M TEAB pH 8 to bring the urea concentration below 2 M and digested with 10 μg of trypsin (Promega, Madison, WI, USA) at 37 °C overnight. Peptides were dried in the SpeedVac (Thermo Fisher Scientific, Waltham, MA, USA) and labeled with iTRAQ 8 plex, 3 h at room temperature after the protocol of AB SCIEX (Framingham, MA, USA). Samples were then pooled and 440 μg of protein subjected to IEF in a 13 cm Immobiline DryStrip pH 3-10NL (GE Healthcare, Piscataway, NJ, USA). The strip was then washed with water and cut into 25 pieces of 0.5 cm. Peptides from each of the pieces were then extracted, dried and suspended in 15 μL of 5% acetonitrile, 0.1% trifluoroacetic acid. A first chromatography was performed in an ETTAN LC (GE Healthcare, Piscataway, NJ, USA) with a reverse phase column Phenomenex Gemini 3 μm C18 110 Å. Samples were loaded in Buffer A, 20 mM triethanolamine in H 2 O, and eluted with a gradient of buffer B, 20 mM triethanolamine in acetonitrile, from 5 to 45%, at a flow rate of 150 nL/min. Fractions were collected and acidified. For the HPLC/MS/MS analysis, samples were loaded onto an Dionex PepMap C18 3 μm 100 Å column in buffer A, 0.1% formic acid in H 2 O, and eluted with a gradient from 5 to 90% of buffer B, 95% acetonitrile 0.1% formic acid, through a QSTAR ESI-QTOF (Life Technologies, Carlsbad, CA, USA). The combined information of the MS/MS was processed in MASCOT through the software Mascot Daemon (Matrix Science, Boston, MA, USA), using the database Sprot 20090603.
Show full methods section
Reagents Plitidepsin (C 57 H 87 N 7 O 15 , MW:1109.6, CAS No. 137219-37-5, APL), [ 14 C]-plitidepsin (1.73 GBq/mmol), and a fluorescent coumarinated plitidepsin derivative (plitidepsin-DMAC) were prepared by PharmaMar (Colmenar Viejo, Spain). Stock solutions (1 mg/ml in DMSO) were prepared and stored at −20 °C. Complete (protease) and PhosStop (phosphatase) inhibitor cocktails were purchased from Roche Diagnostics (Mannheim, Germany). Anti-phospho-JNK (Thr183/Tyr185), anti-phospho-ERK1/2 (Thr202/Tyr204) and anti-phospho-p38 (Thr180/Tyr182) antibodies were purchased from Cell Signaling Technologies, Inc (Beverly, MA, USA). Anti-eEF1A and secondary HRP-conjugated goat anti-rabbit and goat anti-mouse antibodies were purchased from Santa Cruz Biotechnology (Santa Cruz, CA, USA). Anti-eEF1A2 (GTX102326) antibody was purchased from GeneTex (Irving, CA, USA). Anti-α-Tubulin (#T5168) antibody and subtilisin (EC 3.4.21.62) were purchased from Sigma-Aldrich, Inc. (St. Louis, MO, USA). A plasmid encoding eEF1A2-GFP (RG210716) was purchased from Origene (Rockville, MD, USA). Chromatography media (DEAE FF 16/10, SP HiPrep 16/10 and Superdex 200 16/600 columns) were obtained from GE Healthcare (Buckinghamshire, UK). All other reagents were from Sigma (St Louis, MO, USA). Cell techniques HeLa cervix adenocarcinoma (ATCC CCL-2), K-562 chronic myelogenous leukemia (ATCC CCL-243), NCI-H460 lung cancer (ATCC HTB-177) and HGC27 gastric cancer (ATCC CRL-2506) cells were obtained from ATCC (Manassas, VA, USA) and cultured following standard procedures. Viability assays were performed utilizing 3-(4,5-dimethylthiazol-2-yl)-2,5-diphenyltetrazolium bromide (MTT) according to methods described elsewhere 46 . The stably plitidepsin-resistant HeLa cell subline (HeLa-APL-R) was generated at PharmaMar as previously described 11 and the same protocol was used to generate other plitidepsin-resistant cell lines. For transfection and selection of cell clones, HeLa and HeLa-APL-R cells were seeded in 24 well plates at 40% confluence and allowed to stand for 24 hours at 37 °C and 5% CO 2 . Before transfection, the culture medium was changed to Opti-MEM (Life Technologies, Carlsbad, CA, USA). Plasmids encoding eEF1A2-GFP were incubated with Lipofectamine (Life Technologies, Carlsbad, CA, USA) under the recommendations of the manufacturer and added to the cell medium. After 24 h incubation at 37 °C and 5% CO 2 , the culture medium was replaced by the standard DMEM supplemented with 2 mg/ml of G-418 for the selection of clones expressing the exogenous gene. Clones were further selected following the expression of the GFP-fused protein through fluorescence microscopy. Differential gene expression through DNA array Total RNA was obtained from four samples of each HeLa and HeLa-APL-R cells with TRIzol reagent (Life technologies) under the recommendations of the manufacturer. Once purified, 15 μg RNA from each sample were reverse transcribed with a T7-Oligo(dT) promoter primer in the first-strand cDNA synthesis reaction, as indicated in the GeneChip One-Cycle Target Labeling Kit protocol (Affymetrix, Santa Clara, CA, USA). Second strand cDNA was then synthesized after eliminating the mRNA chain with RNase H. The double-stranded cDNA was then purified and served as the template for an in vitro transcription reaction in the presence of T7 RNA Polymerase and a biotinylated nucleotide analog/ribonucleotide mix for complementary RNA (cRNA) amplification and biotin labeling. The biotinylated cRNA targets were then cleaned up, fragmented, and hybridized to Human Genome U133A Arrays (Affymetrix, Santa Clara, CA, USA) during 16 h, using the GeneChip Hybridization, Wash and Stain Kit (Affymetrix, Santa Clara, CA, USA) following the manufacturer’s instructions. Then, arrays were washed and stained using the Fluidics Station 400 (Affymetrix, Santa Clara, CA, USA). Finally, arrays were scanned with a GeneChip Scanner 3000 (Affymetrix, Santa Clara, CA, USA). Data were subjected to quantile normalization to make them identical in statistical properties. Significance analysis of microarrays (SAM) was then applied to obtain the probe sets differentially expressed between HeLa and HeLa APL-R cells, establishing a Delta of 1.4 that gave a false discovery rate of 0.111. Tumor model gene expression profiles were analyzed by using Affymetrix U133 plus 2.0 arrays. The hybridizations were normalized by using the gc robust multichip averaging method from Bioconductor. eEF1A2 mRNA expression levels were determined by probe set “204540_at”. Isobaric Tag for Relative and Absolute Quantitation (iTRAQ) of differential protein expression Protein extracts were obtained from HeLa and HeLa APL-R cells with lysis buffer (20 mM Tris-HCl (pH 7.5), 150 mM NaCl, 1% (v/v) Nonidet P-40, 2 mM EDTA, Complete and PhosStop cocktails) and kept on ice for 15 min. Cell extracts were cleared by centrifugation at 14,000 × g for 30 min at 4 °C. Proteins were then precipitated with trichloroacetic acid/acetone, washed with 6 volumes of acetone at −20 °C and dissolved in 100 μL of 0.5 M triethylammonium bicarbonate (TEAB) pH 8, 8 M urea. Protein was quantitated through the Bradford method and 110 μg of each sample were diluted up to 40 μL with of 0.5 M TEAB pH 8. Samples were reduced with 5 mM tris-(2-carboxyethyl)phosphine (TCEP) at 60 °C for 1 h and the cysteine-groups blocked with 10 mM methyl methanethiosulfonate (MMTS) at room temperature for 10 min. Samples were then diluted with 0.5 M TEAB pH 8 to bring the urea concentration below 2 M and digested with 10 μg of trypsin (Promega, Madison, WI, USA) at 37 °C overnight. Peptides were dried in the SpeedVac (Thermo Fisher Scientific, Waltham, MA, USA) and labeled with iTRAQ 8 plex, 3 h at room temperature after the protocol of AB SCIEX (Framingham, MA, USA). Samples were then pooled and 440 μg of protein subjected to IEF in a 13 cm Immobiline DryStrip pH 3-10NL (GE Healthcare, Piscataway, NJ, USA). The strip was then washed with water and cut into 25 pieces of 0.5 cm. Peptides from each of the pieces were then extracted, dried and suspended in 15 μL of 5% acetonitrile, 0.1% trifluoroacetic acid. A first chromatography was performed in an ETTAN LC (GE Healthcare, Piscataway, NJ, USA) with a reverse phase column Phenomenex Gemini 3 μm C18 110 Å. Samples were loaded in Buffer A, 20 mM triethanolamine in H 2 O, and eluted with a gradient of buffer B, 20 mM triethanolamine in acetonitrile, from 5 to 45%, at a flow rate of 150 nL/min. Fractions were collected and acidified. For the HPLC/MS/MS analysis, samples were loaded onto an Dionex PepMap C18 3 μm 100 Å column in buffer A, 0.1% formic acid in H 2 O, and eluted with a gradient from 5 to 90% of buffer B, 95% acetonitrile 0.1% formic acid, through a QSTAR ESI-QTOF (Life Technologies, Carlsbad, CA, USA). The combined information of the MS/MS was processed in MASCOT through the software Mascot Daemon (Matrix Science, Boston, MA, USA), using the database Sprot 20090603.
DARTS assay
Protein extracts from HeLa cells were obtained by treating them with lysis buffer (see above) and kept on ice for 15 min. Cell extracts were cleared by centrifugation at 14,000 × g for 15 min at 4 °C. Protein extracts were then incubated with plitidepsin at the indicated concentrations for 1 h. Extracts were digested with the indicated concentrations of Subtilisin (EC 3.4.21.62) for 30 min at RT. Samples were resolved by SDS-PAGE and the degradation of eEF1A2 analyzed by Western blot. Quantitation of the eEF1A2 bands was performed with the Image Lab v5.2.1 software (Bio-Rad, Hercules, CA, USA). eEF1A2 purification and cellular fractionation eEF1A2 was purified from rabbit muscle following the procedure described by Yaremchuk et al . 47 . The eEF1A2 concentration was determined spectrophotometrically using ε 280 45,380 M −1 cm −1 as deduced from its amino acid sequence (Swiss-Prot Q71V39 ). Regarding cellular fractionation, K-562 cells were grown in 10 L of DMEM medium supplemented with 10% (v/v) FBS, 100 units/mL penicillin, 0.1 mg/mL streptomycin, 1% (v/v) pluronic acid and 2 mM L-glutamine in a Wave bioreactor (GE Healthcare, Buckinghamshire, UK). When the culture reached a density of 1.5E6 cells/mL cells were harvested, washed twice with ice-cold PBS, and homogenized: typically 30 g of cell pellet was used for fractionation experiments. The resulting cell lysate was centrifuged at 1,000 × g for 10 min, the supernatant centrifuged again at 10,000 × g for 20 min and the newly obtained supernatant was finally centrifuged at 100,000 × g for 60 min. Pellets were resuspended in the same homogenization buffer using 1/20 of the volume of the original sample, and aliquots from the supernatants were withdrawn for analysis in binding assays. The soluble fraction resulting from the last centrifugation was equilibrated in 30 mM potassium phosphate pH 7,5; 1 mM magnesium chloride; 15% (v/v) glycerol and 6 mM β-mercaptoethanol, using a Sephadex G-25 column and it was then processed through several chromatographic steps similar to those followed during eEF1A2 purification, as detailed in the “Results” section. 4 mL fractions were collected and their ability to bind [ 14 C]-plitidepsin was determined as described below.
Binding assays
All samples in binding assays were tested in triplicate. For the saturation binding experiment, 100 nM rabbit eEF1A2 was mixed with several concentrations of [ 14 C]-plitidepsin (ranging from 0.1 to 4 μM) in 45 mM Hepes-KOH pH 7.5, 5 mM magnesium acetate, 75 mM potassium chloride, 1 mM DL-dithiothreitol and 5% (v/v) DMSO in the presence of 1 μM Gpp(NH)p in a final volume of 500 μL. After 1 h incubation at room temperature, 450 μL were withdrawn, filtered through GF/C filters (Millipore, Bedford, CA) and washed three times with the same buffer used for the incubation. Filters were then removed, dried and their radioactivity was finally counted as a measurement of total (specific and non-specific) bound drug. An aliquot from each of the [ 14 C]-plitidepsin solutions used to prepare each sample was counted in triplicate to determine the actual amount of total radioligand present in each case and such value was considered for data processing. Scintillation counting was transformed into concentration values considering the specific activity of the radioligand and the sample volume. The concentration of bound radioligand was related to the total amount of radioligand in the sample using the expression derived by Swillens 12 to account for ligand depletion when the concentration of protein was similar to that of radioligand: where B T is the concentration of total (specific and non-specific) bound plitidepsin, L T is the total concentration of plitidepsin in the sample, K D is the dissociation constant, B max is the maximum amount of drug bound to the protein and α is a parameter corresponding to the ratio between non-specifically bound ligand and free ligand (which in fact accounts for the dependency of non-specific binding with ligand concentration). For dissociation kinetics, 1 μM [ 14 C]-plitidepsin was mixed with 100 nM rabbit eEF1A2 in the same buffer as above for 1 h and either DMSO to 1% or unlabeled plitidepsin to reach 10 μM in 1% DMSO were added to the mixture whose final volume was 500 μL. At the selected times after this last addition, 400 μL of each sample were withdrawn and processed as above. For the fractionation process, tested samples (fractions from either the subcellular fractionation or the chromatography eluates) were mixed with 500 nM [ 14 C]-plitidepsin in 45 mM Hepes-KOH pH 7.5, 5 mM magnesium acetate, 75 mM potassium chloride, 1 mM DL-dithiothreitol and 5% (v/v) DMSO in the presence or absence of 10 μM plitidepsin, in a final volume of 500 μL. After 1 h incubation at room temperature 400 μL of each tube were withdrawn and processed as described above. FLIM-phasor FRET quantitation of eEF1A2-GFP/Plitidepsin complex formation in vivo Two-photon fluorescence-lifetime imaging FRET microscopy following the phasor approach (FLIM-phasor FRET) was performed to demonstrate the interaction between eEF1A2 and plitidepsin in the cell. Experiments were performed on a MicroTime 200 system (PicoQuant, Germany) coupled with an Olympus IX71 inverted microscope. FLIM images were acquired with a single-photon avalanche diode (τ-SPAD, PicoQuant, Germany) and FF01-520/35 bandpass filter (Semrock, Germany). For FLIM-FRET measurements, HeLa and HeLa-APL-R cells stably transfected with eEF1A2-GFP (FRET Acceptor, “Ac”) were cultured in LabTek-II chambered coverglass slides (Thermo Scientific-Nunc), and treated at 37 °C with plitidepsin-DMAC (FRET Donor, “Dn”), keeping DMSO lower than 0.5% v/v. FRET efficiencies were estimated using the FRET calculator tool included in program SimFCS (Laboratory for Fluorescence Dynamics, Irvine, CA), taking into account the contribution of “Dn” bleed-through (
📊 Figures
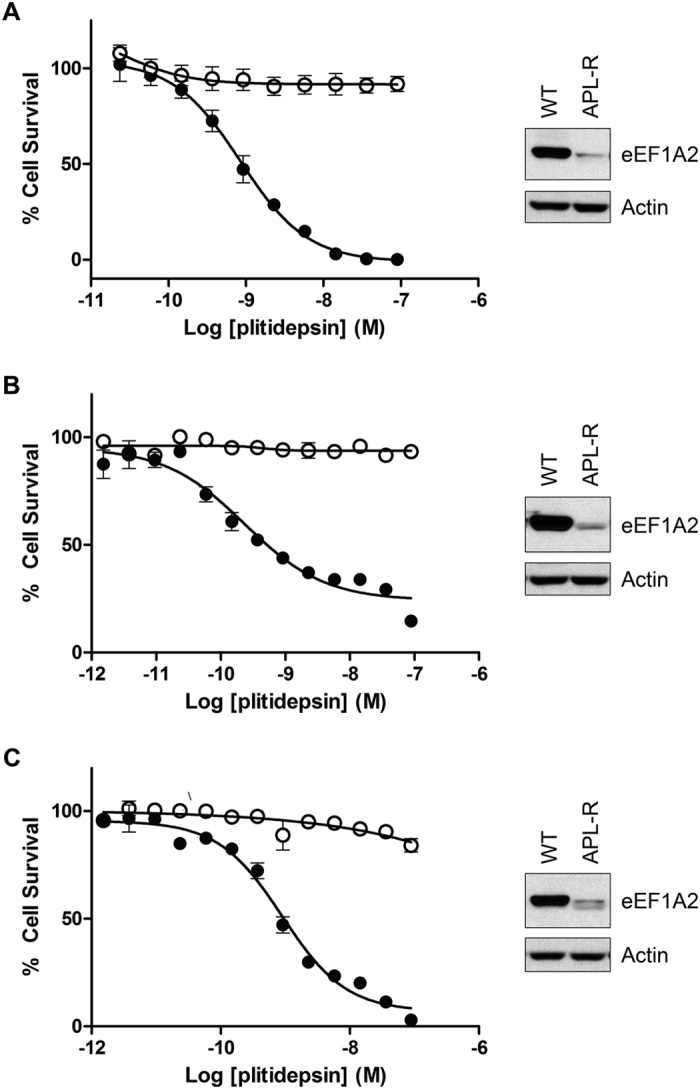
Figure 1
Plitidepsin-resistant cells lose expression of eEF1A2 protein.
Cell growth inhibition curves were obtained after 72 h of exposure to several plitidepsin concentrations for HeLa and HeLa-APL-R cervical cancer cells ( A ), NCI-H460 and NCI-H460-APL-R non-small cell...
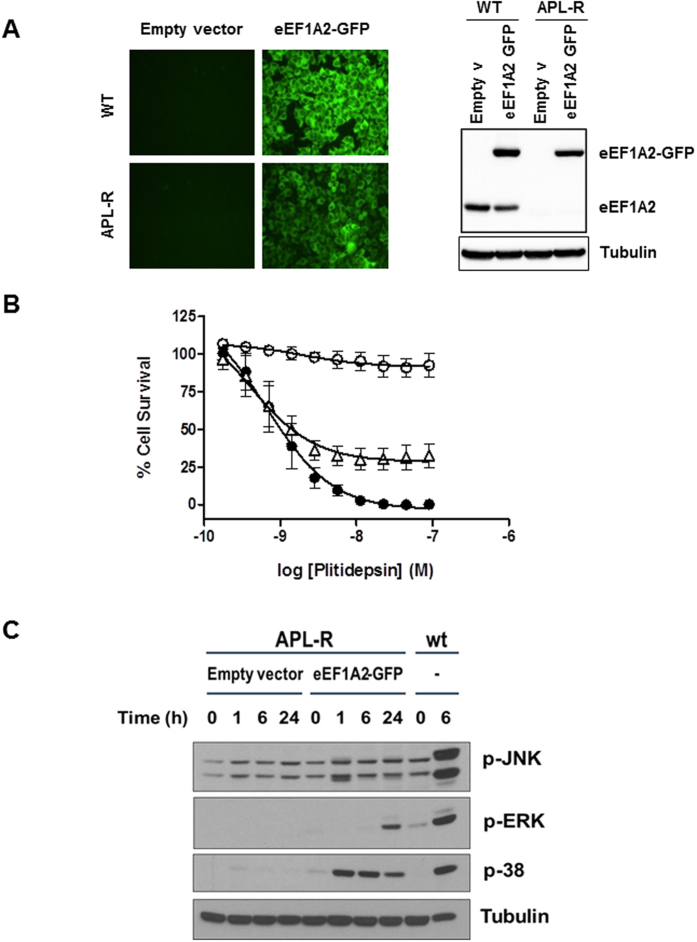
Figure 2
Ectopic expression of eEF1A2 in HeLa-APL-R cells restores sensitivity to plitidepsin.
(A) HeLa and HeLa-APL-R cells were stably transfected with an expression vector encoding for eEF1A2-GFP fusion protein. Clones homogeneously expressing the GFP were selected. The levels of expression ...
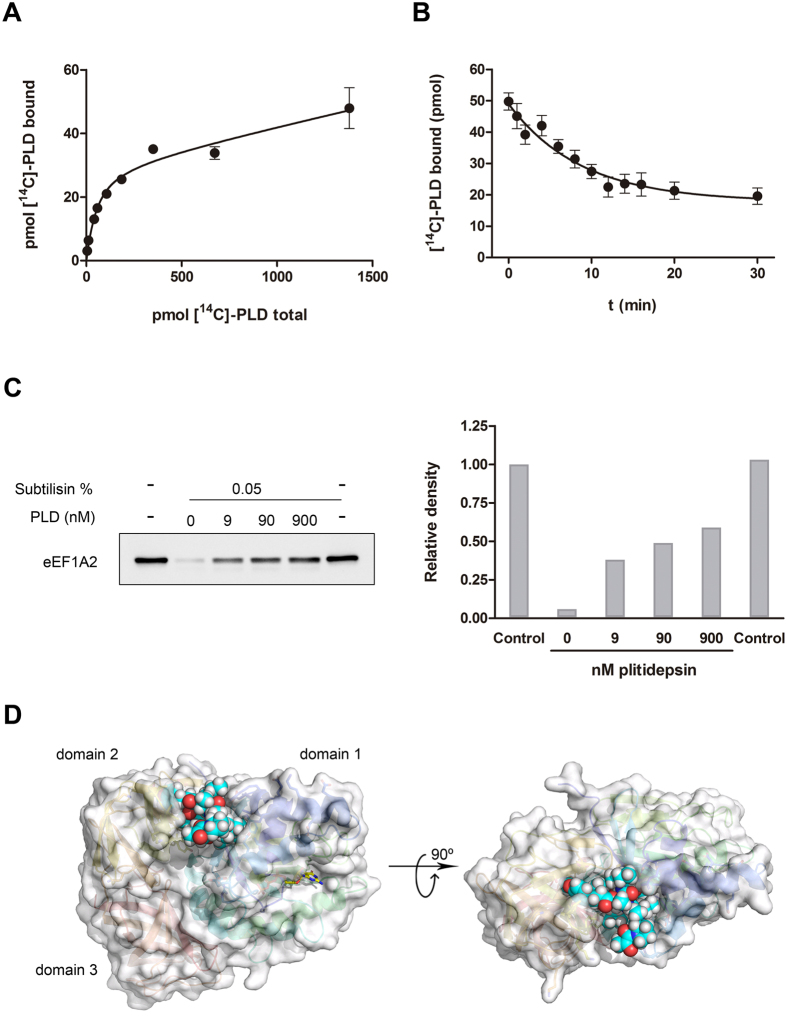
Figure 3
Interaction of [ 14 C]-plitidepsin with eEF1A2 purified from rabbit skeletal muscle.
(A) Saturation binding curve. Protein and radioligand were incubated for 1u2009h at room temperature and samples were processed as described in the text. Dots represent the mean of triplicate experime...
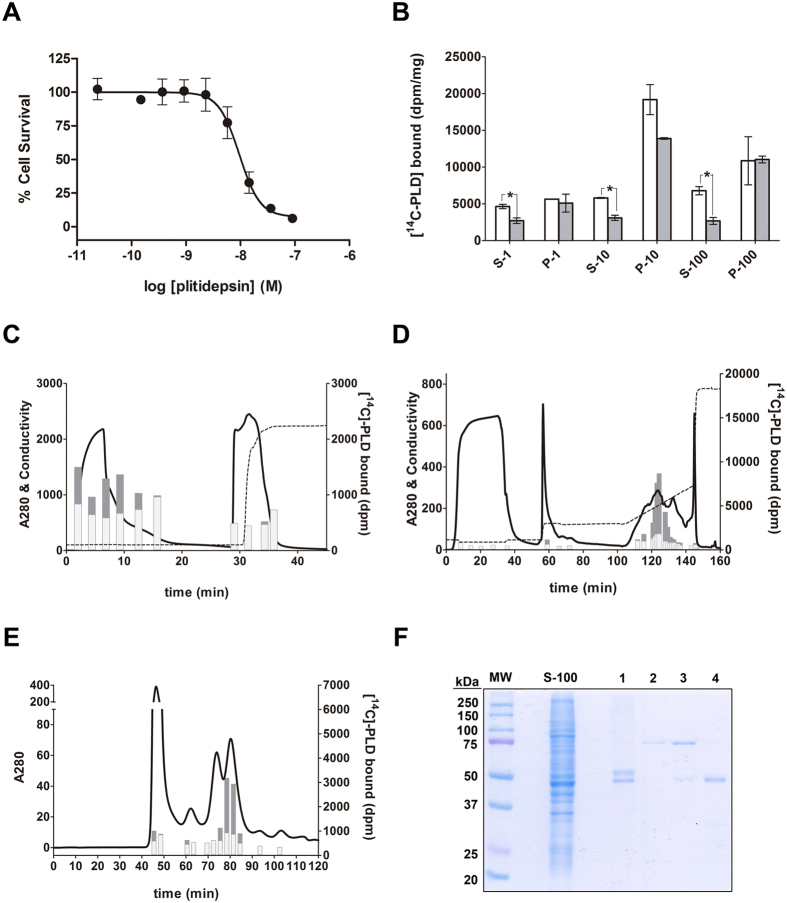
Figure 4
Identification of the plitidepsin-binding protein in a K-562 cells lysate.
(A) Growth inhibition curve for K-562 chronic myelogenous leukemia cells after 72u2009h of exposure to several plitidepsin concentrations. ( B ) Subcellular fractions from K-562 cells were obtained an...
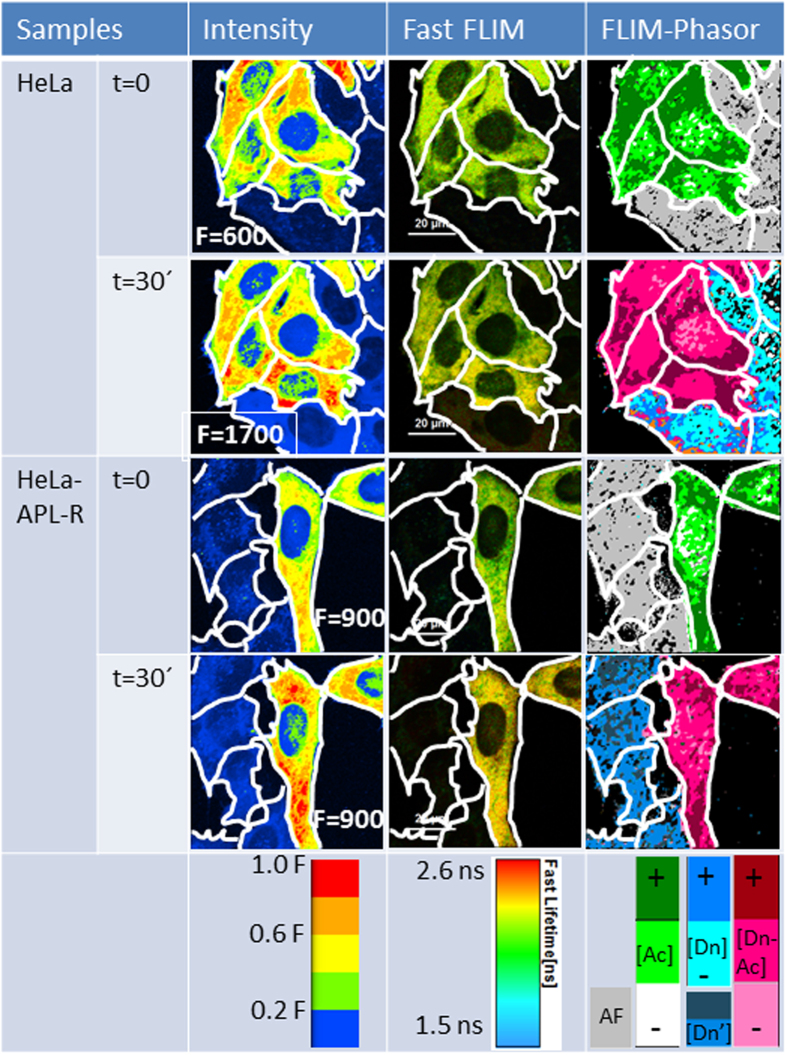
Figure 5
Cellular localization of plitidepsin-eEF1A2 complexes in living HeLa cells by steady-state fluorescence, fast FLIM and FLIM-phasor FRET imaging approaches.
First column: Normalized steady-state fluorescence intensity images of representative HeLa and HeLa-APL-R cells transfected with eEF1A2-GFP, at time zero (tu2009=u20090) and after 30u2009minutes of tr...
Figure images are served from the NIH/NLM PubMed Central Open Access Subset or Europe PMC; copyright remains with the publishers and authors.
💬 Discussion
0 commentsNo comments yet. Be the first to start a discussion!
Leave a Comment