Abstract
Signaling nanodomains rely on spatial organization of proteins to allow controlled intracellular signaling. Examples include calcium release sites of cardiomyocytes where ryanodine receptors (RyRs) are clustered with their molecular partners. Localization microscopy has been crucial to visualizing these nanodomains but has been limited by brightness of markers, restricting the resolution and quantification of individual proteins clustered within. Harnessing the remarkable localization precision of DNA-PAINT (<10 nm), we visualized punctate labeling within these nanodomains, confirmed as single RyRs. RyR positions within sub-plasmalemmal nanodomains revealed how they are organized randomly into irregular clustering patterns leaving significant gaps occupied by accessory or regulatory proteins. RyR-inhibiting protein junctophilin-2 appeared highly concentrated adjacent to RyR channels. Analyzing these molecular maps showed significant variations in the co-clustering stoichiometry between junctophilin-2 and RyR, even between nearby nanodomains. This constitutes an additional level of complexity in RyR arrangement and regulation of calcium signaling, intrinsically built into the nanodomains.
🔬 Techniques
✨ Fluorophores
🧪 Sample Preparation
🏭 Microscope Brands
🧪 Reagent Suppliers
📷 Detectors
💻 Software Details
🏛️ Research Organizations (ROR)
Affiliated research institutions:
📋 Methods
DNA-PAINT Achieves Molecular Resolution with Relatively Low Experimental Complexity
Our data confirm that DNA-PAINT can provide very high spatial localization, with comparatively low optical complexity and demands on dye photo-physics, so that we could achieve high precision routinely in relatively complex biological preparations. As shown recently ( Dai et al., 2016 , Jungmann et al., 2014 ), the photon yields for imaging with DNA-PAINT improve the localization precision to 15 RyRs, using the RyR cluster mask for segmentation of both RyR and JPH event data) in exchange-PAINT data. This included per channel calibrations of the RyR and JPH signals, respectively. The ratio r J-R = N R / N J was calculated for each large cluster in this way.
Simulation of Synthetic Data
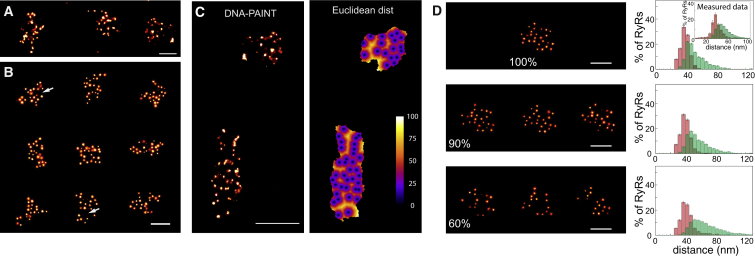
Centroids of punctate RyR labeling densities were placed iteratively in either (1) a gridded organization at a fixed spacing ( Figure S2 A) or (2) randomly placed and at a variable spacing to the next nearest neighbor as described by a random sample from a normal distribution with a specified σ. The centroids of the puncta were then convolved with a 2D Gaussian model with a σ of 5 nm. The model was then used in the PyME software to generate single-molecule events within the labeled regions and rendered as grayscale images to match the imaging and localization parameters observed in the dSTORM and DNA-PAINT experimental data for simulation of dSTORM and DNA-PAINT imaging, respectively ( Table S2 ).
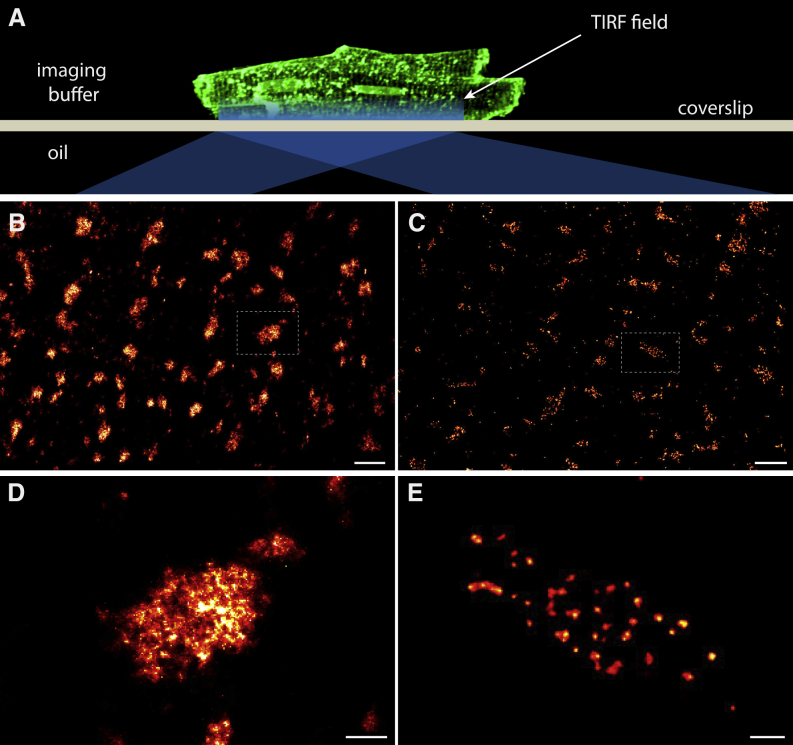
Imaging Probes, Reagents, and DNA-PAINT Protocol All primary antibodies used here were previously characterized for both immunofluorescence imaging and in vitro analyses of the targets RyR2, JPH2, and CAV3. The RyR2 antibody was a mouse monoclonal IgG (catalog no. MA3-916; Thermo Scientific, DE). See details on antibodies under Supplemental Experimental Procedures . For dSTORM imaging, a secondary antibody conjugated to Alexa Fluor 647 was used and imaged in switching buffer. In DNA-PAINT imaging, the sample was immersed in a buffer (“buffer C” as in Jungmann et al., 2014 ) containing typically 200 pM of either an ATTO 655 or ATTO 550 imager strand, complementary to the docking strand linked to the secondary antibody that we aimed to image. The imager strands reversibly bind to the complementary docking strands. Using TIRF illumination the fluorophores of hybridized imager strands were imaged, while transiently immobilized and appeared in the image as transient fluorescent spots whose shape matches the point spread function (PSF) of the microscope in its focal plane. These events were recorded as a series of image frames ( Figure S1 ).
Show full methods section
DNA-PAINT Achieves Molecular Resolution with Relatively Low Experimental Complexity
Our data confirm that DNA-PAINT can provide very high spatial localization, with comparatively low optical complexity and demands on dye photo-physics, so that we could achieve high precision routinely in relatively complex biological preparations. As shown recently ( Dai et al., 2016 , Jungmann et al., 2014 ), the photon yields for imaging with DNA-PAINT improve the localization precision to 15 RyRs, using the RyR cluster mask for segmentation of both RyR and JPH event data) in exchange-PAINT data. This included per channel calibrations of the RyR and JPH signals, respectively. The ratio r J-R = N R / N J was calculated for each large cluster in this way.
Simulation of Synthetic Data
Centroids of punctate RyR labeling densities were placed iteratively in either (1) a gridded organization at a fixed spacing ( Figure S2 A) or (2) randomly placed and at a variable spacing to the next nearest neighbor as described by a random sample from a normal distribution with a specified σ. The centroids of the puncta were then convolved with a 2D Gaussian model with a σ of 5 nm. The model was then used in the PyME software to generate single-molecule events within the labeled regions and rendered as grayscale images to match the imaging and localization parameters observed in the dSTORM and DNA-PAINT experimental data for simulation of dSTORM and DNA-PAINT imaging, respectively ( Table S2 ).
Imaging Probes, Reagents, and DNA-PAINT Protocol All primary antibodies used here were previously characterized for both immunofluorescence imaging and in vitro analyses of the targets RyR2, JPH2, and CAV3. The RyR2 antibody was a mouse monoclonal IgG (catalog no. MA3-916; Thermo Scientific, DE). See details on antibodies under Supplemental Experimental Procedures . For dSTORM imaging, a secondary antibody conjugated to Alexa Fluor 647 was used and imaged in switching buffer. In DNA-PAINT imaging, the sample was immersed in a buffer (“buffer C” as in Jungmann et al., 2014 ) containing typically 200 pM of either an ATTO 655 or ATTO 550 imager strand, complementary to the docking strand linked to the secondary antibody that we aimed to image. The imager strands reversibly bind to the complementary docking strands. Using TIRF illumination the fluorophores of hybridized imager strands were imaged, while transiently immobilized and appeared in the image as transient fluorescent spots whose shape matches the point spread function (PSF) of the microscope in its focal plane. These events were recorded as a series of image frames ( Figure S1 ).
Statistical Methods
All mean and SDs of measurements presented in the manuscript were calculated using standard statistics routines in NumPy or Excel.
Supplemental Information Document S1. Experimental Procedures, Figures S1–S6, and Tables S1 and S2 Document S2. Article plus Supplemental Information
📊 Figures
Figureu00a01
Visualization of RyRs in Peripheral Couplons of Ventricular Myocytes (A) TIRF illumination of peripheral RyR labels adjacent to the coverslip. (B and C) Both dSTORM (B) and DNA-PAINT (C) typically sho...
Figureu00a02
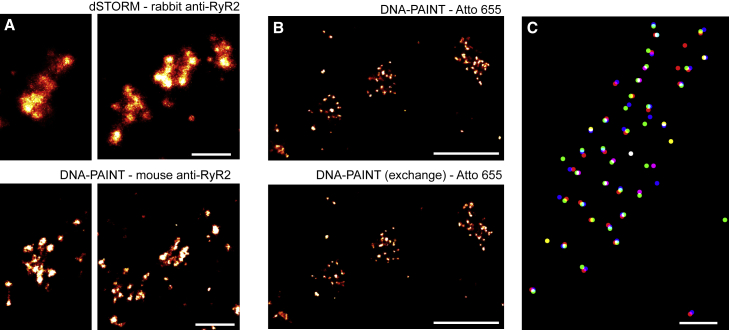
Reproducibility of RyR Cluster Nanostructure with DNA-PAINT Imaging (A) dSTORM images of RyR clusters (upper) in peripheral nanodomains showed clear visual agreement with correlative DNA-PAINT images ...
Figureu00a03
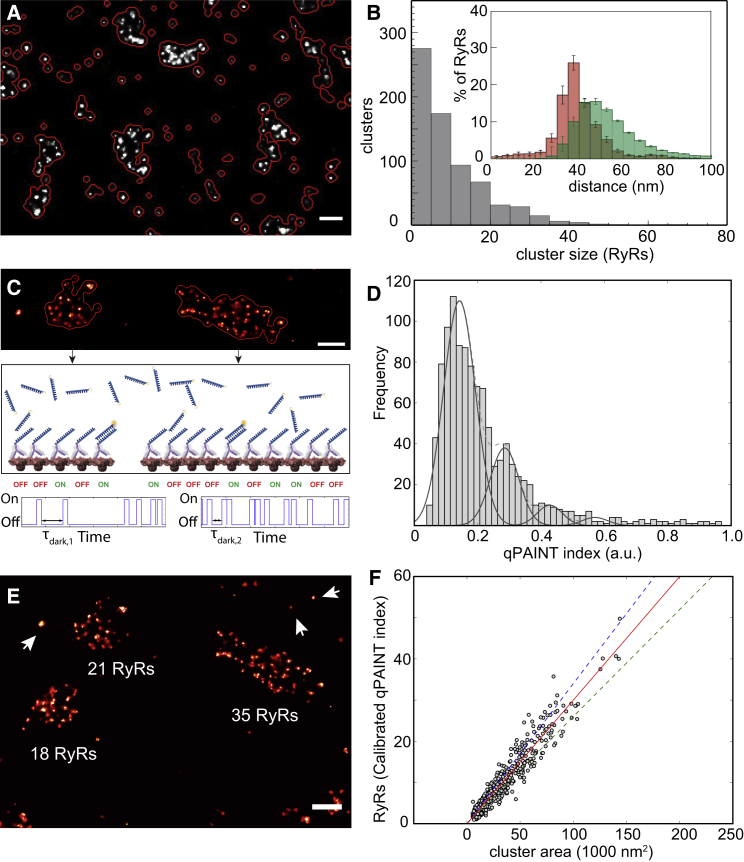
Quantitative Analysis of RyR Cluster Properties (A) Clusters were segmented using an algorithm that contours the image based on local event density (red lines). (B) A frequency histogram of RyR puncta...
Figureu00a04
Morphology of RyR Organization within Clusters (A) DNA-PAINT example of three adjacent peripheral RyR clusters with their typical irregular cluster shapes and puncta arrangement. (B) Simulated super-r...
Figureu00a05
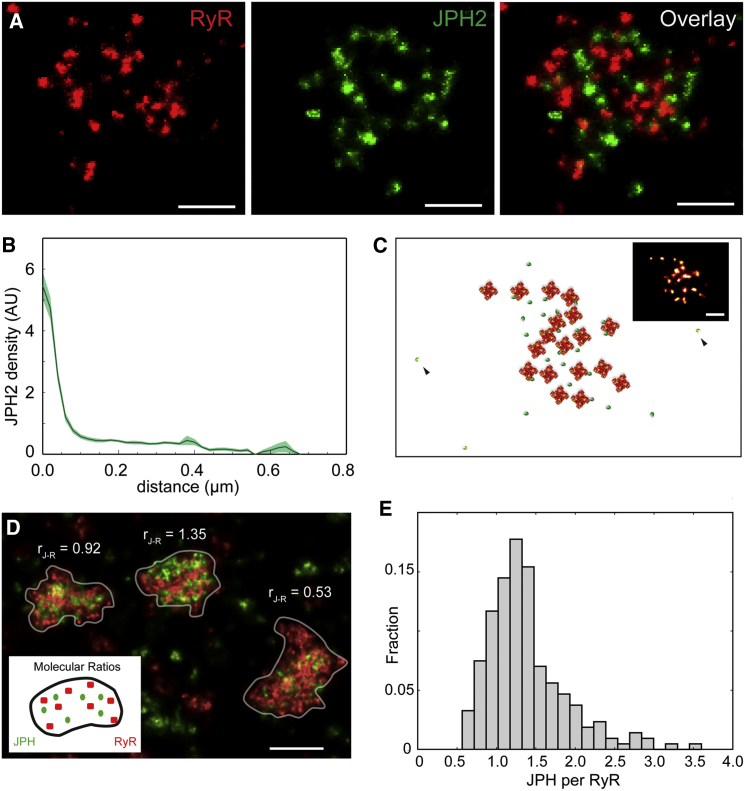
Exchange-PAINT of JPH2 Interaction with RyR in Peripheral Clusters (A) Example exchange-PAINT images of RyR (red), JPH2 (green), and their overlay (right). (B) Analysis of the JPH2 labeling density as...
Figureu00a06
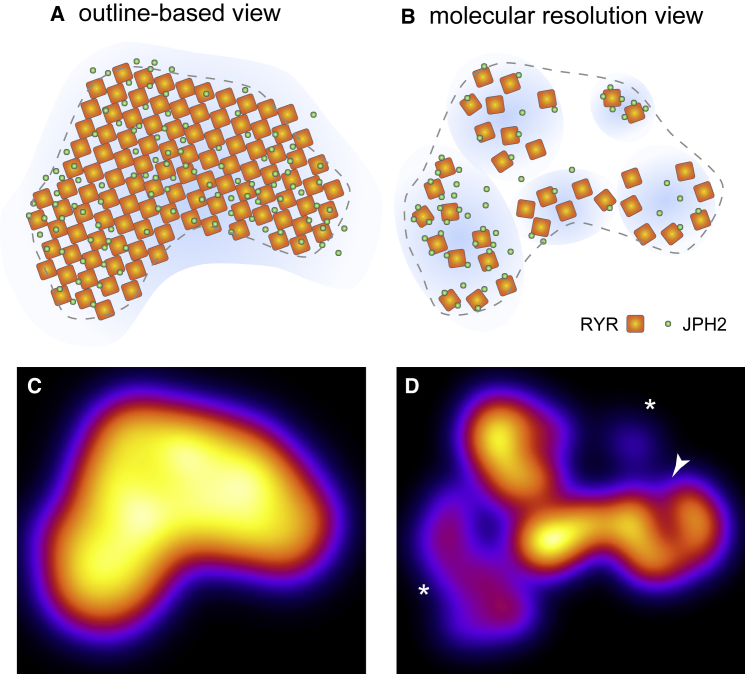
Schematic Comparison of Outline-Based and Molecular Scale Views of RyR Clusters (A and B) Schematic comparison of the outline-based view of RyR clusters (A) and the molecular-scale maps (B). The latte...
Figure images are served from the NIH/NLM PubMed Central Open Access Subset or Europe PMC; copyright remains with the publishers and authors.
💬 Discussion
0 commentsNo comments yet. Be the first to start a discussion!
Leave a Comment