Abstract
The voltage-dependent anion channel (VDAC, also known as mitochondrial porin) is the major transport channel mediating the transport of metabolites, including ATP, across the mitochondrial outer membrane. Biochemical data demonstrate the binding of the cytosolic protein hexokinase-I to VDAC, facilitating the direct access of hexokinase-I to the transported ATP. In human cells, three hVDAC isoforms have been identified. However, little is known on the distribution of these isoforms within the outer membrane of mitochondria and to what extent they colocalize with hexokinase-I. In this study we show that whereas hVDAC1 and hVDAC2 are localized predominantly within the same distinct domains in the outer membrane, hVDAC3 is mostly uniformly distributed over the surface of the mitochondrion. We used two-color stimulated emission depletion (STED) microscopy enabling a lateral resolution of ~40 nm to determine the detailed sub-mitochondrial distribution of the three hVDAC isoforms and hexokinase-I. Individual hVDAC and hexokinase-I clusters could thus be resolved which were concealed in the confocal images. Quantitative colocalization analysis of two-color STED images demonstrates that within the attained resolution, hexokinase-I and hVDAC3 exhibit a higher degree of colocalization than hexokinase-I with either hVDAC1 or hVDAC2. Furthermore, a substantial fraction of the mitochondria-bound hexokinase-I pool does not colocalize with any of the three hVDAC isoforms, suggesting a more complex interplay of these proteins than previously anticipated. This study demonstrates that two-color STED microscopy in conjunction with quantitative colocalization analysis is a powerful tool to study the complex distribution of membrane proteins in organelles such as mitochondria.PACS: 87.16.Tb, 87.85.Rs.
🔬 Techniques
🔭 Microscopes
💻 Software
✨ Fluorophores
🧪 Sample Preparation
🔬 Cell Lines
🏭 Microscope Brands
🧪 Reagent Suppliers
🔎 Objectives
💻 Software Details
💾 Data Repositories
🏛️ Research Organizations (ROR)
Affiliated research institutions:
📋 Methods
Sequence alignment hVDAC1 ( NP_003365 ), hVDAC2 ( NP_003366 ) and hVDAC3 ( NP_005653 ) sequences were taken from the NCBI database. The multiple sequence alignment was performed with the ClustalW2 program [ 35 ] from the EMBL-EBI homepage using the default values http://www.ebi.ac.uk/Tools/clustalw2/index.html .
Cloning
Expression plasmids for the following fusion constructs were generated: hVDAC1-Flag, hVDAC1-V5, hVDAC2-Flag and hVDAC3-Flag. The expression plasmids pDest40-hVDAC1-V5 and pDestMD-hVDAC2-Flag were created by gateway cloning (Invitrogen, Carlsbad, CA) using DONR clones from the Human ORFeome Collection [ 36 ] and V5 or Flag containing DEST vectors, respectively. For the generation of the hVDAC1-Flag and hVDAC3-Flag expression vectors, the coding sequences of hVDAC1 and hVDAC3 were amplified by PCR using the following primers: ATC GGT ACC AAT GGC TGT GCC ACC CAC G and CCG GGA TCC TGC TTG AAA TTC CAG TCC T for hVDAC1 and ATC GGT ACC AAT GTG TAA CAC ACC AAC GT and CCG GGA TCC AGC TTC CAG TTC AAA TCC C for hVDAC3. Subsequently the PCR products were digested and inserted into the KpnI and BamHI restriction sites of the multiple cloning site of pFlag-CMV-5.1 (Sigma-Aldrich, Taufkirchen, Germany).
Cell culture and transfection Human osteosarcoma
(U2OS) cells (ECACC, Salisbury, UK) were cultivated in DMEM medium (Invitrogen, Carlsbad, CA) with Glutamax and 4.5% (w/v) Glucose supplemented with 50 U/ml Penicillin, 50 μ g/ml (w/v) Streptomycin, 1 mM Na-Pyruvate and 10% (v/v) FCS (Invitrogen, Carlsbad, CA). The cells were cultured in petri dishes at 37°C and 7% CO 2 . For transfection, the Optifect reagent (Invitrogen, Carlsbad, CA) was used according to the manufacturer's instructions. The cells were imaged 24 hours after the transfection.
Show full methods section
Sequence alignment hVDAC1 ( NP_003365 ), hVDAC2 ( NP_003366 ) and hVDAC3 ( NP_005653 ) sequences were taken from the NCBI database. The multiple sequence alignment was performed with the ClustalW2 program [ 35 ] from the EMBL-EBI homepage using the default values http://www.ebi.ac.uk/Tools/clustalw2/index.html .
Cloning
Expression plasmids for the following fusion constructs were generated: hVDAC1-Flag, hVDAC1-V5, hVDAC2-Flag and hVDAC3-Flag. The expression plasmids pDest40-hVDAC1-V5 and pDestMD-hVDAC2-Flag were created by gateway cloning (Invitrogen, Carlsbad, CA) using DONR clones from the Human ORFeome Collection [ 36 ] and V5 or Flag containing DEST vectors, respectively. For the generation of the hVDAC1-Flag and hVDAC3-Flag expression vectors, the coding sequences of hVDAC1 and hVDAC3 were amplified by PCR using the following primers: ATC GGT ACC AAT GGC TGT GCC ACC CAC G and CCG GGA TCC TGC TTG AAA TTC CAG TCC T for hVDAC1 and ATC GGT ACC AAT GTG TAA CAC ACC AAC GT and CCG GGA TCC AGC TTC CAG TTC AAA TCC C for hVDAC3. Subsequently the PCR products were digested and inserted into the KpnI and BamHI restriction sites of the multiple cloning site of pFlag-CMV-5.1 (Sigma-Aldrich, Taufkirchen, Germany).
Cell culture and transfection Human osteosarcoma
(U2OS) cells (ECACC, Salisbury, UK) were cultivated in DMEM medium (Invitrogen, Carlsbad, CA) with Glutamax and 4.5% (w/v) Glucose supplemented with 50 U/ml Penicillin, 50 μ g/ml (w/v) Streptomycin, 1 mM Na-Pyruvate and 10% (v/v) FCS (Invitrogen, Carlsbad, CA). The cells were cultured in petri dishes at 37°C and 7% CO 2 . For transfection, the Optifect reagent (Invitrogen, Carlsbad, CA) was used according to the manufacturer's instructions. The cells were imaged 24 hours after the transfection.
Sample preparation
For immunolabeling, cells were grown on coverslips over night, fixed with 8% (w/v) formaldehyde in phosphate buffered saline (PBS) (137 mM NaCl, 3 mM KCl, 8 mM Na 2 HPO 4 , 1.5 mM KH 2 PO 4 , pH 7) for 5 minutes at 37°C, extracted for 5 min with 0.5% (v/v) Triton X-100 in PBS, blocked with PBS with 10% bovine serum albumin (BSA) for 5 min and incubated with the following primary antibodies in PBS with 10% BSA for 1 hour: anti-Tom20 rabbit polyclonal antibody (Santa Cruz Biotechnology, Santa Cruz, CA), anti-hexokinase-I rabbit monoclonal antibody (Cell Signaling Technology, Danvers, MA), anti-Flag monoclonal mouse antibody (Sigma-Aldrich, Taufkirchen, Germany), or anti-V5 polyclonal rabbit antibody (Sigma-Aldrich, Taufkirchen, Germany). Then, after 5 minutes incubation with 0.5% (v/v) Triton X-100 in PBS, followed by 5 minutes blocking with PBS with 10% BSA, the coverslips were incubated with the following secondary antibodies: goat anti-rabbit antibody conjugated to Alexa 488 (Invitrogen, Carlsbad, CA), sheep anti-mouse antibody conjugated to Cy 3 (Dianova, Hamburg, Germany). For STED microscopy, sheep anti-mouse, goat anti-rabbit and donkey anti-goat antibodies (Jackson ImmunoResearch Laboratories, West Grove, PA) custom-labelled with ATTO 590 (ATTO-TEC GmbH, Siegen, Germany) or KK114 (kindly provided by Dr. K. Kolmakov and Dr. V. Belov, Dept. of NanoBiophotonics, Max Planck Institute for Biophysical Chemistry) were used. Finally, the samples were washed in PBS for 30 minutes and mounted in Mowiol (Sigma-Aldrich, Taufkirchen, Germany) with 0.1% (w/v) DABCO (Sigma-Aldrich, Taufkirchen, Germany) and, occasionally, with DAPI (Sigma-Aldrich, Taufkirchen, Germany).
Microscopy
Confocal images were recorded with a beam scanning confocal microscope (TCS SP5, Leica Microsystems) equipped with an HCX PL APO 63×/1.40-0.60 oil objective lens. For three color image acquisitions the microscope was used in the sequential mode. The fluorescence was excited at 405 nm (DAPI), 488 nm (Alexa 488) and 561 nm (Cy 3). The detection wavelength range was set to 410-435 nm for DAPI, 495-520 nm for Alexa 488 and 570-650 nm for Cy 3. Pixel dimensions were chosen according to the Nyquist criterion. Each image was averaged twice. Except for contrast stretching, no other image processing was applied. Two-color STED images were recorded with a custom-built STED-microscope which combines two pairs of excitation and STED laser beams all derived from a single supercontinuum laser source similar to the one described previously [ 37 ]. The excitation wavelengths (570 ± 5 nm for ATTO 590, 650 ± 5 nm for KK 114) were selected from the supercontinuum using an acousto-optical tunable filter (AOTF, AA Opto-Electronic, Orsay Cedex, France) whereas the STED wavelengths (710 ± 20 nm for ATTO 590, 755 ± 20 nm for KK 114) were extracted using prism monochromators and appropriate interference bandpass filters. All beams were coupled into separate polarization maintaining single-mode fibers. At the fiber outputs the beams were collimated and sent to the objective lens. Doughnut-shaped STED foci with a zero-intensity minimum in the center were generated by placing two vortex phase plates (RPC Photonics, Rochester, NY, U.S.A.) into the STED beams. The excitation and STED beams were combined into pairs of beams with orthogonal polarization using dichroic beamsplitters. The two pairs of excitation and STED beams were then combined with a polarizing beam splitter cube and coupled into the objective lens. An achromatic quarterwave plate (500-900 nm, B. Halle GmbH, Berlin, Germany) placed at the back of the objective lens afforded circular polarization for all beams. The fluorescence from both fluorophores was first separated from the laser beams with a custom multi-band dichroic beamsplitter (Chroma Technology, Rockingham, VT, USA), was split up into the two colors with a second dichroic beamsplitter (Z635RDC, Chroma Technology) and was further cleaned up with bandpass and longpass filters (620/40 m for ATTO 590 and 670/40 m + Z660LP for KK 114, all from Chroma Technology). The fluorescence was focused into separate multimode optical fibers (M31L01, Thorlabs, Dachau/Munich, Germany) which served as confocal pinholes. The fibers were attached to single-photon counting modules (SPC-AQRH-13-FC, Perkin Elmer, Salem, MA, USA) which were in turn connected to custom time gating electronics which separated the fluorescence signals following each of the excitation/STED pulse pairs. The spatial alignment of the excitation and the STED foci was made by sequential measurement of the point spread functions (PSFs) of the four beams. The PSFs were acquired by recording the scattered light from gold nanoparticles (80 nm) as they were scanned through the focus. The alignment precision was better than 20 nm, i.e. below the resolution achievable with the setup and, consequently, beam offsets could be neglected for the analysis of the recorded images. To ensure the simultaneous arrival of the excitation and the respective STED beams in the sample, the optical path lengths were matched for each pair of beams. However, the pairs of excitation and STED beams for the two different color channels were time-shifted by about 40 ns. This pulse-interleaved acquisition scheme allowed the (quasi-)simultaneous recording of both color channels while the fluorescence from the two color channels could be separated based on the photon arrival time at the detector. Therefore, no shift of the images is expected, e.g. due to a drift of the sample, which would compromise the analysis of the data. Typically, the images were acquired with pixel size of 20 × 20 nm 2 and a pixel dwell-time of 1 ms. For comparison, confocal images were recorded as a reference in addition to the STED images. All image data shown in this study and used for subsequent analysis are raw data. No deconvolution algorithms were utilized.
Image analysis
The image analysis was performed with custom routines written in MATLAB (The Mathworks, Natick, MA, USA). Before analyzing the colocalization of each pair of proteins, the raw data were pre-processed to correct for imaging artifacts which interfere with the colocalization analysis. In particular, crosstalk between the two detection channels was removed and masks were applied. The workflow of the image analysis is shown in Fig. 1 . Figure 1 Image analysis . The two-color STED images were collected with an interleaved pulse scheme. The first pair of excitation/STED pulses (at wavelengths of 650 and 755 nm) was followed by the second pair (at wavelengths of 570 and 710 nm) with a 40 ns delay. Using two detectors and a time-gated detection scheme, it was thus possible to detect the fluorescence emission following each pulse in two different wavelength bands, resulting in a set of four recordings. The four raw images were linearly unmixed to correct for channel crosstalk and were normalized. Segmentation was then performed with an iterative seeded region growing algorithm which extracted the regions of the image containing mitochondria. Only those regions were used in the subsequent calculation of the correlation coefficients. For better visibility the images are shown with a logarithmic color map. Due to the spectral overlap between the absorption and emission spectra of the dyes ATTO 590 and KK 114, their fluorescence emission cannot be strictly separated by wavelength-selective fluorescence excitation and/or detection. Rather, the emission of the ATTO 590 dye is not only recorded in the short wavelength ("green") detection channel but, to some degree, also in the long wavelength ("red") channel. The same holds for the KK 114 emission which, to a minor extent, is also registered by the "green" channel. However, the employed image acquisition scheme minimizes the crosstalk by using both spectrally selective excitation and detection. The remaining cross talk was eliminated by means of linear unmixing [ 38 ] where the crosstalk matrix had been previously determined from singly labeled reference samples. After normalization, the images were masked to restrict the colocalization analysis to the regions containing mitochondria. To compute the mask, a seeded region growing algorithm was employed. Initially, the measured images were eroded with a disk ( r = 3-5 pixels) to remove small isolated spots of fluorescence which were present in some of the images and were probably due to unspecifically bound single antibodies. Next, the images were slightly smoothed with a Gaussian filter ( σ = 3-5 pixels) and were normalized. Seed points were then generated by thresholding the smoothed image at a level of ( μ + xσ ) where μ is the mean image intensity, σ is its standard deviation and x is a signal-to-noise paramater which was chosen between 0.8 (confocal images) and 1.8 (STED images). Starting from these seed points, region growing (implemented as repeated dilation/thresholding operations) was applied until the pixel intensity dropped below t a times the average signal intensity (as determined from the masked regions) or reached t b times the average background intensity (as determined from the unmasked regions); t a was typically chosen between 0.3 and 0.75 whereas t b = 3.4. The masks were generated for both color channels individually and were combined with a logical OR operation to get the final mask. For the actual colocalization analysis we decided to employ several colocalization measures each of which have their individual strengths and limitations [ 39 , 40 ]. One common choice to quantify the colocalization of two features is Pearson's correlation coefficient [ 41 ] where the summations extend over all pixels, R i and G i are the intensity values of pixel i in the "red" and "green" channels and and are their mean values, respectively. Because the mean intensities are subtracted from the pixel values, r p can take values between -1 and +1. For the same reason, overlap between randomly located features does not increase the correlation coefficient but averages out to zero. Because negative values of r p are difficult to interpret and r p depends on the relative number of features present in the two channels, we additionally adopted other measures of colocalization in our analysis. The overlap coefficient [ 39 ] measures the fraction of all ("red" and "green") objects which colocalize in the two images and therefore ranges from 0 to 1. It is more intuitively interpreted than Pearson's correlation coefficient but its value also depends on the relative number of features present in the two channels. Further, its significance is compromised by randomly distributed and overlapping features which do not cancel out as is the case for r p . To account for different numbers of features in the two channels, the colocalization coefficients have been introduced [ 39 ]: where R i , coloc = R i if G i > 0 and G i , coloc = G i if R i > 0. M 1 and M 2 represent the fraction of features in one channel which colocalize with a feature in the other channel and are thus a direct and easily interpretable measure to quantify colocalization. Their reliability, however, is compromised by the requirement to set thresholds to classify pixels as objects or background. Our analysis showed that the values of M 1 and M 2 critically depend on the choice of the thresholds.
Supplementary Material Additional file 1 Heterogeneity of the hVDAC3 distribution induced by co-expression with hVDAC1 . Confocal microscopy of U2OS cells transfected with hVDAC3-Flag alone (left image) or with hVDAC3-Flag together with hVDAC1-V5 (right image). For visualisation of hVDAC3, cells were decorated with antisera against the Flag tag. Comparing both images reveals that some heterogeneity of the hVDAC3 distribution is induced by the co-expression of hVDAC1-V5. Click here for file Additional file 2 Crosstalk between the green and the red channel in the confocal microscope . In order to determine the level of crosstalk between both detection channels, cells were labeled as for two-color confocal imaging (see Fig. 3 ) with the exception that we used only one primary antibody and the corresponding secondary antibody. All imaging parameters were the same as for two-color confocal imaging. No detectable crosstalk was observed. Click here for file Additional file 3 Colocalization analysis of the three hVDAC isoforms based on confocal images . (A) Quantitative colocalization analysis of hVDAC1 with hVDAC2 and hVDAC3. Shown are the Pearson's correlation coefficient r p , the overlap coefficient r as well as the colocalization coefficients M 1 and M 2 . As positive control for full colocalization, we analyzed cells co-expressing hVDAC1-Flag and hVDAC1-V5. Error bars: Standard deviation. For each column 10 cells were analyzed. (B) Detailed values graphically represented in (A). Click here for file Additional file 4 Colocalization analysis based on two-color STED images . Detailed values as graphically represented in Fig. 6A-D in the main text. For details see caption to Fig. 6 . Click here for file
📊 Figures
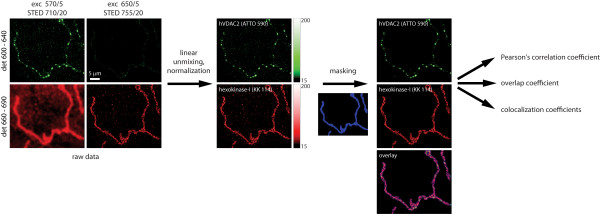
Figure 1
Image analysis . The two-color STED images were collected with an interleaved pulse scheme. The first pair of excitation/STED pulses (at wavelengths of 650 and 755 nm) was followed by the second pair ...
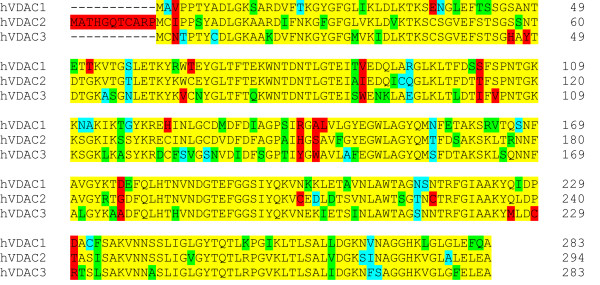
Figure 2
Amino acid sequence alignment of the three hVDAC isoforms . Identical amino acids are colored in yellow, conserved substitutions in green and semi-conserved substitutions in turquoise. Substitutions w...
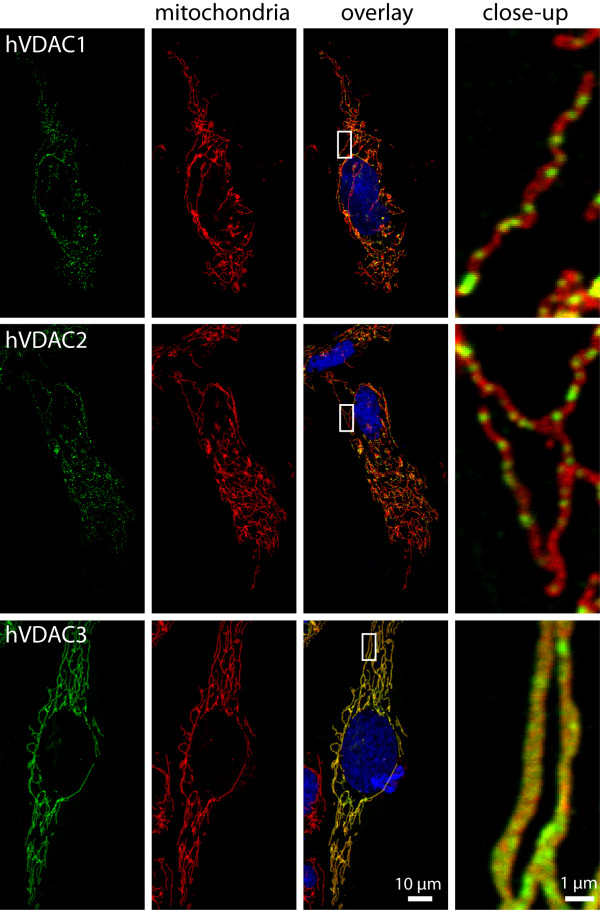
Figure 3
Distinct sub-mitochondrial distributions of the three hVDAC isoforms . Confocal microscopy of immunolabeled cultured human U2OS cells. Green: Different hVDAC isoforms, as indicated. For visualization,...
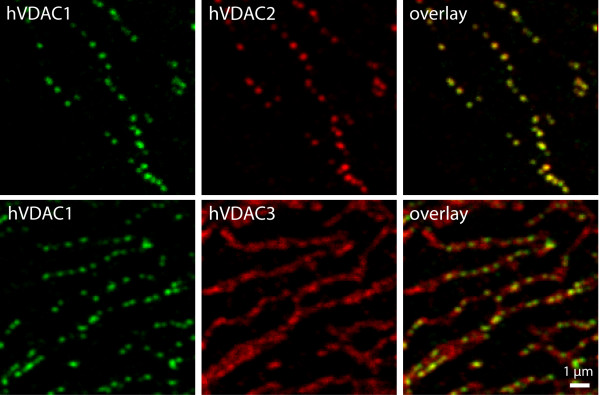
Figure 4
hVDAC1 and hVDAC2 colocalize in distinct domains in the mitochondrial outer membrane . Confocal imaging of cells expressing two tagged hVDAC isoforms. U2OS cells were decorated with antibodies against...
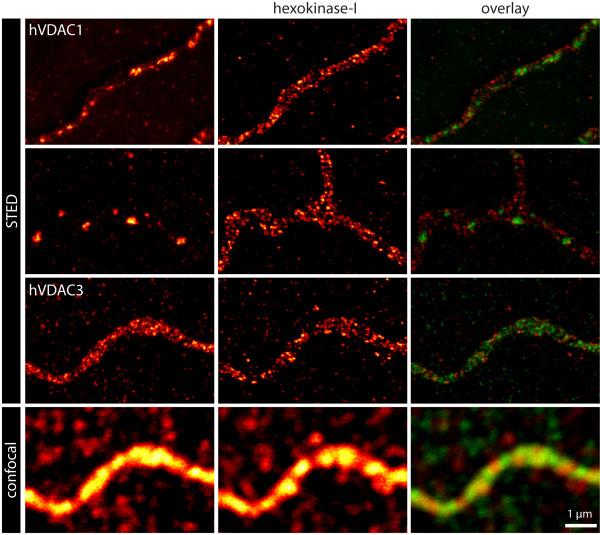
Figure 5
Two-color STED microscopy of the three hVDAC isoforms and hexokinase-I reveals individual protein clusters . U2OS cells expressing one of the three Flag-tagged hVDAC isoforms were labeled with antibod...
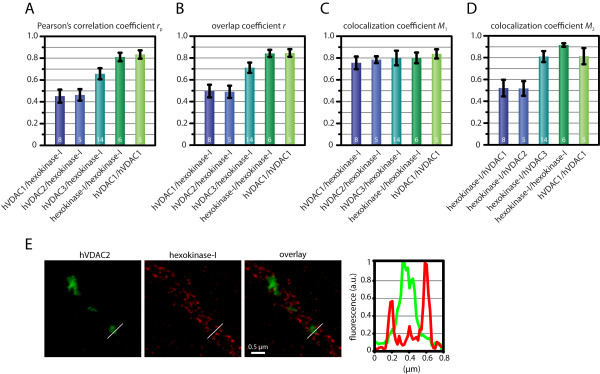
Figure 6
The hVDAC isoforms exhibit different degrees of colocalization with hexokinase-I . Quantitative colocalization analysis of any of the three hVDAC isoforms with hexokinase-I based on two-color STED ima...
Figure images are served from the NIH/NLM PubMed Central Open Access Subset or Europe PMC; copyright remains with the publishers and authors.
💬 Discussion
0 commentsNo comments yet. Be the first to start a discussion!
Leave a Comment