Abstract
Striosomes were discovered several decades ago as neurochemically identified zones in the striatum, yet technical hurdles have hampered the study of the functions of these striatal compartments. Here we used 2-photon calcium imaging in neuronal birthdate-labeled Mash1-CreER;Ai14 mice to image simultaneously the activity of striosomal and matrix neurons as mice performed an auditory conditioning task. With this method, we identified circumscribed zones of tdTomato-labeled neuropil that correspond to striosomes as verified immunohistochemically. Neurons in both striosomes and matrix responded to reward-predicting cues and were active during or after consummatory licking. However, we found quantitative differences in response strength: striosomal neurons fired more to reward-predicting cues and encoded more information about expected outcome as mice learned the task, whereas matrix neurons were more strongly modulated by recent reward history. These findings open the possibility of harnessing in vivo imaging to determine the contributions of striosomes and matrix to striatal circuit function.
🔬 Techniques
🔭 Microscopes
✨ Fluorophores
🧪 Sample Preparation
🏭 Microscope Brands
🧪 Reagent Suppliers
📷 Detectors
💻 Software Details
💻 Code & Software
💾 Data Repositories
🏛️ Research Organizations (ROR)
Affiliated research institutions:
📋 Methods
Key resources table
Reagent type (species) or resource Designation Source or reference Identifiers Additional information strain, strain background (mouse,both sexes) Mash1(Ascl1)-CreER Jackson Laboratory Ascl1tm1.1(Cre/ERT2)Jejo/J Stock no: 12882 strain, strain background (mouse,both sexes) Ai14 Jackson Laboratory B6.Cg-Gt(ROSA)26Sortm14 (CAG-tdTomato)Hze/J Stock no: 007914 strain, strain background (mouse,both sexes) C57Bl6/J Jackson Laboratory C57BL/6J Stock no: 000664 genetic reagent AAV5-hSyn-GCaMP6s-wpre-sv40 University of Pennsylvania Vector Core) antibody anti-MOR1 Santa-Cruz sc-7488 Polyclonal goat (1:500) antibody anti-GFP Abcam ab13970 Polyclonal chicken (1:2000) software, algorithm Matlab Mathworks software, algorithm Image-J National Institutes of Health All experiments were conducted in accordance with the National Institutes of Health guidelines and with the approval of the Committee on Animal Care at the Massachusetts Institute of Technology (MIT).
Mice
Mash1(Ascl1)-CreER mice ( Kim et al., 2011 ) (Ascl1tm1.1(Cre/ERT2)Jejo/J, Jackson Laboratory) were crossed with Ai14-tdTomato Cre-dependent mice ( Madisen et al., 2010 ) (B6;129S6-Gt(ROSA)26Sor, Jackson Laboratory) to achieve tdTomato labeling driven by Mash1 and crossed with FVB mice in the MIT colony to improve breeding results. Female Mash1-CreER;Ai14 mice were then crossed with C57BL/6J males to breed the mice that we used for the experiments. Tamoxifen was administered to pregnant dams by oral gavage (100 mg/kg, dissolved in corn oil) to induce Mash1-CreER at embryonic day (E) 11.5, a time point at which predominantly striosomal but almost no matrix neurons are born, in order to label predominantly striosomal neurons in anterior to mid-anteroposterior levels of the caudoputamen. Five mice (4 male and one female) were used for the imaging experiments.
Show full methods section
Key resources table
Reagent type (species) or resource Designation Source or reference Identifiers Additional information strain, strain background (mouse,both sexes) Mash1(Ascl1)-CreER Jackson Laboratory Ascl1tm1.1(Cre/ERT2)Jejo/J Stock no: 12882 strain, strain background (mouse,both sexes) Ai14 Jackson Laboratory B6.Cg-Gt(ROSA)26Sortm14 (CAG-tdTomato)Hze/J Stock no: 007914 strain, strain background (mouse,both sexes) C57Bl6/J Jackson Laboratory C57BL/6J Stock no: 000664 genetic reagent AAV5-hSyn-GCaMP6s-wpre-sv40 University of Pennsylvania Vector Core) antibody anti-MOR1 Santa-Cruz sc-7488 Polyclonal goat (1:500) antibody anti-GFP Abcam ab13970 Polyclonal chicken (1:2000) software, algorithm Matlab Mathworks software, algorithm Image-J National Institutes of Health All experiments were conducted in accordance with the National Institutes of Health guidelines and with the approval of the Committee on Animal Care at the Massachusetts Institute of Technology (MIT).
Mice
Mash1(Ascl1)-CreER mice ( Kim et al., 2011 ) (Ascl1tm1.1(Cre/ERT2)Jejo/J, Jackson Laboratory) were crossed with Ai14-tdTomato Cre-dependent mice ( Madisen et al., 2010 ) (B6;129S6-Gt(ROSA)26Sor, Jackson Laboratory) to achieve tdTomato labeling driven by Mash1 and crossed with FVB mice in the MIT colony to improve breeding results. Female Mash1-CreER;Ai14 mice were then crossed with C57BL/6J males to breed the mice that we used for the experiments. Tamoxifen was administered to pregnant dams by oral gavage (100 mg/kg, dissolved in corn oil) to induce Mash1-CreER at embryonic day (E) 11.5, a time point at which predominantly striosomal but almost no matrix neurons are born, in order to label predominantly striosomal neurons in anterior to mid-anteroposterior levels of the caudoputamen. Five mice (4 male and one female) were used for the imaging experiments.
Surgery
Virus injections Adult
Mash1(Ascl1)-CreER;Ai14 mice received virus injections during aseptic stereotaxic surgery at 7–10 weeks of age. They were deeply anesthetized with 3% isoflurane, were then head-fixed in a stereotaxic frame, and were maintained on anesthesia with 1–2% isoflurane. Meloxicam (1 mg/kg) was subcutaneously administered, the surgical field was prepared and cleaned with betadine and 70% ethanol, and based on pre-determined coordinates, the skin was incised, the head was leveled to align bregma and lambda, and two holes (ca. 0.5 mm diameter) were drilled in the skull. Two injections of AAV5-hSyn-GCaMP6s-wpre-sv40 (0. 5 µl each, University of Pennsylvania Vector Core) were made, one per skull opening, to favor widespread transfections of striatal neurons at the following coordinates relative to bregma: 1) 0.1 mm anterior, 1.9 mm lateral, 2.7 mm ventral and 2) 0.9 mm anterior, 1.7 mm lateral and 2.5 mm ventral. Injections were made over 10 min, and after a ~10 min delay, the injection needles were slowly retracted. The incision was sutured shut, the mice were kept warm during post-surgical recovery, and they were given wet food and meloxicam (1 mg/kg, subcutaneous) for 3 days to provide analgesia.
Cannula implantation
We assembled chronic cannula windows by adhering a 2.7 mm glass coverslip to the end of a stainless steel metal tubing (1.6–1.8 mm long, 2.7 mm diameter; Small Parts) using UV curable glue (Norland). Cannula windows were kept in 70% ethanol until used for surgery. At 20–40 days after virus injection, mice were water restricted, and a second surgery was performed under deep isoflurane anesthesia as before to allow insertion of a cannula for imaging ( Dombeck et al., 2010 ; Howe and Dombeck, 2016 ; Lovett-Barron et al., 2014 ) and mounting of a headplate to the skull for later head fixation. Bregma and lambda were aligned in the horizontal plane, and the anterior and lateral coordinates for the craniotomy were marked (0.6 mm anterior and 2.1 mm lateral to bregma). The skull was then tilted and rolled by 5° to make the skull surface horizontal at the location of cannula implantation. A 2.7 mm diameter craniotomy was made with a trephine dental drill. The exposed cortical tissue overlying the striatum was aspirated using gentle suction and constant perfusion with cooled, autoclaved 0.01 M phosphate buffered saline (PBS), and part of the underlying white matter was removed. A thin layer of Kwiksil (WPI) was applied, and the chronic cannula was inserted into the cavity. Finally, metabond (Parkell) was used to secure the implant in place and to attach a headplate to the skull. The mice received the same post-surgical care as described above.
Behavioral training
When mice had recovered from surgery and the optical window had cleared, they were put under water restriction (1–1.5 ml per day) and were habituated to head-fixation for on average 5 days. During head fixation, the mice were held in a polyethylene tube that was suspended by springs. When they showed no clear signs of stress and readily drank water while being head-fixed, behavioral training was begun. Training and imaging was performed 5 days a week. Water was delivered through a tube controlled by a solenoid valve located outside of the imaging setup, and licking at the spout was detected by a conductance-based method ( Slotnick, 2009 ). In the behavioral training protocol, two tones (4 or 11 kHz, 1.5 s duration) were played in a random order. The tones predicted reward delivery (5 µl) with, respectively, an 80% or 20% probability. In each trial, there was a 500 ms delay after tone offset before reward delivery. Inter-trial intervals were randomly drawn from a flat distribution between 5.25 and 8.75 s. Training (acquisition phase) was considered to be complete when there was a significant difference in anticipatory licking during the cue period between the two cues (two-sided t-test, α = 0.05). Two of the five mice were initially trained on a three-tone version of the task. The training data of these mice have therefore not been included in our analysis. After reaching the acquisition criterion, mice were tested during 4–9 daily session (criterion phase). After completing the criterion phase of the experiment, two mice were given five overtraining sessions (overtraining phase).
Imaging
Imaging of GCaMP6s and tdTomato fluorescence was performed with a commercial Prairie Ultima IV 2-photon microscopy system equipped with a resonant galvo scanning module and a LUMPlanFL, 40x, 0.8 NA immersion objective lens (Olympus). For fluorescent excitation, we used a titanium-sapphire laser (Mai-Tai eHP, Newport) with dispersion compensation (Deep See, Newport). Emitted green and red fluorescence was split using a dichroic mirror (Semrock) and directed to GaAsP photomultiplier tubes (Hamamatsu). Individual fields of view were imaged using either galvo-resonant or galvo-galvo scanning, with acquisition framerates between 5 and 20 Hz. Laser power at the sample ranged from 11 to 42 mW, depending on GCaMP6s expression levels. For final analysis of the data set, all imaging sessions were resampled at a framerate of 5 Hz. Fields of view were chosen on the basis of clear labeling of putative striosomes defined by dense tdTomato signal in the neuropil. Within these zones, both tdTomato-positive as well as unlabeled cells were present and were defined as putative striosomal neurons. Because of the 2.4 mm inner diameter of the cannula, we could typically find several striosomes that we could image at different depths. Our sampling strategy was to image as many different neurons as possible. During training, we rotated through the fields of view, but after training and during overtraining, we imaged unique, non-overlapping fields of view.
Image processing and cell-type identification
Calcium imaging data were acquired using PrairieView acquisition software and were saved into multipage TIF files. Data were analyzed by using custom scripts written in ImageJ (National Institutes of Health) or Matlab (Mathworks). Analysis scripts are available at Github ( https://github.com/bloemb/eLife_2017_scripts ) ( Bloem, 2017 ). Images were first corrected for motion in the X-Y axis by registering all images to a reference frame. We used the pixel-wise mean of all frames in the red channel containing the structural tdTomato signal to make a reference image. All red channel frames were re-aligned to the reference image by the use of 2-dimensional normalized cross-correlation (template matching and slice alignment plugin) ( Tseng et al., 2011 ). The green channel frames containing the GCaMP6s signal were then realigned using the same translation coordinates with the ‘Translate’ function in ImageJ. To verify that calculating translation coordinates on the basis of the tdTomato signal did not provide better registration for striosomal than for matrix neurons, we compared the results obtained by this method with those obtained using a registration method that only uses the GCaMP6s signal. We found that, for both striosomes and matrix, the results for these registration methods were highly correlated (mean correlation coefficient: 0.9971 for striosomes and 0.9978 for matrix). After realignment, ROIs were manually drawn over neuronal cell bodies using standard deviation and mean projections of the movies. With custom Matlab scripts, we drew rings around the cell body ROIs (excluding other ROIs) to estimate the contribution of the background neuropil signal to the observed cellular signal. Fluorescence signal for each neuron was computed by taking the pixel-wise mean of the somatic ROIs and subtracting 0.7x the fluorescence of the surrounding neuropil, as previously described ( Chen et al., 2013 ). After this step, the baseline fluorescence for each neuron (F 0 ) was calculated using K-means (KS)-density clustering to find the mode of the fluorescence distribution. The ratio between the change in fluorescence and the baseline was calculated as ΔF/F = F t – F 0 / F 0 . For population analysis of single cell data, we calculated z-scores of the neuronal responses using the mean and the standard deviation of the 1 s baseline period preceding the tone onset. Individual neurons were identified as striosomal if their cell bodies lay in a region that was densely labeled by tdTomato, or if the cells themselves were tdTomato-positive. Hence, the small minority of tdTomato-positive neurons that appeared in the matrix ( Kelly et al., 2017 ) was included in the striosomal population. Altogether 6320 neurons were recorded (2871 during acquisition, 2704 after criterion, and 745 during overtraining). Of these, 1867 were considered striosomal (912 during training, 727 after criterion, and 228 during overtraining). Of these, 294 were labeled with tdTomato, 1828 were located in densely tdTomato-labeled striosomes, and 255 met both criteria. There were 39 tdTomato-labeled cells that were not located in a zone of dense tdTomato neuropil labeling. We excluded these neurons in the multiple analyses resported, but their exclusion never resulted in a different outcome in our analyses.
Analysis of neuropil activity
To provide a first insight into striosomal and matrix signaling, we integrated the fluorescence signal from within an identified striosome and from a part of the matrix in the same field of view that had a similar size, background fluorescence and number of neurons. ΔF/F, calculated as ΔF/F = F t – F 0 / F 0 , was normalized by calculating z-scores relative to the signal during the last 1 s of inter-trial intervals to correct for relative differences between sessions. To determine the selectivity of responses to different task events, the area under the Receiver Operating Characteristic curves (AUROC) was calculated. For cue selectivity, we calculated the AUROC by comparing the response during high- and low-probability cues. For the selectivity to rewarded trials, we calculated the AUROC by comparing separately rewarded and unrewarded trials for the two cues.
Analysis of single-neuron activity
The conditioning task had three epochs — cue, post-reward licking, and post-licking. To identify task-modulated neurons active during these epochs, we aligned the data either to tone onset, to the first lick after reward delivery, or to the end of licking. We compared the fluorescence values over the following time windows to a 1 s baseline preceding each event. For the tone-aligned data, mean fluorescence was calculated over a 2 s time window after tone onset separately for trials with either the high- or low-probability cues. Neurons that were significantly active in either of the cue conditions were considered to be task-modulated. To find neurons modulated during the post-reward licking period, GCaMP6 fluorescence was averaged between the time when the animal first licked to receive the reward and the time that it stopped licking. We also used a 1 s time window after end of licking for identifying task-modulated neurons during this period. In some trials, animals did not stop licking until the start of the next trial. These trials were excluded from the analysis due to the difficulty in assigning licking end-time. For a neuron to be considered as task-modulated, we required that its activity exhibit a significant increase from baseline for any of the three alignments (two-sided Wilcoxon rank-sum test; α = 0.01, corrected for multiple comparisons). Neurons exclusively active during only one epoch of the task were considered to be selectively responsive during that period. Most neurons (>80%) were significantly active only during one of the epochs. To compare signals across neurons, we used z-score normalization of the ΔF/F signals with a 1 s period before the cue as a baseline. For analysis of the peak activity of task-modulated neurons, ΔF/F signals were normalized to the maximum of the session-averaged activity for any particular alignment in order to compare peak activity times during the time interval of interest. For determining the temporal specificity of responses during the post-reward licking period (rewarded trials with high-probability cue), we generated shuffled data for each neuron by substituting the response in a given trial with response in the same trial from a randomly selected task-modulated neuron recorded simultaneously. Only sessions in which at least ten task-modulated neurons were simultaneously recorded were included in this analysis. We computed a reliability index defined as the average response correlation of all pairwise combinations of trials ( Rikhye and Sur, 2015 ). In addition, we quantified the standard deviation of peak response times across trials. For these measurements, we repeated the shuffle 20 times for each neuron and calculated the mean value of the outcome of the 20 shuffled analyses as the representative metric. Significance was then computed by comparing the observed and shuffled distribution of values using a Wilcoxon rank-sum test. We also computed a ridge-to-background ratio ( Harvey et al., 2012 ), which quantifies the relative magnitude of response close to the peak time relative to all other time points during the post-reward period. The ridge was defined as the mean ΔF/F value (normalized to the max response) taken over five time points (i.e., 1 s due to the 5 Hz frame acquisition rate of our recordings) surrounding the peak time for each neuron’s session-averaged response, and the background value was the mean ΔF/F over all other time points. To determine whether reward outcome in the previous trial modulated licking behavior during the current trial, we first compared anticipatory licking in trials that were followed by either rewarded or unrewarded trials. We included all current trials, regardless of the cue or the outcome status. To examine the effect of outcome history on licking after reward delivery, we analyzed only currently rewarded trials, again ignoring the identity of the cue presented. To determine whether neural responses were modulated by previous outcome history, we computed a history modulation index (HMI) using the following formula: H M I = P r e v i o u s t r i a l r e w a r d e d − P r e v i o u s t r i a l u n r e w a r d e d P r e v i o u s t r i a l r e w a r d e d + P r e v i o u s t r i a l u n r e w a r d e d The HMI was computed from z-score values normalized by the following method. First, we took all currently rewarded trials and averaged the z-scores of ΔF/F values over a 2 s window starting 1 s after reward delivery. We chose this time window because we found that most of the task-modulated neurons were active during this period. These values were then scaled by the range of the observed responses, so that normalized values ranged from 0 to 1. Trials were then separated based on different outcome histories.
Linear regression analysis
To quantify the relationship between behavioral performance and neuronal activation, we used linear regression. For every session, we calculated the baseline licking and ΔF/F activation in the 1 s period preceding the cue onset and calculated the mean standard deviation of the baseline across trials, which we then used to calculate z-scores of the tone-evoked licking and ΔF/F activation for every trial. We then averaged the normalized tone-evoked licking and ΔF/F response across trials for both cue types for every session. Next, we performed linear regression analyses to identify a possible relationship between tone-evoked ΔF/F activation and tone-evoked licking. We performed this regression for both high- and low-probability tones and for the difference in the licking and ΔF/F responses between them. As a first step, we created separate models for striosomes and matrix in order to calculate the regression coefficients and significance for these populations separately. In order to compare striosomes and matrix more directly, we made a combined model and then quantified the residuals for striosomes and matrix. The differences in residuals were compared using a paired t-test.
Statistical analysis
We used Wilcoxon sign-rank tests to detect significant modulation of single neurons in different task epoch. ANOVA was used to evaluate interactions between multiple factors. For percentages, Fisher’s exact test was used to compare groups, and confidence intervals were calculated using binomial tests.
Histology
After the experiments, mice were transcardially perfused with 0.9% saline solution followed by 4% paraformaldehyde in 0.1 M NaKPO 4 buffer (PFA). The brains were removed, stored overnight in PFA solution at 4°C and transferred to glycerol solution (25% glycerol in tris buffered saline) until being frozen in dry ice and cut in transverse sections at 30 µm on a sliding microtome (American Optical Corporation). For staining, sections were first rinsed 3 × 5 min in PBS-Tx (0.01 M PBS + 0.2% Triton X-100), then were incubated in blocking buffer (Perkin Elmer TSA Kit) for 20 min followed by incubation with primary antibodies for GFP (Polyclonal, chicken, Abcam ab13970, 1:2000) and MOR1 (Polyclonal, goat, Santa Cruz sc-7488, 1:500). After two nights of incubation at 4°C, the sections were rinsed in PBS-Tx (3 × 5 min), incubated in secondary antibodies Alexa Fluor 488 (donkey anti-chicken, Invitrogen, 1:300) and Alexa Fluor 647 (donkey anti-goat, Invitrogen, 1:300) for 2 hr at room temperature, rinsed in 0.1 M PB (3 × 5 min), mounted and covered with a coverslip with ProLong Gold mounting medium with DAPI (Thermo Fisher Scientific). To quantify the overlap between striosomes as detected by tdTomato and MOR1 staining, we stained sections from five mice and recorded images of 2 brain sections per mouse. We manually outlined striosomes for every marker twice and calculated the percentage of pixels that were marked as striosomes and matrix. In addition, we compared the repeated outlines of the striosomes that were made using the same marker, allowing us to get a measure of test-retest error rates when outlining striosomes on the basis of tdTomato or MOR1.
Additional files 10.7554/eLife.32353.020 Transparent reporting form
📊 Figures
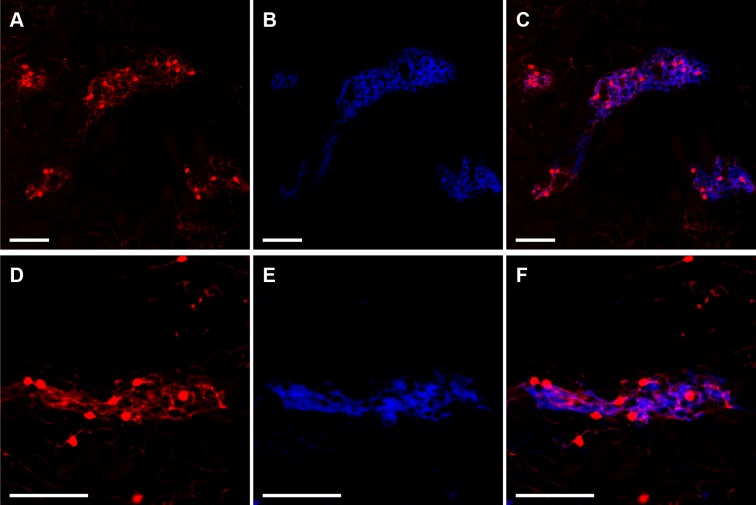
Figure 1.
Striosomes are labeled with tdTomato in Mash1-CreER;Ai14 mice that received tamoxifen at E11.5.
Images illustrate two examples (rows) of striosomal labeling of cell bodies and neuropil by tdTomato ( A,D, red) as verified by MOR1 immunostaining identifying striosomes ( B,E, blue). Merged images s...
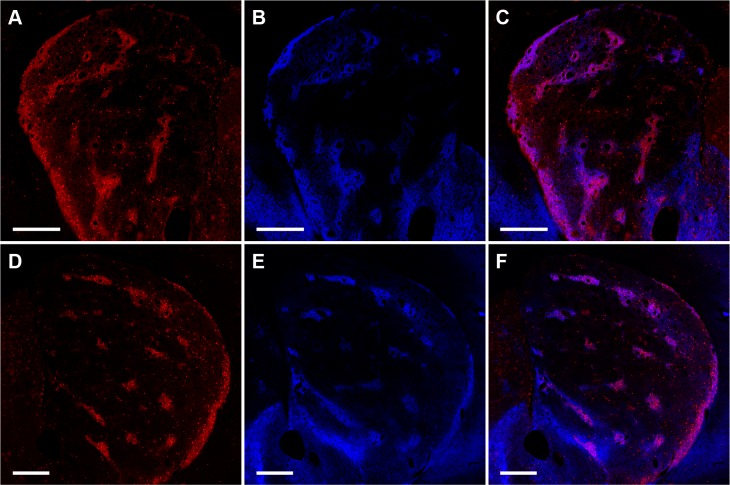
Figure 1u2014figure supplement 1.
Striosome labeling in Mash1-CreER;Ai14 mice injected with tamoxifen at E11.5.
Low-magnification images show tdTomato labeling in striosomes ( A,D , red), striosomes detected in sections immunostained for MOR1 ( B,E , blue), and overlap of the tdTomato and MOR1 signals ( C,F ). ...
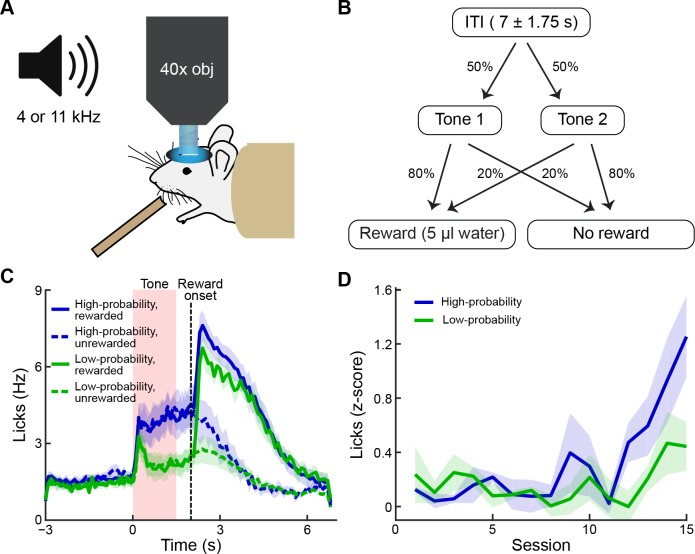
Figure 2.
Behavioral task and performance.
( A ) The striatum was imaged during conditioning sessions in which tones predicted reward delivery. ( B ) Two tones (4 and 11 kHz) were played (1.5 s duration) and were associated with distinct rewar...
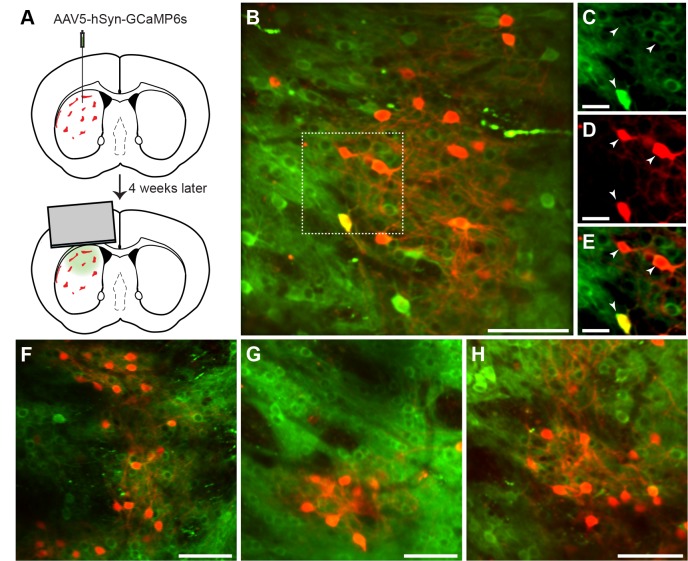
Figure 3.
In vivo 2-photon calcium imaging of identified striosomes and matrix.
( A ) Mash1-CreER;Ai14 mice were injected with AAV5-hSyn-GCaMP6s and 4 weeks later were implanted with a cannula. ( B ) Image of a striosome acquiredu00a0withu00a0the 2-photon microscope, illustrating...
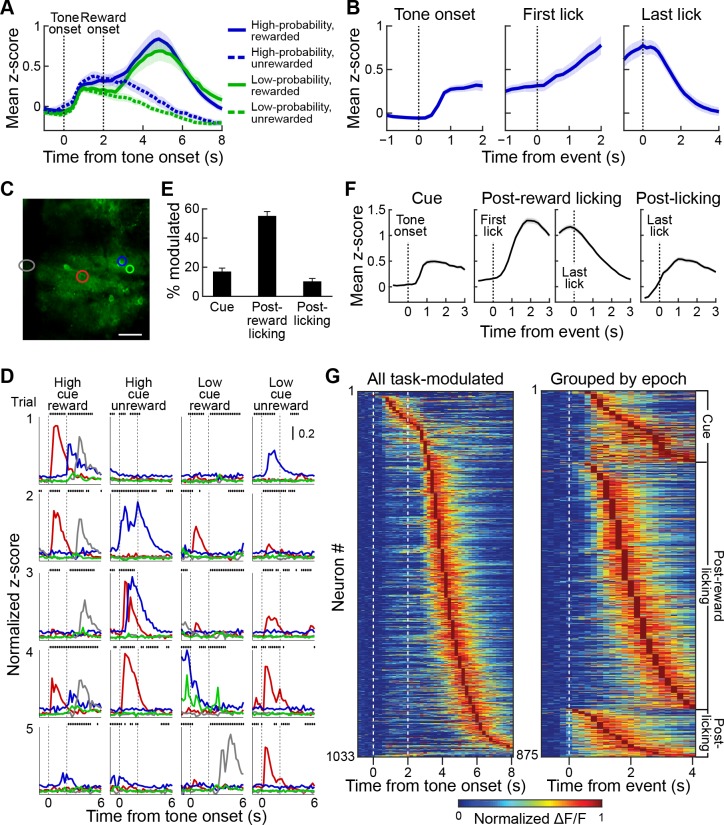
Figure 4.
Striatal activity during reward-predicting cues and during post-reward period.
( A ) Aggregate neuropil calcium signal in all four trial types (blue: high-probability cue; green: low-probability cue; solid line: rewarded trials; dotted line: unrewarded trials). Shading represent...
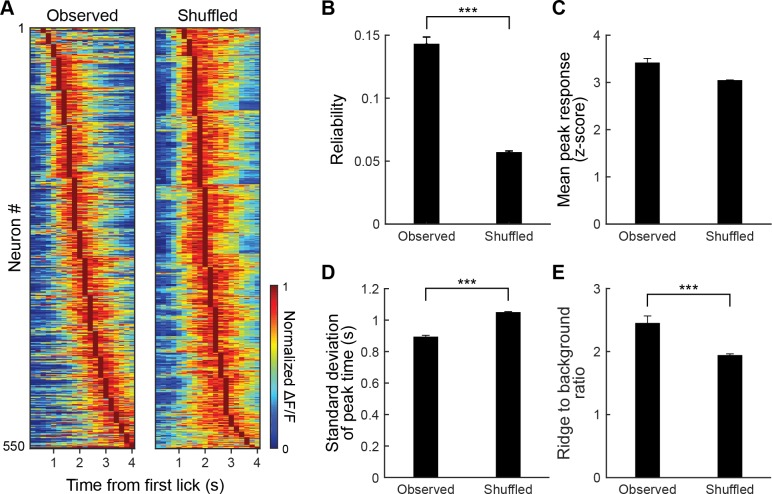
Figure 4u2014figure supplement 1.
Temporal specificity of post-reward licking responses.
( A ) Session-averaged post-reward licking responses for observed (left) and shuffled (right) data. Data were shuffled for each neuron by substituting responses in a given trial with response in the s...
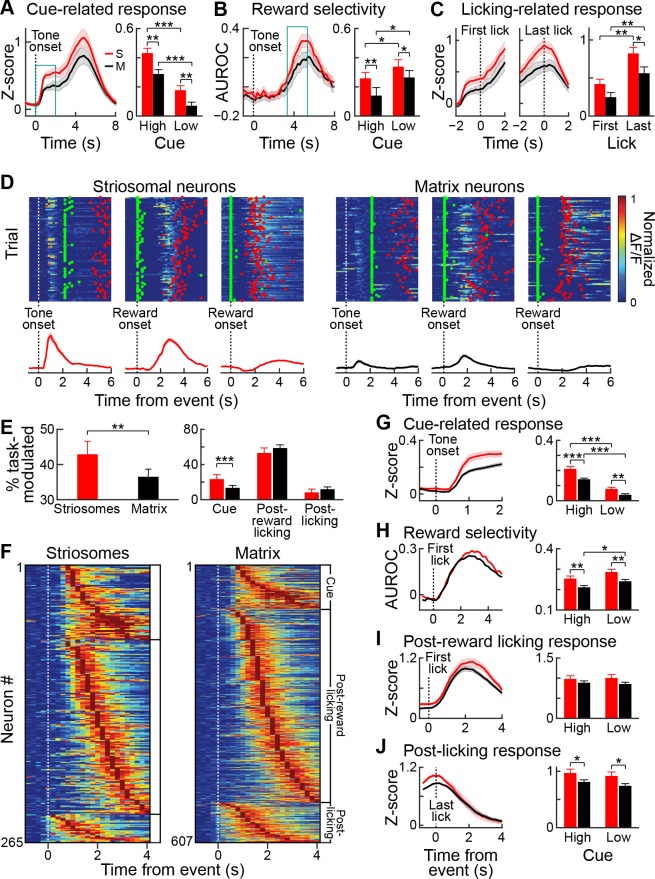
Figure 5.
Striosomal neurons respond more strongly to reward predicting cues than matrix neurons.
( A ) Average striosomal (S, red) and matrix (M, black) neuropil activation during rewarded trials with high-probability cue (left), and quantification of the magnitude of the response to high- and lo...
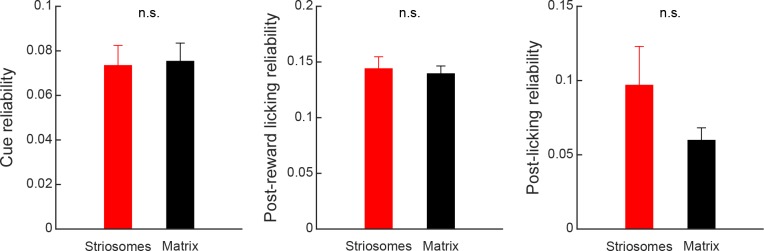
Figure 5u2014figure supplement 1.
Response reliability of task-related responses of striosomal (red) and matrix (black) neurons.
Reliability of responses during the cue (left), post-reward licking (middle), or post-licking (right) task epochs for striosomal and matrix neurons was quantified as the average correlation for all pa...
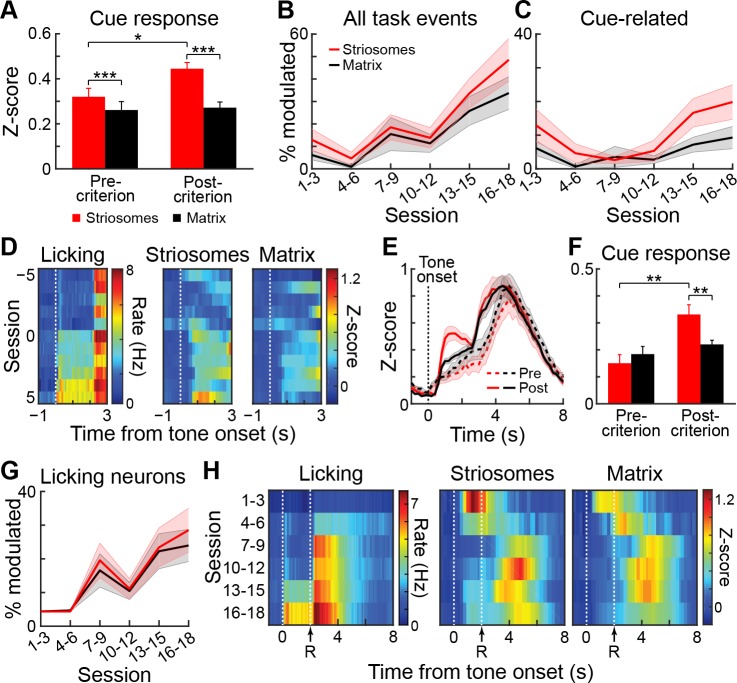
Figure 6.
Cue-related signals in striosomes develop during training.
( A ) Average total striosomal (red) and matrix (black) neuropil signal during the 1.5 s tone period in all sessions before and after reaching learning criterion. *p<0.05, ***p<0.001 (ANOVA and ...
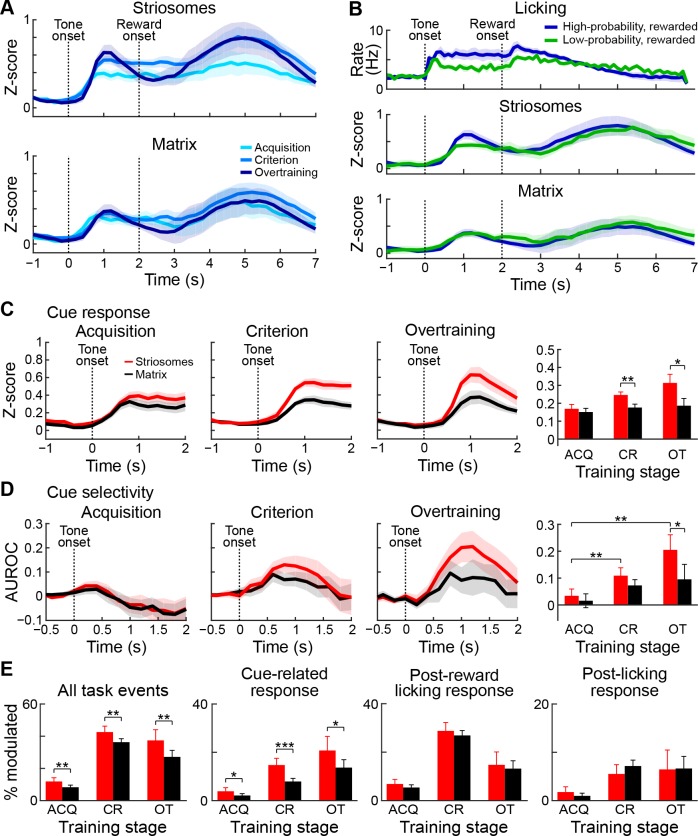
Figure 7.
Striosomal cue-related responses strengthen during overtraining and become more selective.
( A ) Mean neuropil signals during acquisition (light blue), after learning criterion (medium blue) and during overtraining (dark blue) in striosomes (top) and matrix (bottom). Shading represents SEM....
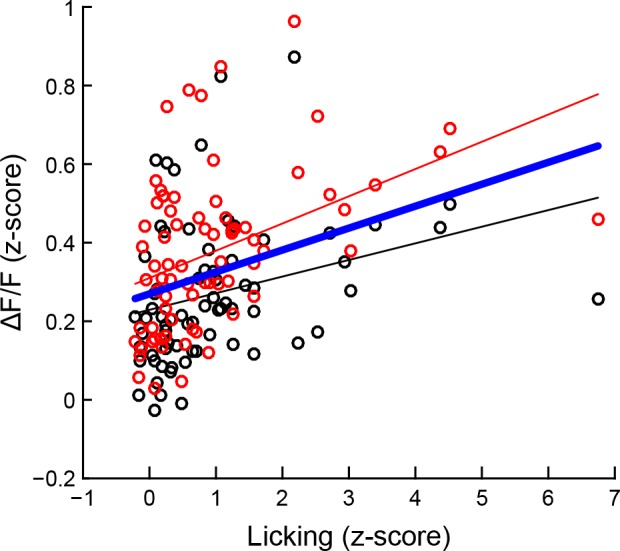
Figure 7u2014figure supplement 1.
The size of tone-evoked u0394F/F activation increases as behavioral performance improves, particularly as seen in the calcium activity in striosomes.
High-probability cues induced increases in licking and u0394F/F signal for striosomes (redu00a0circles)u00a0and matrix (blacku00a0circles)u00a0for every session. The thin red and black lines indicate ...
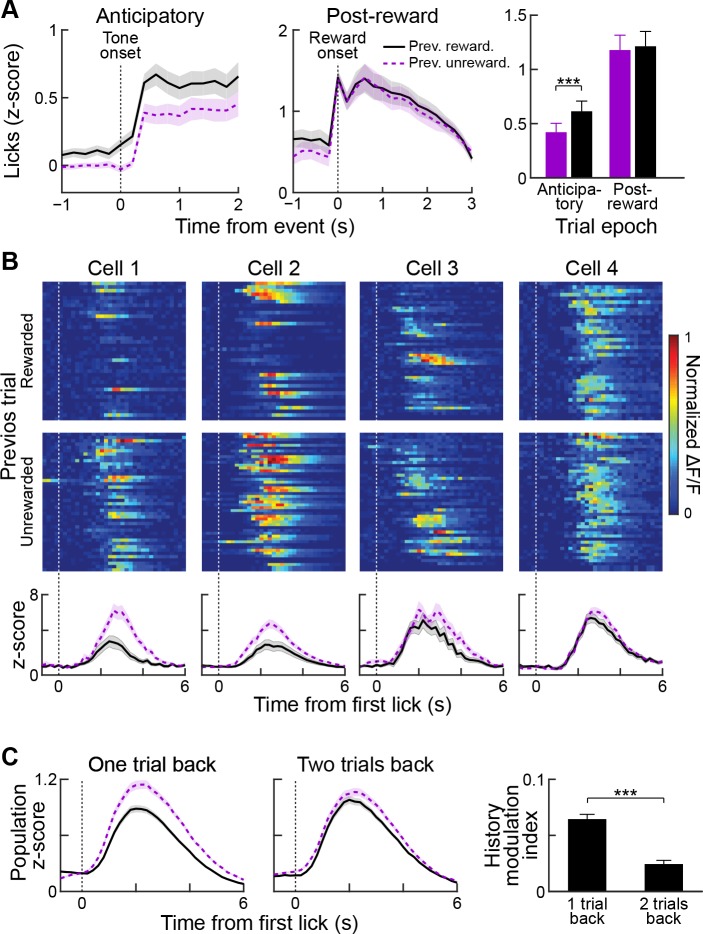
Figure 8.
Reward history modulates anticipatory licking behavior and licking-period responses in striatal neurons.
( A ) Session-averaged licking activity during anticipatory and post-reward periods for trials in which the previous trial was rewarded (black solid lines) or unrewarded (purple dotted lines). Bar plo...
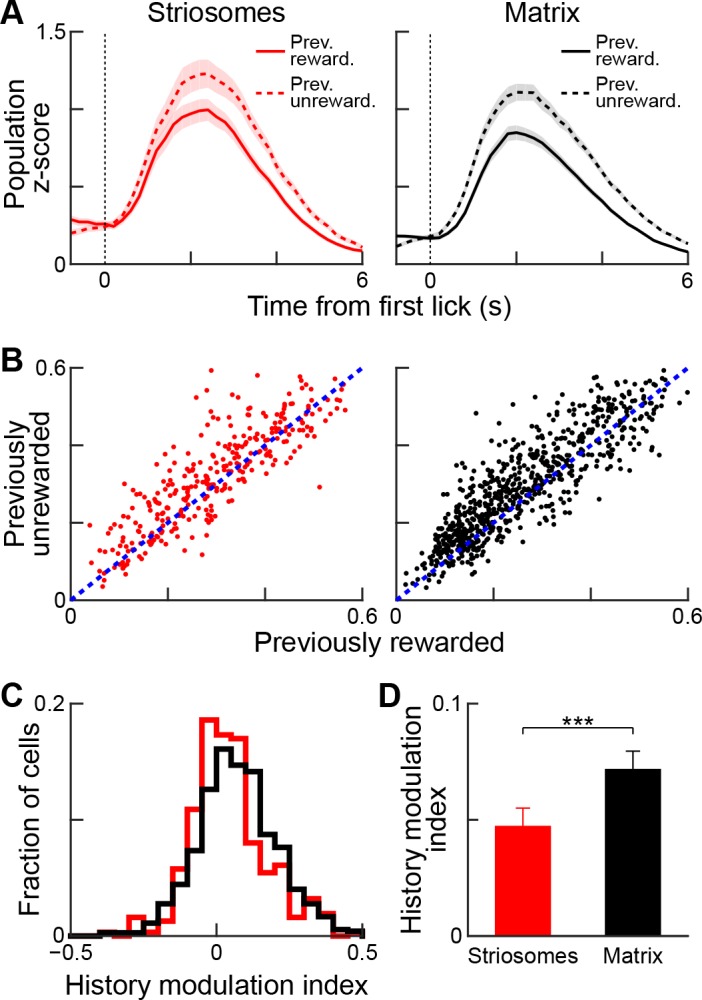
Figure 9.
Reward-history modulation of striosomal and matrix neurons.
( A ) Population-averaged responses of all task-modulated striosomal (red, left) and matrix (black, right) neurons during trials following previously rewarded (solid) or unrewarded (dotted) trials. Sh...
Figure images are served from the NIH/NLM PubMed Central Open Access Subset or Europe PMC; copyright remains with the publishers and authors.
💬 Discussion
0 commentsNo comments yet. Be the first to start a discussion!
Leave a Comment