Abstract
BACKGROUND: The engineering of functional tissues is a complex multi-stage process, the success of which depends on the careful control of culture conditions and ultimately tissue maturation. To enable the efficient optimization of tissue development protocols, techniques suitable for monitoring the effects of added stimuli and induced tissue changes are needed. METHODOLOGY/PRINCIPAL FINDINGS: Here, we present the quantitative use of two-photon excited fluorescence (TPEF) and second harmonic generation (SHG) as a noninvasive means to monitor the differentiation of human mesenchymal stem cells (hMSCs) using entirely endogenous sources of contrast. We demonstrate that the individual fluorescence contribution from the intrinsic cellular fluorophores NAD(P)H, flavoproteins and lipofuscin can be extracted from TPEF images and monitored dynamically from the same cell population over time. Using the redox ratio, calculated from the contributions of NAD(P)H and flavoproteins, we identify distinct patterns in the evolution of the metabolic activity of hMSCs maintained in either propagation, osteogenic or adipogenic differentiation media. The differentiation of these cells is mirrored by changes in cell morphology apparent in high resolution TPEF images and by the detection of collagen production via SHG imaging. Finally, we find dramatic increases in lipofuscin levels in hMSCs maintained at 20% oxygen vs. those in 5% oxygen, establishing the use of this chromophore as a potential biomarker for oxidative stress. CONCLUSIONS/SIGNIFICANCE: In this study we demonstrate that it is possible to monitor the metabolic activity, morphology, ECM production and oxidative stress of hMSCs in a non-invasive manner. This is accomplished using generally available multiphoton microscopy equipment and simple data analysis techniques, such that the method can widely adopted by laboratories with a diversity of comparable equipment. This method therefore represents a powerful tool, which enables researchers to monitor engineered tissues and optimize culture conditions in a near real time manner.
🔬 Techniques
💻 Software
✨ Fluorophores
🧪 Sample Preparation
🔬 Cell Lines
🏭 Microscope Brands
🧪 Reagent Suppliers
🔴 Lasers
📷 Detectors
🎨 Filters
💻 Software Details
🏛️ Research Organizations (ROR)
Affiliated research institutions:
📋 Methods
Methodology/Principal Findings Here, we present the quantitative use of two-photon excited fluorescence (TPEF) and second harmonic generation (SHG) as a noninvasive means to monitor the differentiation of human mesenchymal stem cells (hMSCs) using entirely endogenous sources of contrast. We demonstrate that the individual fluorescence contribution from the intrinsic cellular fluorophores NAD(P)H, flavoproteins and lipofuscin can be extracted from TPEF images and monitored dynamically from the same cell population over time. Using the redox ratio, calculated from the contributions of NAD(P)H and flavoproteins, we identify distinct patterns in the evolution of the metabolic activity of hMSCs maintained in either propagation, osteogenic or adipogenic differentiation media. The differentiation of these cells is mirrored by changes in cell morphology apparent in high resolution TPEF images and by the detection of collagen production via SHG imaging. Finally, we find dramatic increases in lipofuscin levels in hMSCs maintained at 20% oxygen vs. those in 5% oxygen, establishing the use of this chromophore as a potential biomarker for oxidative stress.
Materials and Methods
Chemicals and Media components
Chemicals, unless otherwise noted, were purchased from Sigma-Aldrich (St. Louis, MO). Propagation culture media components were purchased from Invitrogen (Carlsbad, CA).
Cell culture
Human mesenchymal stem cells were obtained from Cambrex (East Rutherford, NJ) and isolated, as previously described [64] , on tissue culture plastic at atmospheric oxygen (∼20%) and stored under liquid nitrogen as Passage 0 (P0). Subsequently, hMSCs were thawed and passaged thrice under 5% oxygen and plated for experimentation. For our studies, hMSCs were plated at a density of 150,000 cells per 35 mm dish. The base culture medium, also referred to as propagation medium, consisted of Dulbecco's Modified Eagle Medium (DMEM) without phenol red supplemented with 10% fetal bovine serum, 0.1 mM nonessential amino acids, 100 U/mL penicillin and streptomycin with a final glucose concentration of 4 g/L. To induce adipogenic differentiation, the following supplements were added to the medium: 0.5 mM 3-isobutyl-1-methyl-xanthine, 1 µM dexamethasone, 5 mg/ml insulin, and 50 mM indomethacin. For osteogenic differentiation, the propagation medium was supplemented with 100 nM dexamethasone, 10 mM b-glycerophosphate, and 0.05 mM l-ascorbic acid-2-phosphate. All experimental groups were maintained in a humidified incubator at 37 C and 5% CO 2 at either uncontrolled (atmospheric ∼20%) oxygen tension, or at 5% controlled oxygen tension. Culture medium was changed every 3 days for either 16 or 21 days. Due to the observation that cells undergoing osteogenic differentiation often peel off the culture dish [65] , [66] , hMSCs in osteogenic differentiation medium were only cultured for 16 days to ensure accurate data. Care was taken such that the 5% oxygen experimental group spent no more than 4% (∼20 hrs/22 days) of the total experiment in atmospheric oxygen including time for imaging and medium exchanges.
Show full methods section
Methodology/Principal Findings Here, we present the quantitative use of two-photon excited fluorescence (TPEF) and second harmonic generation (SHG) as a noninvasive means to monitor the differentiation of human mesenchymal stem cells (hMSCs) using entirely endogenous sources of contrast. We demonstrate that the individual fluorescence contribution from the intrinsic cellular fluorophores NAD(P)H, flavoproteins and lipofuscin can be extracted from TPEF images and monitored dynamically from the same cell population over time. Using the redox ratio, calculated from the contributions of NAD(P)H and flavoproteins, we identify distinct patterns in the evolution of the metabolic activity of hMSCs maintained in either propagation, osteogenic or adipogenic differentiation media. The differentiation of these cells is mirrored by changes in cell morphology apparent in high resolution TPEF images and by the detection of collagen production via SHG imaging. Finally, we find dramatic increases in lipofuscin levels in hMSCs maintained at 20% oxygen vs. those in 5% oxygen, establishing the use of this chromophore as a potential biomarker for oxidative stress.
Materials and Methods
Chemicals and Media components
Chemicals, unless otherwise noted, were purchased from Sigma-Aldrich (St. Louis, MO). Propagation culture media components were purchased from Invitrogen (Carlsbad, CA).
Cell culture
Human mesenchymal stem cells were obtained from Cambrex (East Rutherford, NJ) and isolated, as previously described [64] , on tissue culture plastic at atmospheric oxygen (∼20%) and stored under liquid nitrogen as Passage 0 (P0). Subsequently, hMSCs were thawed and passaged thrice under 5% oxygen and plated for experimentation. For our studies, hMSCs were plated at a density of 150,000 cells per 35 mm dish. The base culture medium, also referred to as propagation medium, consisted of Dulbecco's Modified Eagle Medium (DMEM) without phenol red supplemented with 10% fetal bovine serum, 0.1 mM nonessential amino acids, 100 U/mL penicillin and streptomycin with a final glucose concentration of 4 g/L. To induce adipogenic differentiation, the following supplements were added to the medium: 0.5 mM 3-isobutyl-1-methyl-xanthine, 1 µM dexamethasone, 5 mg/ml insulin, and 50 mM indomethacin. For osteogenic differentiation, the propagation medium was supplemented with 100 nM dexamethasone, 10 mM b-glycerophosphate, and 0.05 mM l-ascorbic acid-2-phosphate. All experimental groups were maintained in a humidified incubator at 37 C and 5% CO 2 at either uncontrolled (atmospheric ∼20%) oxygen tension, or at 5% controlled oxygen tension. Culture medium was changed every 3 days for either 16 or 21 days. Due to the observation that cells undergoing osteogenic differentiation often peel off the culture dish [65] , [66] , hMSCs in osteogenic differentiation medium were only cultured for 16 days to ensure accurate data. Care was taken such that the 5% oxygen experimental group spent no more than 4% (∼20 hrs/22 days) of the total experiment in atmospheric oxygen including time for imaging and medium exchanges.
KCN- FCCP treatments
To inhibit oxidative phosphorylation and increase the mitochondrial concentration of NADH (and decrease oxidized FP), potassium cyanide (KCN) in PBS was added to the culture medium for a final concentration of 4 mM. Addition of 4 µM (final) carbonyl cyanide 4 (trifluoromethoxy) phenylhydrazone (FCCP) was used to produce an inverse effect, decreasing the mitochondrial NADH fluorescence and increasing FP oxidation (and thus fluorescence). TPEF spectra and images at excitations of 755 nm and 860 nm were acquired before and after treatment with either KCN or FCCP. RT-PCR RNA was collected from experimental replicates on each day of imaging with the RNAeasy mini kit (Qiagen, Valencia, CA). DNA was obtained via reverse transcription using the High Capacity cDNA archive kit (Applied Biosystems, Foster City, CA) and the expression of the differentiation markers were examined relative to GapDH using commercially available primers from Applied Biosystems: lipoprotein lipase (LPL Product #Hs01012571_m1), bone sialoprotein(BSP Product #Hs00173720_m1), type 1 collagen (COL1a1 Product #Hs01076777_m1) type 2 collagen (COL2a1 Product #Hs01060345_m1) and GapDH (Product #Hs99999905_m1). Colorimetric Stains for Mineralization and Lipid Accumulation Mineral precipitation was determined by Alizarin red staining as previously described [67] . Briefly, dishes on day 16 were fixed in 10% formalin for 20 minutes, washed and stained with a 40 mM Alizarin red (pH 4.2) solution. After incubating for 30 minutes at room temperature, dishes were washed and observed under phase microscopy. To quantitatively assess the level of Alizarin red staining, dishes were incubated with 10% Acetic acid for 30 minutes after which the contents of the dish were collected into 2 mL sample tubes, vortexed, heated to 85 C for 10 minutes, cooled on ice for 5 minutes and pH neutralized with 10% ammonium hydroxide. After centrifugation (20,000 g, 15 min), the absorption of the supernatant at 405 nm was assessed in triplicate in a clear 96 well plate with a Versamax microplate reader (Molecular Devices). To assess lipid accumulation, hMSCs were stained with an Oil Red - O solution as previously described [2] . Briefly, dishes were fixed for 20 minutes in 10% formalin, washed and incubated with a fresh 60% Oil Red -O solution in DI water for 45 minutes followed by washing to remove excess stain. Stained dishes were then observed in transmission mode on a Leica DMIRE2 confocal microscope using the 543 nm laser. Oil Red - O stain was eluted from the stained dishes with pure ethanol and the absorbance at 490 nm was determined in triplicate in a clear 96 well plate with a Versamax microplate reader.
Confocal and Multiphoton microscopy
Confocal or two photon excited fluorescence
(TPEF) and second harmonic generation (SHG) micrographs were acquired on a Leica (Wetzlar, Germany) DMIRE2 microscope with a TCS SP2 scanner. The system was equipped with a 63x (NA 1.2) water immersion objective, which produced images with a 238 by 238 µm field of view. The external excitation light source was a Mai Tai tunable (710–920 nm) titanium sapphire laser emitting 100 fs pulses at 80 MHz (Spectra Physics, Mountain View CA). Samples were maintained on 35 mm culture dishes with number 1.5 cover glass bottoms (MATTEK, Ashland MA) and placed in a micro incubator (DH-35i) (Warner instruments, Hamden CT) on the microscope stage to ensure that the temperature remained at 37 C. Images and/or spectra were excited with 755 nm and, 860 nm (TPEF) or 800 nm (SHG). Fluorescence emission spectra were detected using the TCS SP2 scanner and the Leica LCS software from 400 nm to 700 nm in 20 steps with a 15 nm detector bandwidth. TPEF images were acquired simultaneously by two non-descanned PMTs with a filter cube containing a 700 nm short pass filter (Chroma SPC700bp) a dichroic mirror (495dc), and two bandpass filters centered at 455 nm (Chroma 455bp70) and 525 nm (Chroma 525bp50). SHG was collected through a filter centered at 400 nm (Chroma hq400/20m-2p). The average power measured at the sample for two photon excitation was approximately 20 mW for both 755 nm and 860 nm and 50 mW for 800 nm (SHG).
Confocal images of hMSCs stained with Lysotracker
Red (excitation 554 nm, emission 600–650 nm) or Mitotracker Orange (excitation 554 nm, emission 575–625 nm) (Invitrogen) were obtained by following the manufacturer's instructions. Analysis was performed with the Leica Confocal Software (Leica) and Matlab (Mathworks Natick MA). Correction of pixel value to fluorescence intensity Images acquired on the Leica LCS system at 8 bits per pixel were converted in Matlab from pixel value to a fluorescence intensity value so that, at a given power, changes in fluorescence intensity could be correlated linearly to changes in fluorophore concentration for a number of PMT offset and gain settings in order to compare data acquired from multiple days and experiments. This pixel fluorescence intensity to fluorophore concentration transfer function was determined for each PMT gain and offset setting used in the study using a standard curve of fluorescein solution of known concentration. The fluorescence intensity images were then normalized by the square of the excitation laser power, at the sample, to minimize day to day fluctuations in laser power. The resulting image was then presented in relative fluorescein concentration units.
Spectral analysis
TPEF emission spectra were acquired with the Leica LCS software as a series of 20 images spanning 400 to 700 nm in 15 nm increments. The cellular TPEF emission spectra for each microscopic field was extracted from these images, after conversion to concentration units and manual selection of a region of interest (ROI) containing the cells and rejecting most of the (non-cell) background. The resulting 20 point arbitrary concentration units vs wavelength (nm) spectrum was then interpolated to 301 points (400–700 nm) and smoothed with a 40 point moving average. Linear unmixing of the spectra was accomplished using the ALS script from the PLS 3.5 Matlab toolbox (Eigenvector Research, Wenatchee WA). This script uses an alternating least squares algorithm to optimize the fit to spectral data given at a minimum the number of spectral components and initial guesses about either the relative weight or spectral shape of the components [68] , [69] . To identify the spectral components of fluorescence, interpolated and smoothed TPEF emission spectra were normalized to a maximum value of 1. First, TPEF emission spectra (ex 755 nm and 860 nm) from cells with no apparent bright punctuate fluorescence were unmixed with non-negativity constraints and no initial guess of spectral component shapes. The two resulting components were then used to analyze the TPEF emission spectra from cells containing bright punctuate auto fluorescence in order to find any additional spectral components of fluorescence. This was accomplished by supplying the two found components as strict values, and additional (up to 3) components as unknowns, all with non-negativity constraints and equal initial weights. In this manner it was found that the spectral analysis was most meaningful when attempted with three basis components, the two acquired from the initial cell analysis and a third component that was prominent in cells with bright punctuate fluorescence.
Image analysis
The collagen content in SHG images was estimated as previously described [70] . Briefly, SHG images were converted to binary format after using an adaptive threshold and collagen density was displayed as a percent value of “on” pixels in the SHG image. Prior to analysis, TPEF images were converted from pixel values to arbitrary concentration units as described above. Random noise was suppressed via a 2 by 2 median filter. A three color (RGB) concentration image was then calculated from the data obtained at 755 and 860 nm TPEF excitation such that the pixel by pixel calculated concentration of each fluorophore, NAD(P)H, FP and Lipofuscin was stored in the red, green, and blue channels respectively. To isolate the contributions from each of the fluorophores in the TPEF images, and calculate the concentration images it was assumed that NAD(P)H was not excited at 860 nm, lipofuscin contributed to both 455 nm and 525 nm channels at 755 and 860 nm excitations and that FP fluorescence contributed to the 455 nm channel regardless of excitation wavelength.
Imaging an aqueous solution of FAD
(Sigma) confirmed that there was minimal FP fluorescence crosstalk (2%) between the 455 nm and 525 nm channels. The concentrations of each fluorophore were determined based on the procedure described below. Lipofuscin fluorescence was the major contributor to the 455 nm channel at 860 nm excitation. A binary morphological mask (MASK) was then created using the data in the 455 nm channel at 860 nm excitation such that the MASK represented the location of the lipofuscin fluorescence determined as all pixels with a value above a threshold of 5 (2% of 255 for 8 bit images) to eliminate the maximum possible FP contribution to the 455 nm channel. Multiplication of the remaining images by the MASK (lipofuscin fluorescence was represented by a 0, and all other pixels by a 1), served to morphologically eliminate the lipofuscin fluorescence in these images. This was possible because lipofuscin fluorescence is limited to the lysosomes (as confirmed by colocalization studies described below). The FP concentration image could therefore be determined from the 525 nm channel at 860 nm excitation. Similarly, the NAD(P)H concentration was determined from the 455 nm channel at 755 nm where the FP contribution is negligible. The mean concentration of each fluorophore per cell was determined by hand-defining an ROI outlining each cell and calculating the mean concentration for each channel (RGB:NAD(P)H, FP, Lipofuscin). As an estimate of cellular metabolic activity, the redox ratio was calculated as: The redox ratio was determined on a cell by cell basis from the data obtained as described above.
Statistics
Differences in reported mean values were tested for significance using a two tailed students t-test to a p value of 0.05 or less, unless otherwise noted.
📊 Figures
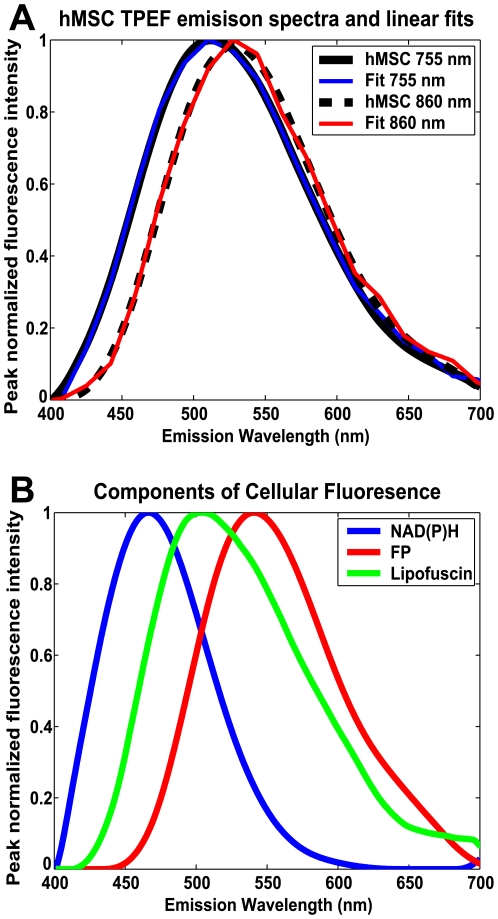
Figure 1
Components of hMSC TPEF emission spectra.
(A) hMSC TPEF emission spectra collected at either 755 nm or 860 nm excitation with corresponding fits by the ALS script. (B) linear unmixing methods reveal the contributing cellular fluorophores to b...
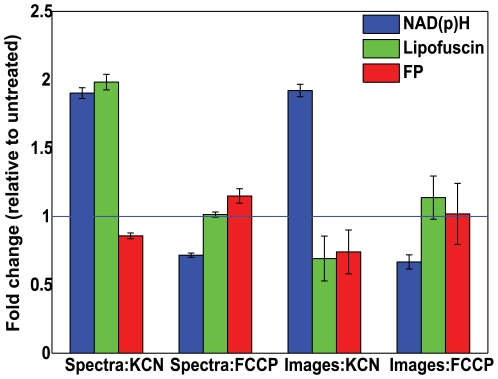
Figure 2
TPEF analysis of hMSCs following KCN or FCCP treatment.
The inverse fluctuations of NAD(P)H and FP fluorescence in response to KCN or FCCP treatment were detectable via either TPEF emission spectra excited at 755 nm, or TPEF images excited at 755 nm and 86...
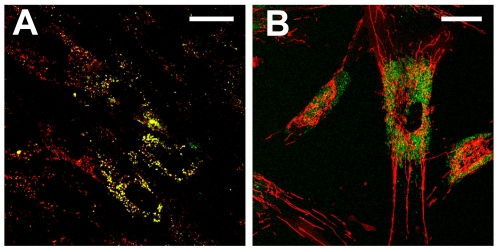
Figure 3
Lysosomal localization of lipofuscin.
Lipofuscin autofluorescence (green channel) is co-localized with (A) Lysotracker red (red channel) and not (B) Mitotracker Orange (red channel). Co-localization is indicated by the yellow color in pan...
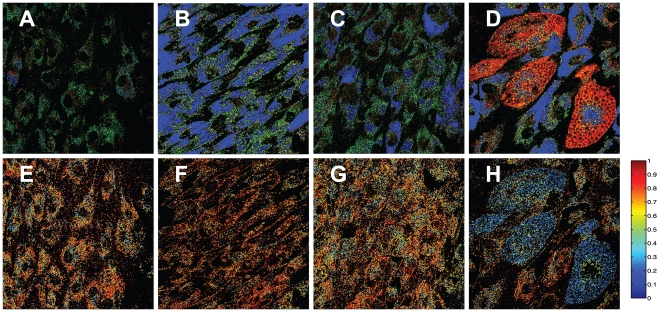
Figure 4
Concentration and redox ratio images of hMSCs.
Representative false color concentration images (Au2013D) and corresponding redox ratio images (Eu2013H) from HP (A,E), NP (B,F), NO (C,G) and NA (D,H). In the concentration images, NAD(P)H, FP and li...
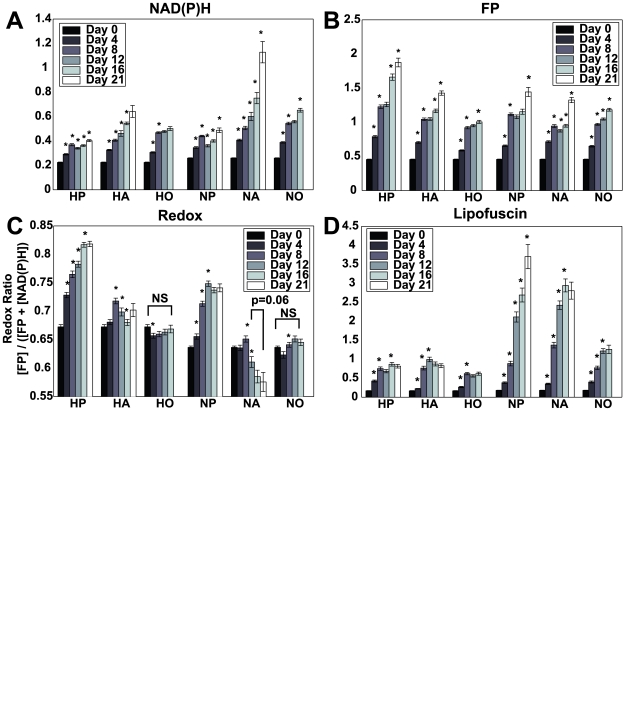
Figure 5
Quantitative monitoring of hMSC intrinsic fluorescence.
The mean concentration (in relative fluorescein concentration units) of (A) NAD(P)H, (B) FP, and (D) Lipofuscin per cell was monitored over 16 or 21 days and is presented with standard error. To evalu...
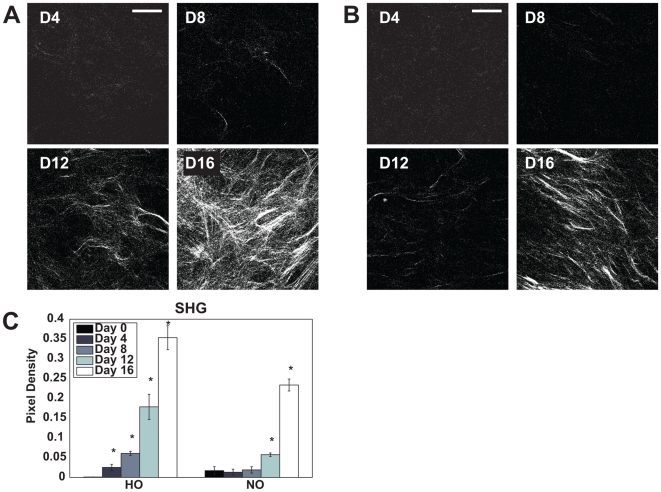
Figure 6
SHG evaluation of fibrous collagen.
The gradual deposition of fibrous collagens is apparent in SHG images acquired on days 4, 8,12 and 16 from hMSCs in osteogenic medium at (A) 5% oxygen and (B) 20% oxygen. Quantitative evaluation of pi...
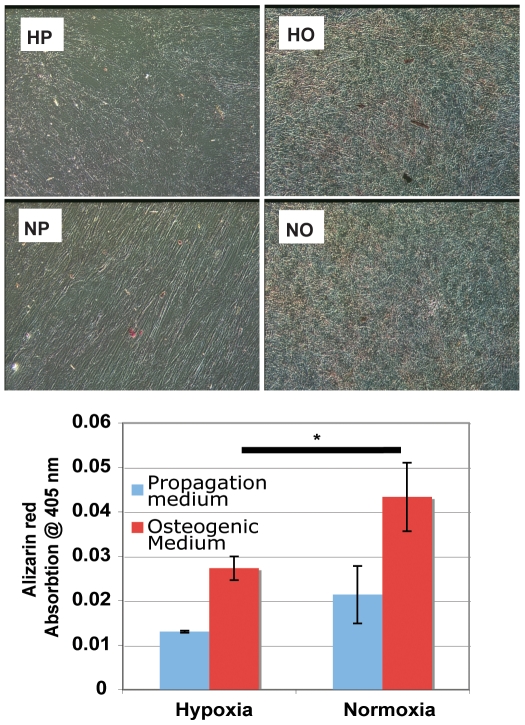
Figure 7
Alizarin Red Mineralization Assay.
Only small, diffusely distributed mineral deposits are detected in phase contrast images of stained cultures that are more prominent in hMSCs in osteogenic differentiation than in propagation media. Q...
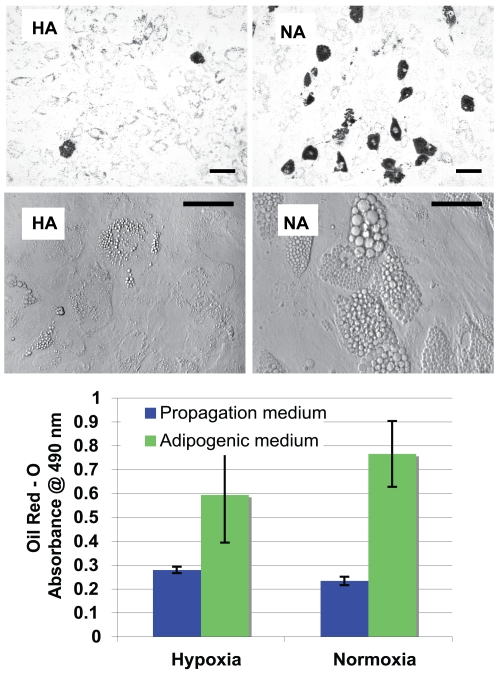
Figure 8
Oil Red - O Staining for lipid droplets.
hMSCs maintained in adipogenic differentiation medium were stained with Oil Red - O to highlight the lipid contents of cells (top images, bar u200a=u200a100 u00b5m). Higher magnification transmission ...
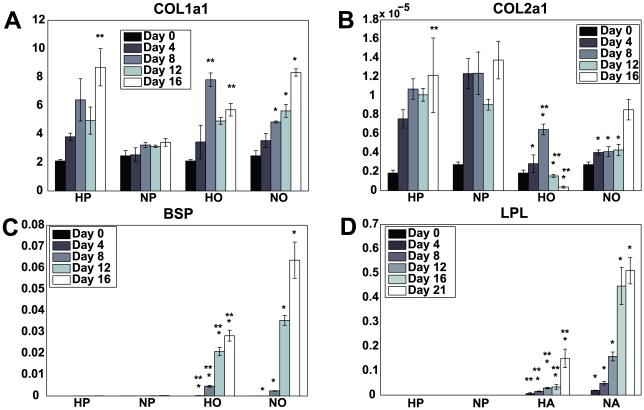
Figure 9
RT-PCR.
Transcript levels of COL 1a1, COL 2a1, BSP and LPL were assessed for each imaging time point relative to GAPDH. Statistically significant differences in mRNA transcript levels are denoted by a single ...
Figure images are served from the NIH/NLM PubMed Central Open Access Subset or Europe PMC; copyright remains with the publishers and authors.
💬 Discussion
0 commentsNo comments yet. Be the first to start a discussion!
Leave a Comment