Abstract
AbstractThe original approach to calculating diffusion coefficients of a fluorescent probe from Fluorescence Recovery After Photobleaching (FRAP) measurements assumes bleaching with a circular laser beam of a Gaussian intensity profile. This method was used without imaging the bleached cell. An empirical equation for calculating diffusion coefficients from a rectangular bleaching geometry, created in a confocal image, was later published, however a single method allowing the calculation of diffusion coefficients for arbitrary geometry does not exist. Our simulation approach allows computation of diffusion coefficients regardless of bleaching geometry used in the FRAP experiment. It accepts a multiple-frame TIFF file, representing the experiment as input and simulates the (pure) diffusion of the fluorescent probes (2D random walk) starting with the first post-bleach frame of the actual data. It then fits the simulated data to the real data and extracts the diffusion coefficient. We validate our approach using a well characterized diffusing molecule (DiIC18) against well-established analytical procedures. We show that the algorithm is able to calculate the absolute value of diffusion coefficients for arbitrary bleaching geometries, including exaggeratedly large ones. It is provided freely as an ImageJ plugin and should facilitate quantitative FRAP measurements for users equipped with standard fluorescence microscopy setups.
🔬 Techniques
🔭 Microscopes
💻 Software
✨ Fluorophores
🧪 Sample Preparation
🏭 Microscope Brands
🧪 Reagent Suppliers
📷 Detectors
🔎 Objectives
💻 Software Details
🏛️ Research Organizations (ROR)
Affiliated research institutions:
📋 Methods
Cell Culture
All reagents were purchased from Biological Industries (Kibbutz Beit Haemek, Israel) unless otherwise noted. Normal mouse fibroblasts (ATCC CCL-1.3) were cultured in 250 ml TC flasks (Cellstar, GrenierBio-One, Frickenhausen, Germany) at 37 °C and 5% CO 2 in Dulbecco’s Modified Eagle Medium (DMEM) with L-glutamine, 10% fetal bovine serum and 1% Pen-strep solution. For mounting, flasks were washed with 10 ml of phosphate buffer saline (PBS) and then incubated in 2 ml trypsin EDTA 0.25% at room temperature until detachment from the flask (about 2 min). 7.5 × 10 5 cells were plated on homemade glass bottom (#1 cover-slide) 50 mm diameter Petri dish, in 5 ml medium, and incubated overnight. Staining 0.934 mg of 1,1_-dioctadecyl-3,3,3′,3′-tetramethylindocarbocyanine perchlorate (DiI), specifically DiIC 18 (3) (Molecular probes, Eugene, Oregon, USA) were dissolved in 1 mL of Ethanol to prepare a 1 mM Stock solution. For staining of cells, a 2.5 μM staining solution was prepared by adding 2.5 μL bulk solution to 1 mL serum-free growth medium. Following overnight incubation, growth medium was removed from Petri dishes and 500 μL of DiI staining solution were added, followed by 1 hour incubation at 0 °C. The dishes were then washed 3 times with 5 ml normal growth medium, allowing for 5 minutes incubation at 37 °C and 5% CO 2 between washes. Before imaging, growth medium was removed and dishes were gently rinsed 3 times with 5 ml warm (37 °C) Hepes Hank’s balanced salt solution.
Imaging
Cells were imaged with a Hamamatsu C9100-50 cooled EM-CCD camera on an Axiovert-200 M microscope (Zeiss, Germany) with Plan-Neofluar 63x/NA 1.4 objective. The microscope is fitted with a UltraView ERS FRET-H- Spinning Disc Confocal system (Perkin-Elmer, Waltham, MA, USA) with a FRAP module. DiI was bleached using the 488 nm laser line from an Argon ion laser, with varying bleaching time (depending on bleaching pattern and cell intensity).
📊 Figures
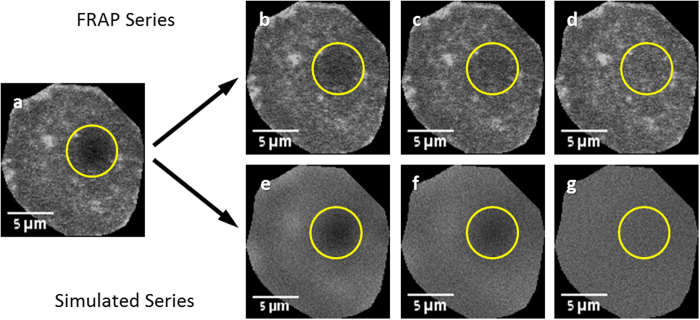
Figure 1
FRAP recovery series and its corresponding simulated recovery ( a ) the first post-bleach frame is used as the basis of the simulated recovery. ( b u2013 d ) Images from the actual FRAP series showing...
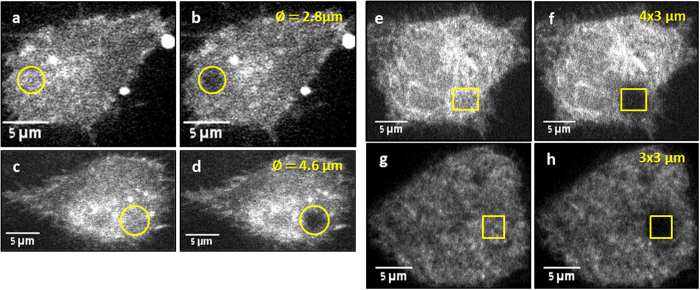
Figure 2
Different bleaching patterns of DiI stained CCL-1.3 cells Two examples of circular beam bleaching pattern ( a u2013 d ), before bleaching ( a , c ) and after bleaching ( b , d ); beam diameter is spec...
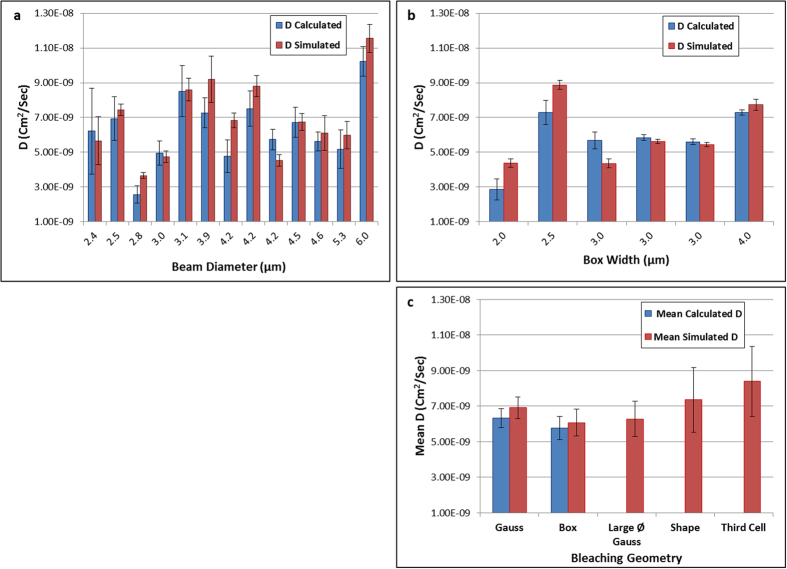
Figure 3
Comparison of Calculated and Simulation Extracted Diffusion Coefficient ( a ) Results of 13 single experiments using circular bleaching; the beam diameter is the value extracted from the post-bleach f...
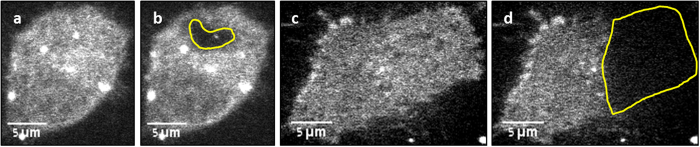
Figure 4
Examples of Arbitrary Shape Bleaching Patterns Before and after images of DiI stained CCL 1.3 cells ( a , b ) Bleaching a random shape pattern included within the cell. ( c , d ) Bleaching about a thi...
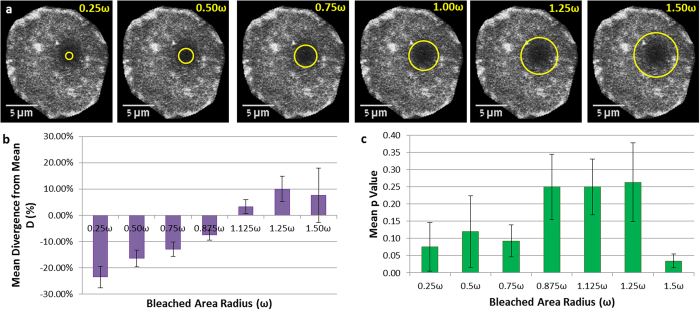
Figure 5
Effects of Selected Monitored Area on D ( a ) Images showing the different radii of selection circles, from 0.25u2009u03c9 to 1.5u2009u03c9 overlaid on the bleached area. ( b ) Mean Divergence of D as...
Figure images are served from the NIH/NLM PubMed Central Open Access Subset or Europe PMC; copyright remains with the publishers and authors.
💬 Discussion
0 commentsNo comments yet. Be the first to start a discussion!
Leave a Comment