Abstract
AbstractG protein–coupled receptors (GPCRs), including dopamine receptors, represent a group of important pharmacological targets. An increased formation of dopamine receptor D2 homodimers has been suggested to be associated with the pathophysiology of schizophrenia. Selective labeling and ligand-induced modulation of dimerization may therefore allow the investigation of the pathophysiological role of these dimers. Using TIRF microscopy at the single molecule level, transient formation of homodimers of dopamine receptors in the membrane of stably transfected CHO cells has been observed. The equilibrium between dimers and monomers was modulated by the binding of ligands; whereas antagonists showed a ratio that was identical to that of unliganded receptors, agonist-bound D2 receptor-ligand complexes resulted in an increase in dimerization. Addition of bivalent D2 receptor ligands also resulted in a large increase in D2 receptor dimers. A physical interaction between the protomers was confirmed using high resolution cryogenic localization microscopy, with ca. 9 nm between the centers of mass.
🔬 Techniques
💻 Software
✨ Fluorophores
🧪 Sample Preparation
🔬 Cell Lines
🏭 Microscope Brands
🧪 Reagent Suppliers
🔴 Lasers
📷 Detectors
🎨 Filters
💻 Software Details
💾 Data Repositories
🏛️ Research Organizations (ROR)
Affiliated research institutions:
📋 Methods
Organic synthesis and characterization of ligands Detailed schemes and conditions for the synthesis of the ligands 1b,c , 2b,c , 4a,b and 5a,b are provided in Supplementary Figs S11 to S16 . Detailed methods and characterization for all compounds and precursors are provided in Supplementary Note S4 . Plasmid constructions A plasmid coding for the N -terminally SNAP-tagged human dopamine D 2L receptor (SNAP-D 2L ) was generated by replacing the β 2 AR coding region of a pSNAP f -β 2 adrenergic receptor (SNAP-β 2 AR) (New England Biolabs). The human D 2L receptor was PCR amplified using primers designed to add SbfI and XhoI sites to the fragment termini. This was then ligated into the multiple cloning site downstream of SNAP-coding sequence in the plasmid pSNAP f . The absence of unwanted mutations was confirmed by sequencing. The construct was functional, as shown by radioligand binding and cAMP concentration-response curves. SNAP-CD86 and SNAP-CD28 were generated by exchange of D 2L of the SNAP-D 2L plasmid against CD86 and CD28, respectively. Plasmids coding for YFP-CD86 (human CD86 - truncated at R277) and CD28-YFP (YFP - F46L_L68V, human CD28 - truncated at R185) were kindly provided by Martin Lohse (Institute of Pharmacology and Toxicology and Bio-Imaging Center, University of Würzburg, Würzburg, Germany). CD86 or CD28 were PCR amplified and ligated into the plasmid pSNAP f described above.
Generation of stable CHO-K1 cell lines Chinese hamster ovary cells
(CHO-K1) were cultured in DMEM/F-12, supplemented with 10% FCS, 1% penicillin-streptomycin, 2 mM L-glutamine at 37 °C and in the presence of 5% CO 2 . For the generation of the stable cell line expressing SNAP-D 2 L , SNAP-CD86 or SNAP-CD28, CHO-K1 cells seeded in 6-well dishes and grown to 50% confluence were transfected with Mirus TransIT ® -2020 (MoBiTec), following the manufacturer’s protocol. After 48 h, the medium was changed to medium supplemented with 1200 μg ml −1 geneticin G418 (Gibco) to initiate selection of antibiotic-resistant cells. Several resistant clones were isolated by limiting dilution, and characterized for the SNAP-D 2L receptor by radioligand saturation experiments. The protein expression of the CD86 and CD28 was validated by TIRF microscopy. For the maintenance of stably transfected cell lines, the concentration of G148 was reduced to 800 μg ml −1 geniticin G418 to prevent the reversion of transfected CHO-K1 cells to a non-transfected state.
Show full methods section
Organic synthesis and characterization of ligands Detailed schemes and conditions for the synthesis of the ligands 1b,c , 2b,c , 4a,b and 5a,b are provided in Supplementary Figs S11 to S16 . Detailed methods and characterization for all compounds and precursors are provided in Supplementary Note S4 . Plasmid constructions A plasmid coding for the N -terminally SNAP-tagged human dopamine D 2L receptor (SNAP-D 2L ) was generated by replacing the β 2 AR coding region of a pSNAP f -β 2 adrenergic receptor (SNAP-β 2 AR) (New England Biolabs). The human D 2L receptor was PCR amplified using primers designed to add SbfI and XhoI sites to the fragment termini. This was then ligated into the multiple cloning site downstream of SNAP-coding sequence in the plasmid pSNAP f . The absence of unwanted mutations was confirmed by sequencing. The construct was functional, as shown by radioligand binding and cAMP concentration-response curves. SNAP-CD86 and SNAP-CD28 were generated by exchange of D 2L of the SNAP-D 2L plasmid against CD86 and CD28, respectively. Plasmids coding for YFP-CD86 (human CD86 - truncated at R277) and CD28-YFP (YFP - F46L_L68V, human CD28 - truncated at R185) were kindly provided by Martin Lohse (Institute of Pharmacology and Toxicology and Bio-Imaging Center, University of Würzburg, Würzburg, Germany). CD86 or CD28 were PCR amplified and ligated into the plasmid pSNAP f described above.
Generation of stable CHO-K1 cell lines Chinese hamster ovary cells
(CHO-K1) were cultured in DMEM/F-12, supplemented with 10% FCS, 1% penicillin-streptomycin, 2 mM L-glutamine at 37 °C and in the presence of 5% CO 2 . For the generation of the stable cell line expressing SNAP-D 2 L , SNAP-CD86 or SNAP-CD28, CHO-K1 cells seeded in 6-well dishes and grown to 50% confluence were transfected with Mirus TransIT ® -2020 (MoBiTec), following the manufacturer’s protocol. After 48 h, the medium was changed to medium supplemented with 1200 μg ml −1 geneticin G418 (Gibco) to initiate selection of antibiotic-resistant cells. Several resistant clones were isolated by limiting dilution, and characterized for the SNAP-D 2L receptor by radioligand saturation experiments. The protein expression of the CD86 and CD28 was validated by TIRF microscopy. For the maintenance of stably transfected cell lines, the concentration of G148 was reduced to 800 μg ml −1 geniticin G418 to prevent the reversion of transfected CHO-K1 cells to a non-transfected state.
Cell culture Chinese hamster ovary cells
(CHO-K1) stably expressing the human dopamine D 2L 48 , D 2S 48 receptor, the SNAP-D 2L receptor or the SNAP-CD86 and SNAP-28 proteins were maintained in DMEM/F12 medium supplemented with 10% FCS, 2 mM L-glutamine, 1%, penicillin-streptomycin, and 800 μg mL −1 geneticin. Dihydrofolate reductase gene-deficient CHO-K1 cells stably expressing human D 3 receptors (D 3 ) 49 were grown in DMEM medium containing 4.5 g L −1 glucose, supplemented with 10% heat-inactivated dialyzed FBS, MEM amino acid supplement, 2 mM L-glutamine and 1%, penicillin-streptomycin. All cells were grown at 37 °C and in 5% CO 2 .
Membrane preparation
Membrane preparations were obtained using the methods described previously 50 . In brief, CHO cells stably expressing the D 2L , D 2S , D 3 or SNAP-D 2L were washed with 10 mL ice cold phosphate-buffered saline (PBS, pH 7.4), treated with harvest buffer (10 mM Tris-HCl, 0.5 mM EDTA, 5.4 mM KCl, 140 mM NaCl, pH 7.4), and dissociated using a cell scraper. Subsequently they were pelleted at 200 g for 8 min at 4 °C and resuspended in 10 mL of ice cold homogenate buffer (50 mM Tris-HCl, 5 mM EDTA, 1.5 mM CaCl 2 , 5 mM MgCl 2 , 5 mM KCl, 120 mM NaCl, pH 7.4). Cell suspensions were then lysed using an Ultraturrax (20000 rpm, 5 times for 5 s) and centrifuged at 50000 g for 15 min. After resuspending the membranes in the binding buffer (50 mM Tris-HCl, 1 mM EDTA, 5 mM MgCl 2 , 100 μg mL −1 bacitracin, 5 μg mL −1 soybean trypsin inhibitor, pH 7.4) they were homogenized with a glass−Teflon homogenizer for 7 min at 4 °C. The homogenized membranes were shock-frozen in liquid nitrogen and stored at −80 °C until usage. The protein concentration was determined by the Lowry method 51 using bovine serum albumin as a standard. Receptor binding studies Receptor binding studies were carried out as described previously 27 50 52 . The radioligand [ 3 H]spiperone (specific activity 80.6 Ci mmol −1 ) (Perkin Elmer) was used in saturation experiments to determine the K d and B max values for the membrane preparations of stably transfected CHO cells expressing the human D 2L , D 2S 48 , D 3 49 and SNAP-D 2L receptors, respectively,. The K i values for the compounds were obtained by competition experiments. In brief, the assay were carried out in the 96-well plates at protein concentration of 1–8 μg assay −1 tube in a final volume of 200 μL and [ 3 H]spiperone at final concentrations of 0.125–0.200 nM for D 2L , D 2S , D 3 and SNAP‐D 2L receptors. The K D values of [ 3 H]spiperone for D 2L , D 2S , D 3 and SNAP-D 2L receptors, were 0.053–0.085, 0.067–0.120, 0.095–0.180 and 0.110–0.130 nM respectively, and the corresponding B max values were in the range of 610–640, 1500–4800, 4200–6450 and 2000–2100 fmol mg −1 .
Data analysis for receptor binding studies
Analysis of the saturation experiments were performed using a nonlinear regression analysis of the data for the determination of K D and B max values using PRISM (GraphPad Software). Competition curves were fitted to a sigmoid curve by nonlinear regression analysis in which the log IC 50 value and the Hill coefficient were free parameters. IC 50 values were transformed to K i values according to the equation of Cheng and Prusoff 53 .
Adenylyl cyclase inhibition assay Bioluminescence based cAMP-Glo™ assays
(Promega) were performed according to the manufacturer’s instructions. Briefly, CHO cells stably expressing the D 2L or SNAP-D 2L receptor were seeded into a white half-area 96-well plate (5000 cells well −1 ) 24 h prior to the assay. On the days of the assays cells were washed with phosphate buffered saline (PBS, pH 7.4) to remove traces of serum and incubated with various concentrations of compounds in the presence of 20 μM forskolin in serum-free medium that contained 500 μM IBMX and 100 μM Ro 20–1724, pH 7.4. After 15 min of incubation at 25 °C cells were lysed with cAMP-Glo lysis buffer, the kinase reaction was performed with a reaction buffer containing PKA and finally an equal volume of Kinase-Glo reagent was added. Bioluminescence was read on a microplate reader Victor 3 V (Perkin-Elmer). The experiments were performed at least three times per compound. D 2L receptor activation Ligand-induced activation of the human D 2L receptors was studied employing inositol phosphate (IP) accumulation assays as described 54 55 . Briefly, HEK 293 cells were transiently co-transfected with cDNA encoding for D 2L and the hybrid G protein Gα qi5 (Gα q protein with the last five amino acids at the C terminus replaced by the corresponding sequence of Gαi; gift from the J. David Gladstone Institutes). Twenty-four hours after transfection, cells were transferred into 24-well plates. After adding myo -[ 3 H]inositol (specific activity = 22.5 Ci mmol −1 , PerkinElmer) and incubation for 15 h, medium was aspirated, the cells were washed with serum-free medium supplemented with 10 mM LiCl, and test compounds 37 °C. Then, cells were lysed by adding 0.1 M NaOH. After neutralization with formic acid, the cell extract was separated by anion-exchange chromatography using an AG1-X8 resin (Bio-Rad) by washing and finally eluting total IP directly into scintillation counting vials. Radioactivity was determined by scintillation counting in a Beckman LS 6500 (Beckman). Data were analyzed by normalizing disintegrations per minute (d.p.m.) values; this was done by setting the data for non-stimulated receptor (buffer) equal to zero and the effect for quinpirole equal to 100%. Glass slide cleaning 18 mm no. 1 glass slides (Assistent) were extensively cleaned to remove any background fluorescence. First, they were sonicated in a solution containing 12% Decon 90 for 1 h. After three washes with Milli-Q filtered water, they were further sonicated in a solution of 5 M NaOH for 1 h and were washed again three times with Milli-Q filtered water. Glass slides were then dried followed by sonication in chloroform for 1 h. Cleaned glass slides were dried and stored in 100% ethanol until use.
Labeling and preparation for single-molecule
TIRF-M imaging 24 h before the TIRF-experiment dried and cleaned glass slides were placed in a 12 well plate and were coated by incubation with 20 μg ml −1 fibronectin (Sigma–Aldrich) in sterile PBS for 1 h at 37 °C. After coating, fibronectin was aspirated and the glass surface was rinsed one time with sterile PBS. CHO cells expressing SNAP-D 2L , SNAP-CD86, SNAP-CD28, D 2L , D 2S or D 3 receptors were seeded on coated glass slides in phenol-red-free DMEM/F12 supplemented with 10% FCS and were allowed to adhere overnight at 37 °C and 5% CO 2 .
SNAP-tag labeling
Cells were washed two times with phenol red-free DMEM/F12 supplemented with 10% FBS and were labeled 30 min at 37 °C with 1 μM Alexa546-BG (SNAP-Surface ® Alexa Fluor ® 546; New England Biolabs). Subsequently, cells were washed three times with phenol red-free DMEM/F12 supplemented with 10% FBS, each time followed by 5 min incubation at 37 °C. For the ligand treatment experiments, the indicated concentration of the corresponding ligand in phenol red-free DMEM/F12 supplemented with 10% FBS were added to stably transfected CHO cells, which were ready for imaging, for 1 h before imaging.
Fluorescent-ligand labeling
Cells were washed two times with phenol red-free DMEM/F12 supplemented with 10% FBS, labeled with a 10-fold K i value concentration of the corresponding fluorescent ligand ( Supplementary Table S1 ) and incubated ( 1c , 2c and 4a,b at 37 °C, 5% CO 2 and 5a,b at room temperature) for 1 h. Specific labeling of the fluorescent ligands was confirmed by pre-incubation with 10 μM spiperone (a potent non-fluorescent dopamine D 2 receptor antagonist) for 2 h, followed by incubation with fluorescent ligand described above. Subsequently after labeling, cells were washed three times with phenol red-free DMEM/F12 supplemented with 10% FBS. Glass slides with labeled cells were placed in a custom-built imaging chamber (volume = 500 μL). washed two times with imaging buffer (137 mM NaCl, 5.4 mM KCl, 2.0 mM CaCl 2 , 1.0 mM MgCl 2 , and 10 mM Hepes, pH 7.4). Finally the imaging chamber was refilled with fresh imaging buffer and mounted immediately on a microscope stage for TIRF-M imaging.
TIRF-M imaging system
Experiments were performed at room temperature (24.0 ± 0.3 °C) on a motorized Nikon TI-Eclipse inverted microscope equipped with a 100x, 1.49 NA oil-immersion objective. Fluorescent dyes were excited using a Nikon D-Eclipse C1 laser box with 561 nm laser for TIRF microscopy. Excitation filter at 561/14 nm employing dichroic long-pass mirror (cut-off wavelength 561 nm) was used. The emitted light was passed through emission bandpass filter 609/54 nm (Semrock Rochester), and was projected onto a water-cooled (Polar Series Accel 250 LC, Thermo Scientific) EM-CCD camera (512 × 512 FT, DU-897, Andor) to −98 °C. The microscope control and image acquisition were performed by the NIS Elements software (Nikon Instruments). To ensure homogenous illumination, only the central quarter of the chip (300 × 300 pixel) was used for imaging analysis. The gain of the EM-CCD camera was set and kept constant at 300, binning at 1 × 1, BitDepth at 14 bits, readout speed at 10 MHz and image sequences (300–500 frames, except 1000 frames for photobleaching experiments) were acquired with an exposure time of 50 ms, resulting in the frame rate of 19.32 fps (frames per second). Under these conditions a representative photobleaching half-life time t 1/2 of 6.23 ± 0.43 (mean ± s.d.) was determined for Alexa564 labeled SNAP-D 2L receptors ( Supplementary Fig S3c ) The evanescent penetration depth was calculated as ~80 nm.
Data analysis for the TIRF-M imaging
The image analysis procedures have been described in detail previously 9 56 57 . An automated single particle tracking (ASPT) algorithm 58 implemented in custom-written software, GMimPro ( www.mashanov.uk ), was used to identify and track individual fluorescent spots on sequential video frames. ASPT settings used were FWHM300nm, R5, L20, Q10 and C999. Output from this image analysis gave fluorophore centroid positions (with 25 nm precision), integrated fluorophore intensities, total fluorophore number and trajectory lifetime. Spatial trajectories and intensity trajectories (i.e. intensities vs. time) were then further analysed to determine: the lateral diffusion coefficient, D lat , which was derived from averaged mean squared displacement (MSD) versus time interval (δt), the average fluorescent spot density (spot μm − 2 ) and distribution across the cell membrane and the intensity distribution of individual fluorescent spots and intensity fluctuation with time as well as the lifetime of colocalization. The D lat was measured for each cell separately and the average value (average D lat , mean ± standard deviation (s.d.)) was calculated for an indicated number of cells. Slow-moving objects D lat < 0.02 μm 2 s −1 were excluded from the analysis and only cells with a mobile trajectory fraction (trajectories with a D lat > 0.02 μm 2 s −1 ) over 0.75 were used for further analysis. Intensity distributions of fluorescent spots identified over the first 10-frame time window of TIRF illumination were fitted with a sum of Gaussian distributions (with standard deviation proportional to square root of intensity level) using the PRISM routine. The ratio of the areas under the Gaussian curves was calculated to give the percentage of the underlying component 57 . Unpaired two-tailed Student´s t-tests were used for statistical significance.
Determination of the SNAP-tag labeling efficiency
CHO cells stably expressing the SNAP-D 2L receptor were seeded on fibronectin (20 μg ml −1 ) pre-coated 3.5 cm CELLview™ cell culture dishes with an integrated glass bottom (Greiner, surface treatment TC) with a density of 1 × 10 5 cells and incubated overnight in phenol-red-free DMEM/F12 supplemented with 10% FBS. Medium was removed and the cells were labeled with increasing concentrations of Alexa564-BG (0–3 μM) as described above. An adequate amount of randomly chosen cells ( n = 15–30) per concentration was imaged by TIRF-microscopy. One image sequences of 5 frames cell −1 was acquired with an exposure time of 50 ms. Further imaging settings were kept identical as described above. Brightfield images were captured and used as a guide for non- or weakly-labeled cells. Kinetic fluorescent ligand binding studies For live-cell kinetic experiments to characterize the association and dissociation kinetics of fluorescent ligands, CHO cells stably expressing the SNAP-D 2L receptor were prepared as described above for the determination of the SNAP-tag labeling efficiency.
Determination of the association rate
Medium was replaced by fresh DMEM/F12 supplemented with 10% FBS and the fluorescent ligand was added at a concentration representing a 10-fold K i value. The whole cell fluorescence at 37 °C was measured at times up to 210 min.
Determination of the dissociation rate
Medium was replaced by fresh DMEM/F12 supplemented with 10% FBS and the fluorescent ligand was added at a concentration representing 10-fold K i value and incubation was continued for 60 min at 37 °C to reach equilibrium binding. Subsequently, the cell culture dishes were placed on the microscope stage and the incubation medium was replaced by spiperone with a final concentration of 5 μM in imaging buffer. The moment of spiperone addition was considered at t = 0 min and bound fluorescent ligand to a whole cell was imaged at multiple time intervals post t = 0 min (5 min to 340 min). An adequate amount of cells was imaged at each time interval by TIRF-microscopy. Calculation of the background corrected mean fluorescence intensity of single cells and analysis Calculation of the mean background corrected fluorescence intensity I(t) (arbitrary units) at time t of single cells for live cell kinetic, SNAP-tag labeling efficiency and photobleaching experiments were performed as follows. Regions of interest (ROI) were drawn around the membrane of an individual fluorescent cell (ROI cell ) and the background (ROI background ) outside the cell using Fiji software 57 ( Supplementary Fig. S1b ). The total mean intensity over the entire cell area ( I(t) total cell ) and the mean intensity over the background area ( I(t) bg ) were measured and I(t) were calculated as I(t) = I ( t ) total cell − I ( t ) bg . Data were imported into PRISM and were fitted as stated for each condition by a one-phase association curve for ≥11 cells from three independent experiments per condition. The output provided the rate constant ( k ), the time constant τ (mean fluorescent lifetime) and the half-life time (t 1/2 ) defined as k −1 and ln2 k −1 , respectively.
Labeling and preparation for cryogenic localization microscopy
Fused silica cover slips (7.0 × 7.0 × 0.2 mm, UV grade, Siegert Wafer GmbH) were cleaned by sonication using detergents (deionized water and soap “Frosch”), and alternating rinsing with deionized water and sonication in non-halogenated solvents (acetone, ethanol, 2-propanol, in that order) followed by sonication in Piranha solution (1:1 SO 4 and 30% H 2 O 2 ). Afterwards, the cover slips were stored in deionized water before a treatment in 5% hydrofluoric acid (HF) for 5 min in order to increase adherence of the cells to the cover slips. The cover slips were then dried with nitrogen (5N) and again rinsed with deionized water and ethanol before usage. The clean and dry HF-treated fused silica slides were then coated with fibronectin like the coating procedure described above (Labeling and preparation for single-molecule TIRF-M imaging). CHO cells stably expressing SNAP-D 2L and SNAP-CD86 receptors, respectively, were seeded on coated glass slides in phenol-red-free DMEM/F12 supplemented with 10% FCS and were allowed to adhere overnight at 37 °C and 5% CO 2 . Hypoosmotic stress conditions to induce membrane protrusion formation were attained by incubation in hypo-osmotic PBS (108 mOsm) for 2 h at 37 °C and 5% CO 2 . After incubation, the cells were labeled with Alexa546-BG like the SNAP-tag labeling procedure described above. To exclude artefacts from the HF treatment, the above described procedure, but with 20 min in 5% HF to account for slower etching of borosilicate glass compared to fused silica, was applied to 18 mm, no. 1 glass slides (Assistent) (TIRF-M slides) which were employed for TIRF-M control experiments with CHO cells, stably expressing the SNAP-D 2L receptor and labeled with Alexa546-BG.
Cryogenic localization microscopy imaging setup
A schematic drawing of the experimental setup is shown in Supplementary Fig. S4 . The experiments were performed on a homebuilt epi-fluorescence microscope. A Coherent Sapphire OPSL laser (λ = 532 nm) was coupled into a polarization maintaining fiber for beam clear up before it was out-coupled and collimated. A 532-10 band pass excitation filter was used for spectral clear up. The polarization was then adjusted using two wave plates, so that the light is circularly polarized before the microscope objective. A wide-field lens (f = 400 mm) focused the laser beam via a 4f telescope (f = 350 mm) into the backfocal plane of the microscope objective (Zeiss Neofluar 63x LWD, 0.75 NA). A glass wedge at low angle of incidence (about 5°) was used as a beam splitter. The sample is mounted in the vacuum chamber of a liquid helium flow cryostat (Janis ST-500) on a copper cold finger and cooled to liquid helium temperature (T = 4.3 K). The laser power was adjusted to about 5 mW before the microscope objective. The fluorescence is detected in epi-mode. A 538 long pass filter is used as detection filter before an f = 300 mm lens focuses the light on the EM-CCD camera (Andor iXon 897). Movies were recorded at a frame rate of 20 fps in frame transfer mode with EM gain = 2400. Data analysis for the cryogenic localization microscopy The 3B analysis was performed using the ImageJ PlugIn provided by Rosten et al . 59 . Relatively large data sets (50 × 50 px up to 70 × 70 px, 1000 frames) were processed using default settings and measured values for the PSF FWHM. The analysis ran for >200 iterations to ensure convergence (runtime >7 days on an i7 3.4 GHz workstation). We then calculated pairwise distances (Euclidian metric) from the identified positions. These histograms were corrected by subtracting a simulated histogram that was constructed in the following way: The same number of emitters was randomly placed on a three-dimensional cylinder of 150 nm diameter 60 and the accumulated membrane protrusion length. Pairwise distances were then histogrammed after computing a two-dimensional projection.
Dimer modeling
As a starting structure, our recently described homology model of the D 2 receptor based on the D 3 crystal structure was used 61 . The Swiss-PdbViewer 62 was used to place a SNAP protomer (PDB 3KZY) in different positions on the N -terminal side of the D 2 receptor model with its C-terminus allocated to the receptor. Missing residues, including unresolved SNAP residues, four additional linker residues and unresolved N -terminal D 2 residues were modelled manually. The loop was created and refined by means of the Swiss-PdbViewer loop database. The dimer models were generated by superimposing two identical SNAP-D 2 protomers with the crystal structure of the β 1 -AR dimer (PDB 4GPO) 63 . Subsequently, the resulting dimer models were submitted to energy minimization as described previously 61 . The figure was prepared using UCSF Chimera package 1.10 47 .
Supplementary Material Supplementary Information Supplementary Movie S1 Supplementary Movie S2 Supplementary Movie S3 Supplementary Movie S4
📊 Figures
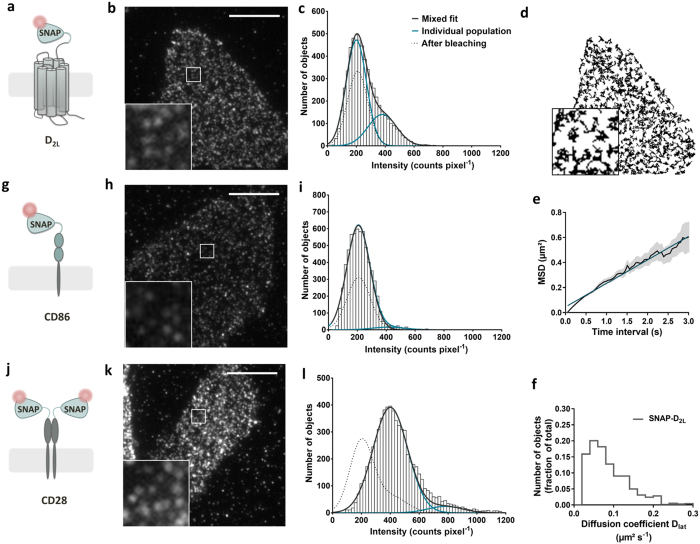
Figure 1
Visualization, tracking and analysis of the dimerization of single SNAP-tagged D 2L receptors using SNAP-CD86 and SNAP-CD28 as monomeric and dimeric reference proteins.
( a,g,j ) Schematic representation of the SNAP-tagged constructs. ( b,h,k ) Representative images of single CHO cells, stably transfected with the corresponding labeled protein and visualized by TIRF-...
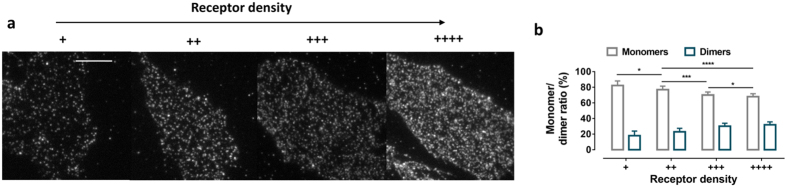
Figure 2
Dependence of the distribution of monomers and dimers on receptor density.
( a ) Representative receptor density level: + 0.38u2009u00b1u20090.016 spots u03bcm u22122 (meanu2009u00b1u2009s.d., 8u2009cells), ++ 0.52u2009u00b1u20090.039 spots u03bcm u22122 (meanu2009u00b1u2009...
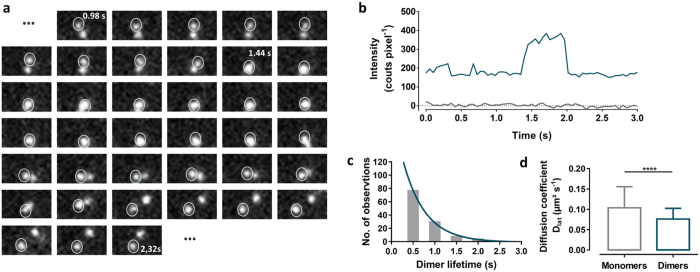
Figure 3
Transient dimer formation of SNAP-D 2L receptors.
( a ) 48 sequential frames of two Alexa546-labeled SNAP-D 2L receptors showing transient dimer formation (frame rate of 19.32u2009fps) (also shown in Supplementary Movie S3 ). ( b ) Intensity profile ...
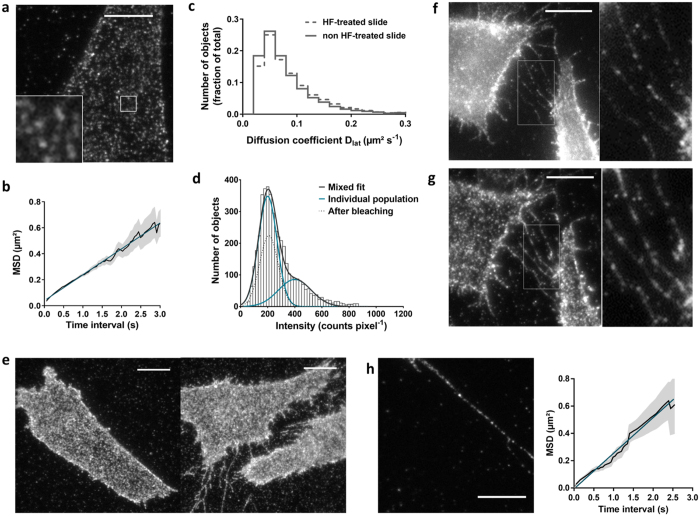
Figure 4
Visualization, diffusion and dimerization of Alexa546-labeled SNAP-D 2L receptors and on membrane protrusions using HF-treated slides.
( a ) Representative images of a single CHO cell stably expressing the SNAP-D 2L receptor and seeded on HF-treated glass slides, labeled with Alexa546-BG and visualized by TIRF-M. The insert correspon...
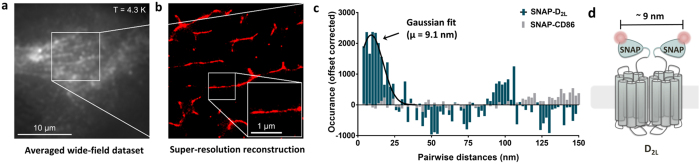
Figure 5
Cryogenic localization microscopy of SNAP-D 2L receptor dimers.
( a ) Averaged wide-field dataset of a recording of a CHO cell stably expressing labeled SNAP-D 2L . ( b ) Super-resolution reconstruction after 3B analysis of the area indicated by the white square i...
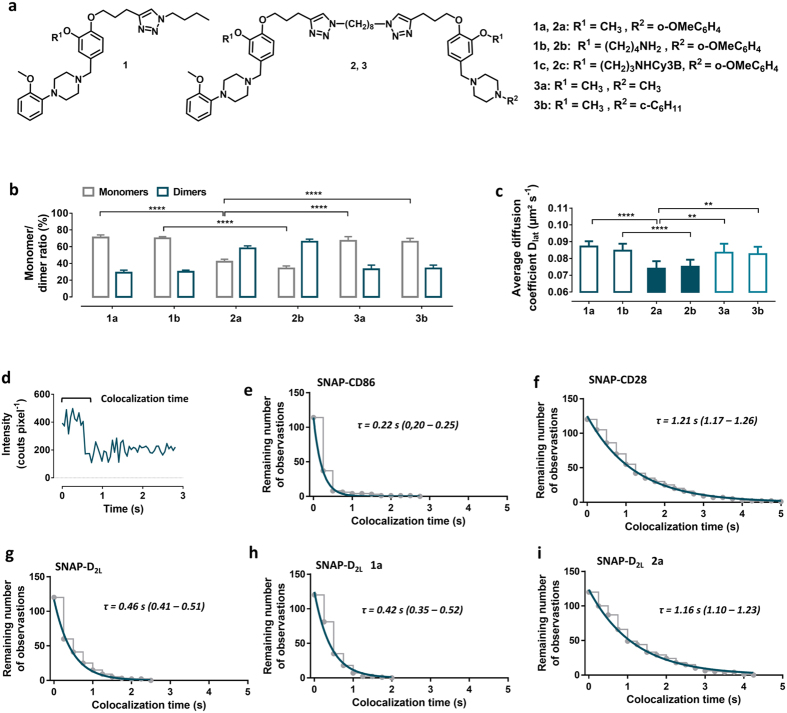
Figure 6
Influence of monovalent (1a,b), bivalent (2a,b) and bivalent control (3a,b) dopamine D 2 receptor antagonists on receptor dimerization.
( a ) Chemical structures of monovalent ligands ( 1au2013c ), bivalent ligands ( 2au2013c ), and control ligands ( 3a,b ). ( b ) Monomer/dimer ratios calculated from fitted fluorescence intensity dist...
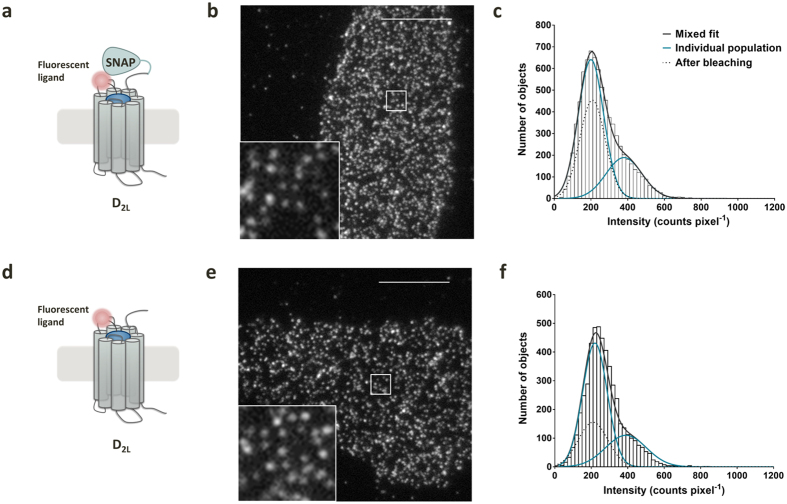
Figure 7
Visualization, tracking and analysis of the dimerization of single SNAP-tagged D 2L receptors and wild-type D 2L receptors labeled with the fluorescent antagonist 1c.
( a,d ) Schematic representation of the constructs. ( b,e ) Representative images of single CHO cells stably transfected with the two constructs, labeled and visualized by TIRF-M. Spot densities were ...
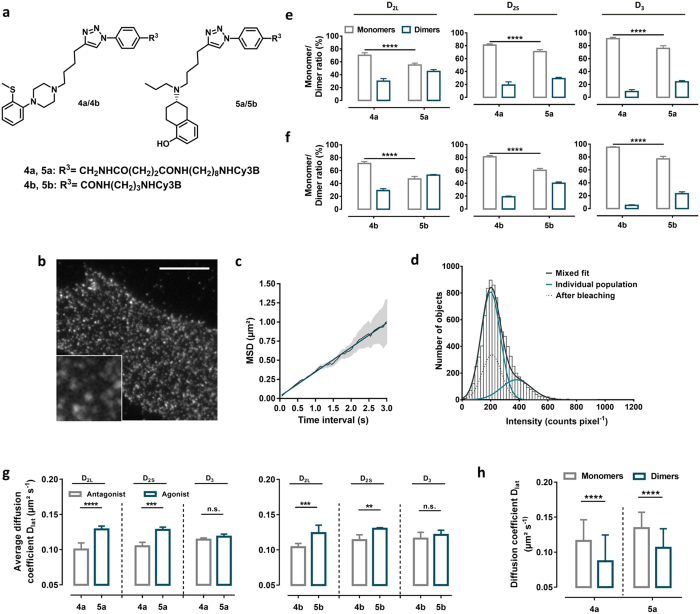
Figure 8
Influence of antagonists (4a,b) and agonists (5a,b) on D 2L , D 2S and D 3 receptor dimerization.
( a ) Chemical structures of monovalent fluorescent antagonists ( 4a,b ) and agonists ( 5a,b ). ( b ) Representative images a single CHO cell stably expressing the D 2L receptor, labeled with 4a (38u2...
Figure images are served from the NIH/NLM PubMed Central Open Access Subset or Europe PMC; copyright remains with the publishers and authors.
💬 Discussion
0 commentsNo comments yet. Be the first to start a discussion!
Leave a Comment