Abstract
AbstractVolumetric imaging allows global understanding of three-dimensional (3D) complex systems. Light-sheet fluorescence microscopy and optical projection tomography have been reported to image 3D volumes with high resolutions and at high speeds. Such methods, however, usually rely on fluorescent labels for chemical targeting, which could perturb the biological functionality in living systems. We demonstrate Bessel-beam-based stimulated Raman projection (SRP) microscopy and tomography for label-free volumetric chemical imaging. Our SRP microscope enables fast quantitation of chemicals in a 3D volume through a two-dimensional lateral scan. Furthermore, combining SRP and sample rotation, we demonstrate the SRP tomography that can reconstruct the 3D distribution of chemical compositions with optical spatial resolution at a higher speed than the Gaussian-beam-based stimulated Raman scattering sectioning imaging can. We explore the potential of our SRP technology by mapping polymer particles in 3D volumes and lipid droplets in adipose cells.
🔬 Techniques
🧪 Sample Preparation
🔬 Cell Lines
🏭 Microscope Brands
💻 Software Details
🏛️ Research Organizations (ROR)
Affiliated research institutions:
📋 Methods
Selection of the objective lenses
For different purposes, we generated Bessel beams using different objectives lenses, including a × 10 0.3 NA air objective (RMS10X-PF, Thorlabs), a × 40 0.8 NA water immersion objective (LUMPlanFLN × 40, Olympus), a × 60 1.1 NA water immersion objective (LUMFI × 60, Olympus) and a × 25 1.05 NA water immersion objective (XLPL25XWMP, Olympus). The × 10 objective was employed to verify the simulation results, since the Bessel beam generated by this objective had a larger profile for easy measurement and characterization ( Supplementary Fig. 1 ). The × 40 objective was used for the SRP microscopic imaging of polymer particles and biological samples, since it allowed for a tighter focusing and hence generating the stronger SRP signal ( Supplementary Fig. 16 ). The × 60 objective, which allowed even higher signal to be generated ( Supplementary Fig. 16 ), was used in the SRP tomographic imaging of polymer particles and biological samples. The × 25 objective was used for imaging a larger volume ( Supplementary Fig. 13 ). The detailed comparisons of the Bessel beams generated by the four objectives are listed in Supplementary Table 1 .
Sample holder for the SRP tomography
A lab-built sample holder was used to hold and rotate samples 22 . For the SRP microscopic imaging, the sample holder was comprised of a microscope slide holder and a 3D translational stage. The slide holder (MAX3SLH, Thorlabs) was used to hold the sample fixed between two slides or in a cuvette. The 3D translational stage was used to fine tune the sample position at the focus of the Bessel beams. In the SRP tomographic imaging, three more components were added, including a fibre holder, a rotational stage and an additional 3D translational stage. A cylindrical capillary tube, with one end attached to the fibre holder, while the other inserted into a square capillary tube, was used to store samples. The square capillary tube was attached to the slide holder to confine the sample during rotation. The cylindrical capillary tube was rotated while being confined in the square tube. The projection imaging was performed within the boundary of the square capillary tube. The fibre holder (FPH-S, Newport) was attached to the rotational stage installed on a 3D translational stage for position adjustment. The sample rotation was performed by electronically controlling the rotational stage to rotate at 1° per step for 180°. An SRP image was acquired at each rotational step.
Show full methods section
Selection of the objective lenses
For different purposes, we generated Bessel beams using different objectives lenses, including a × 10 0.3 NA air objective (RMS10X-PF, Thorlabs), a × 40 0.8 NA water immersion objective (LUMPlanFLN × 40, Olympus), a × 60 1.1 NA water immersion objective (LUMFI × 60, Olympus) and a × 25 1.05 NA water immersion objective (XLPL25XWMP, Olympus). The × 10 objective was employed to verify the simulation results, since the Bessel beam generated by this objective had a larger profile for easy measurement and characterization ( Supplementary Fig. 1 ). The × 40 objective was used for the SRP microscopic imaging of polymer particles and biological samples, since it allowed for a tighter focusing and hence generating the stronger SRP signal ( Supplementary Fig. 16 ). The × 60 objective, which allowed even higher signal to be generated ( Supplementary Fig. 16 ), was used in the SRP tomographic imaging of polymer particles and biological samples. The × 25 objective was used for imaging a larger volume ( Supplementary Fig. 13 ). The detailed comparisons of the Bessel beams generated by the four objectives are listed in Supplementary Table 1 .
Sample holder for the SRP tomography
A lab-built sample holder was used to hold and rotate samples 22 . For the SRP microscopic imaging, the sample holder was comprised of a microscope slide holder and a 3D translational stage. The slide holder (MAX3SLH, Thorlabs) was used to hold the sample fixed between two slides or in a cuvette. The 3D translational stage was used to fine tune the sample position at the focus of the Bessel beams. In the SRP tomographic imaging, three more components were added, including a fibre holder, a rotational stage and an additional 3D translational stage. A cylindrical capillary tube, with one end attached to the fibre holder, while the other inserted into a square capillary tube, was used to store samples. The square capillary tube was attached to the slide holder to confine the sample during rotation. The cylindrical capillary tube was rotated while being confined in the square tube. The projection imaging was performed within the boundary of the square capillary tube. The fibre holder (FPH-S, Newport) was attached to the rotational stage installed on a 3D translational stage for position adjustment. The sample rotation was performed by electronically controlling the rotational stage to rotate at 1° per step for 180°. An SRP image was acquired at each rotational step.
Characterization of the SRP microscope
To measure the dependence of the SRP signal and the noise on sample thickness and laser power, we used PDMS films with different thicknesses. The sample was prepared by sandwiching PDMS between two glass slides. The PDMS film thickness ranged from 130 to 1,040 μm, with a 130 μm increment. The SRP signal from 2,915 cm −1 CH 3 bond vibration was measured ( Supplementary Fig. 17a ). The thickness dependence measurements in Fig. 4a were acquired at a 200 μs pixel dwell time. The central lobe powers of the pump and Stokes beams were 0.9 and 6.3 mW, respectively. Signal from the sample was calculated by the average voltage difference between the presence and the absence of the sample. The laser power dependence measurements in Fig. 4b–d were measured using a 1 mm-thick PDMS, at a 200 μs pixel dwell time. To investigate the dependence of the SRP signal on the Stokes power, the central lobe power of the pump beam was fixed to 0.6 mW and the central lobe power of the Stokes beam was changed from 0.5 to 7.35 mW, with a 0.5 mW increment. For the measurement of signal dependence on the pump power, the central lobe power of the Stokes beam was fixed to 4.2 mW and the central lobe powers of the pump beam were set to 0.02, 0.06, 0.13, 0.18, 0.26, 0.37, 0.44, 0.52 and 0.60 mW. In the noise analysis, the pump powers at the photodiode were set to 0.3, 0.9, 1.2, 1.7, 2.4 and 3 mW. Different concentrations of DMSO in D 2 O (10.92, 21.84, 43.75, 87.50, 175, 350, 700 and 1,400 mM) were used for the measurement of system sensitivity. The sample, stored in a quartz cuvette, has a thickness of 2 mm. The wavelength of pump beam was set to 798 nm to excite the DMSO Raman shift at 2,915 cm −1 ( Supplementary Fig. 17b ). The pixel dwell time was 1 ms for all the measurements. The central lobe powers of the pump and Stokes beams were 0.7 and 30 mW, respectively. For the SRS spectral measurement at 21.84 mM DMSO, the central lobe powers of the chirped pump and Stokes beams were ∼1.1 and ∼27 mW, respectively. Using the same method, we measured SRP signal from different concentrations of retinoic acid in D 2 O (0.05, 0.1, 0.25, 0.5, 1, 5 and 25 mM). The pump beam wavelength was tuned to 893 nm to excite the Raman shift at ∼1,583 cm −1 ( Supplementary Fig. 17c ). The pump and Stokes powers at the central lobe of the Bessel beams were 0.9 and 23 mW, respectively. The spectra of DMSO and retinoic acid were measured using spectral focusing method 43 .
SRP microscopic imaging
For the SRP microscopic imaging of polystyrene beads, the wavelength of the pump beam was tuned to 789 nm to excite the Raman shift at ∼3,058 cm −1 . The beads were suspended in a 1.5 wt% cured agarose gel to prevent particle movement during image acquisition. The sample mixture was sandwiched between two glass slides with ∼130 μm spacing. For the Gaussian beam modality, 50 sectional images were acquired at 2 μm per step in depth. The powers of the pump and Stokes beams at sample were ∼10 and ∼24 mW, respectively. The pixel dwell time was 10 μs and the image size was 200 × 200 pixels. The total acquisition time of an image stack was ∼20 s, excluding the time for data transfer and storage, and the sample stage moving along the depth direction. In the Bessel beam SRP modality, all the beads were resolved in one projection image obtained from a 2D lateral scan. The central lobe powers of the pump and Stokes beams were ∼1 and ∼30 mW, respectively. The pixel dwell time was 50 μs and the image size was 200 × 200 pixels. The total image acquisition time was ∼2 s. 3T3-L1 cells were also embedded in the cured agarose gel and sandwiched between two glass slides for imaging. The wavelength of the pump beam was tuned to 802 nm, exciting the 2,850 cm −1 Raman shift from lipids. We first acquired 50 sectional images at 1 μm per step in depth using the Gaussian beam SRS modality. The powers of the pump and Stokes beams at sample were ∼10 and ∼24 mW, respectively. The pixel dwell time was 10 μs and the image size was 300 × 300 pixels. The total acquisition time of the image stack was ∼45 s, excluding the time used for data transfer and storage, and the sample stage movement along the depth direction. The SRP projection image of the whole cell was acquired with the central lobe powers of pump and Stokes beams being 1 and 34 mW, respectively. The pixel dwell time was 10 μs and the image size was 300 × 300 pixels. The total image acquisition time was ∼0.9 s.
SRP tomographic imaging
For the SRP tomographic imaging of PMMA beads (10 μm), the wavelength of pump beam was tuned to 796 nm. The beads were first mixed with 1.5 wt% agarose gel, and then the sample mixture was cured in a cylindrical capillary tube (inner diameter: 50 μm; outer diameter: 80 μm). One end of the tube was attached to the fibre holder and the other end of the tube was inserted into a square capillary tube (inner width: 100 μm, wall thickness: 50 μm). The square capillary tube was then fixed on the slide holder to prevent sample movement during rotation. By rotating the capillary tube 1° per step, 180 projection images were collected with 24 μs pixel dwell time. Each image was 150 × 150 pixels. The whole imaged volume was ∼60 × 60 × 60 μm 3 . The central lobe powers of the pump and Stokes beams were ∼1.2 and ∼35 mW, respectively. For image comparison, the sectional image stack collected using the Gaussian modality contains 50 images, which were acquired at 1 μm per step. The total volume acquired in imaging was ∼60 × 60 × 50 μm 3 . The pixel dwell time was 10 μs. The powers of the pump and Stokes beams at sample were ∼13 and ∼25 mW, respectively. Similarly, we imaged a 100 μm PS bead in a volume of ∼320 × 320 × 320 μm 3 ( Supplementary Fig. 13 ). The total acquisition time for the SRP image stack was 47 s. The powers of the pump and Stokes beams at the central lobe were ∼3 and ∼35 mW, respectively. For the SRP tomographic imaging of the 3T3-L1 cells, the sample was prepared using a similar way as the beads. A total of 180 projection images were collected at 1° angle increment with 10 μs pixel dwell time. Each image was 300 × 300 pixels. The whole imaged volume was ∼150 × 150 × 150 μm 3 . The central lobe powers of pump and Stokes beams were ∼1 and ∼30 mW, respectively. The total acquisition time for the tomographic image stack was ∼162 s. The sectional image stack collected using the Gaussian modality contains 90 images, which were acquired at 1 μm per step. The total volume acquired in imaging was ∼150 × 150 × 90 μm 3 . The pixel dwell time and the image size were the same as those used in the SRP tomography. The powers of the pump and Stokes beams at sample were ∼13 and ∼25 mW, respectively. The Gaussian beam has an axial resolution of ∼0.65 μm. To image a volume with 150 μm depth, it requires >230 sectional images.
Image processing and reconstruction
Data acquisition and storage were performed on a lab-written software based on LabVIEW (National Instruments Corporation). The 2D images were processed and analysed using ImageJ. Parallel-beam-based FBP algorithm written in MATLAB (The MathWorks, Inc.) was used to reconstruct the 3D volume from the SRP images 34 . The total reconstruction time for a volume of 150 × 150 × 150 pixels was ∼50 s by using a personal computer (Inter Core i7-4702HQ CPU at 2.2 GHz, 8 GB RAM). The visualization and analysis of the SRP tomographic volume and the volume created from the sectioning images were accomplished using Amide. The detailed theory for Bessel beam SRP signal calculation, the materials used in this work and other experimental procedures can be found in Supplementary Notes 1–3 and Supplementary Methods .
Data availability
The data and codes that support the findings of this study are available from the corresponding author on reasonable request.
Supplementary Material Supplementary Information Supplementary Figures, Supplementary Table, Supplementary Notes, Supplementary Methods and Supplementary References. Supplementary Movie 1 Sectional images acquired by the Gaussian beam SRS microscope. Supplementary Movie 2 Reconstructed 3D volume in the simulated stimulated Raman projection tomography. Supplementary Movie 3 Reconstructed 3D volume containing PMMA beads by the stimulated Raman projection tomography. Supplementary Movie 4 Reconstructed 3D volume containing PMMA beads by the stimulated Raman scattering sectioning imaging. Supplementary Movie 5 Reconstructed 3D volume containing a 100 μm PS bead by the stimulated Raman projection tomography. Supplementary Movie 6 Reconstructed 3D volume containing a 3T3-L1 cell by the stimulated Raman projection tomography.
📊 Figures
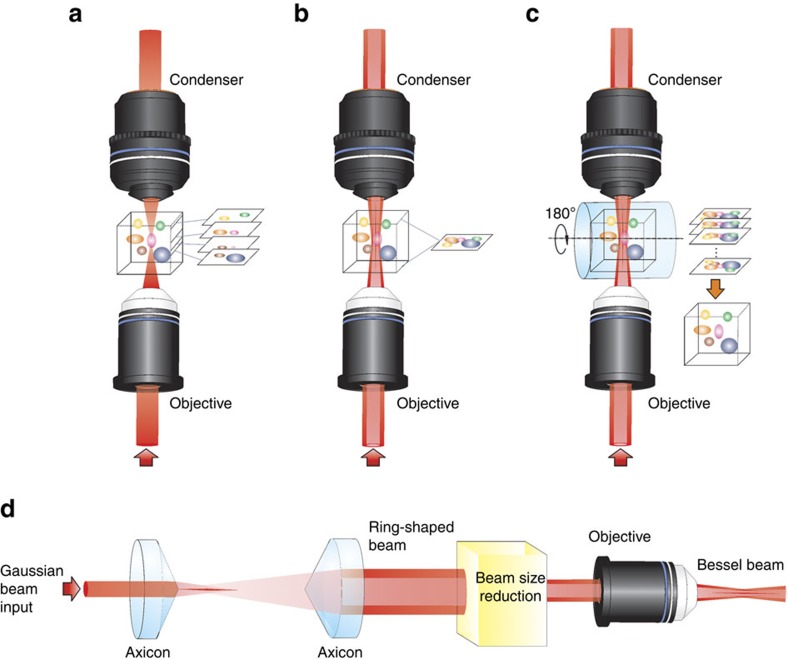
Figure 1
Volumetric imaging modalities based on stimulated Raman scattering.
( a ) Sectional imaging by the conventional Gaussian beam stimulated Raman scattering microscopy. ( b ) Stimulated Raman projection (SRP) microscopic imaging based on Bessel beams. ( c ) SRP tomograph...
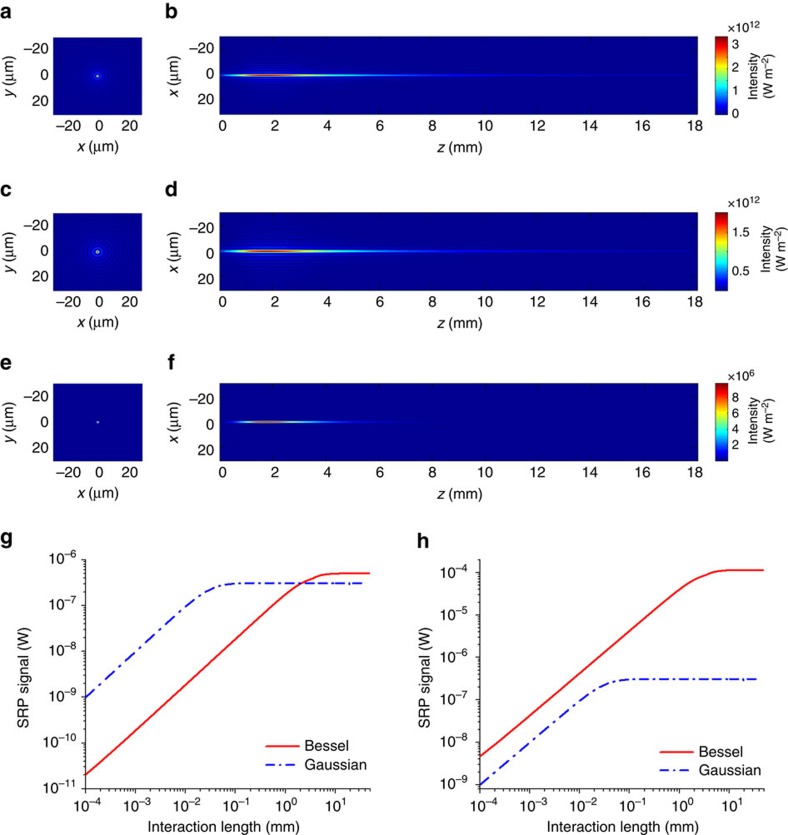
Figure 2
Numerical simulations of the Bessel beam intensity distributions and the stimulated Raman projection signal level.
( a ) The cross-sectional and ( b ) the longitudinal distributions of the pump beam intensity at the wavelength of 800u2009nm. The colour bar is the same for a , b . ( c ) The cross-sectional and ( d ...
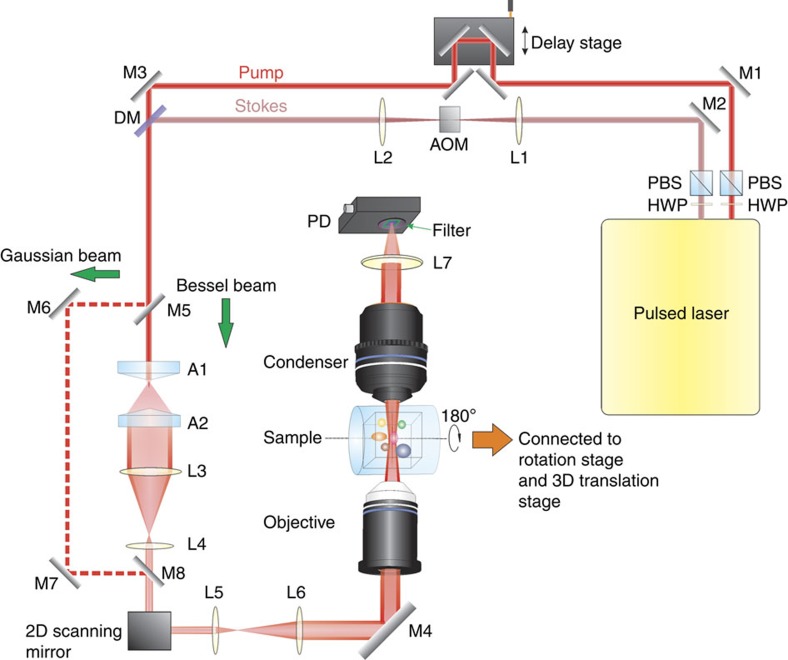
Figure 3
The experimental set-up of the stimulated Raman projection microscopic and tomographic imaging.
A tunable pulsed laser provides two synchronized femtosecond pulse trains as pump and Stokes beams. The Stokes beam is modulated by an AOM. The pump beam is first delayed by a translational stage, and...
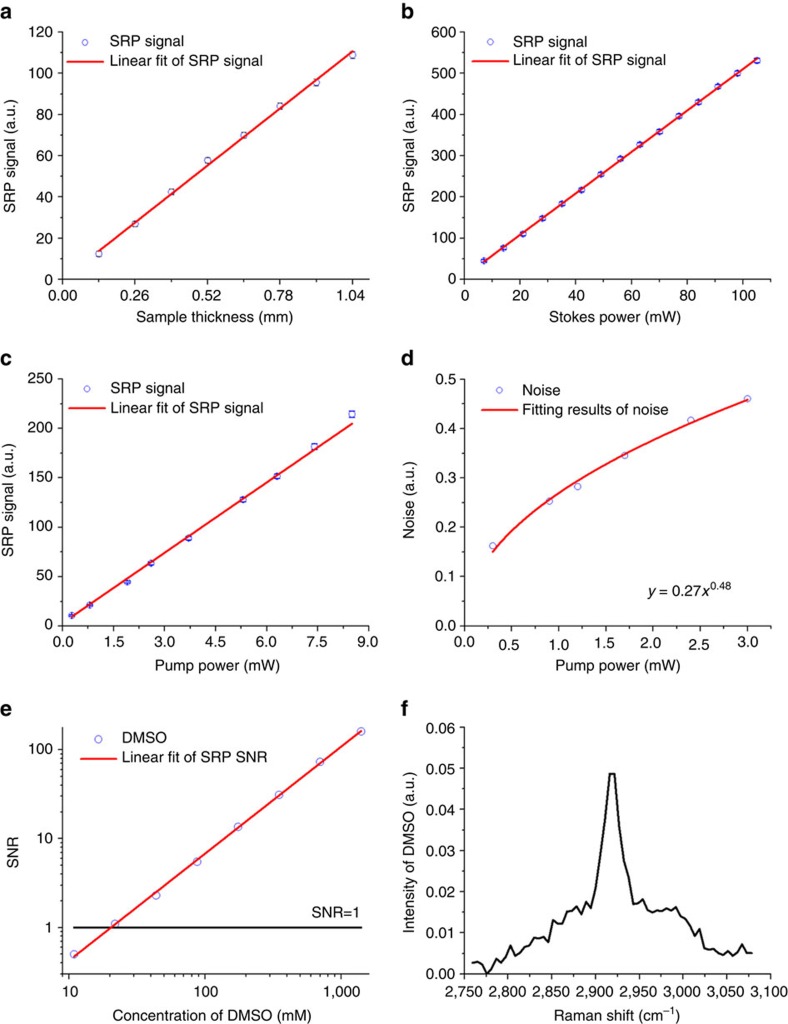
Figure 4
Characterization of the stimulated Raman projection microscope.
( a ) The measured stimulated Raman projection (SRP) signal from PDMS films as a function of the sample thickness. The red line is the linear fitting curve for the measured data points ( R 2 =0.9977)....
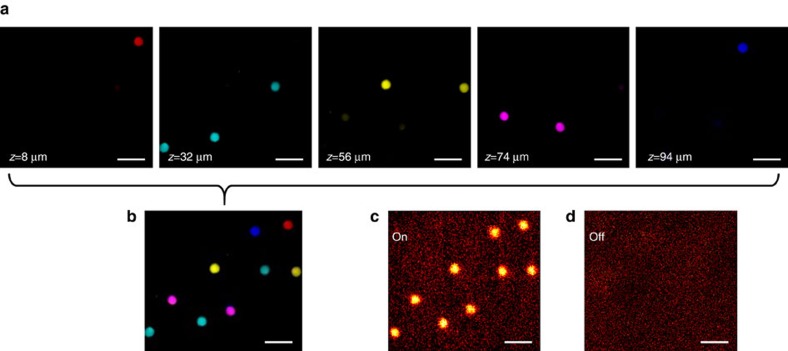
Figure 5
Volumetric imaging of polystyrene beads.
( a ) Sectional images acquired by the Gaussian beam stimulated Raman scattering (SRS) microscope at different depths of the sample volume. ( b ) Superposition of the sectional images in a . The false...
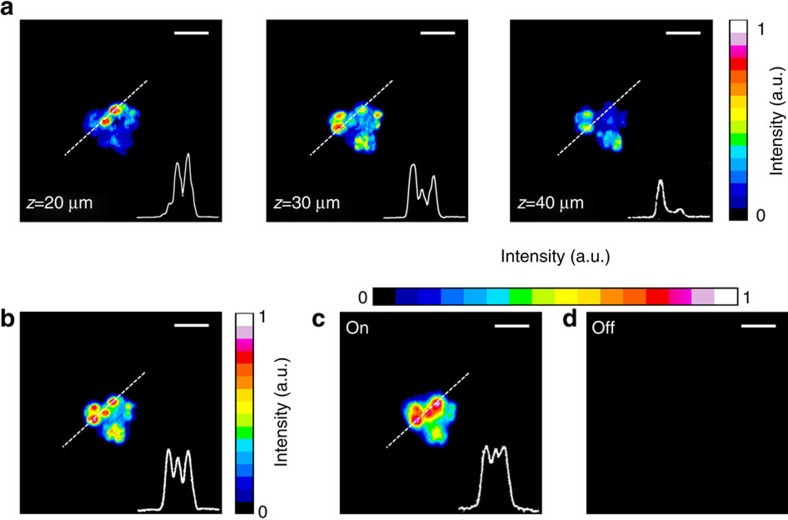
Figure 6
Volumetric imaging of a single adipose cell.
( a ) Sectional images acquired by the Gaussian beam stimulated Raman scattering (SRS) microscope at different depths of the sample. ( b ) Superposition of the 50 sectional images. Stimulated Raman pr...
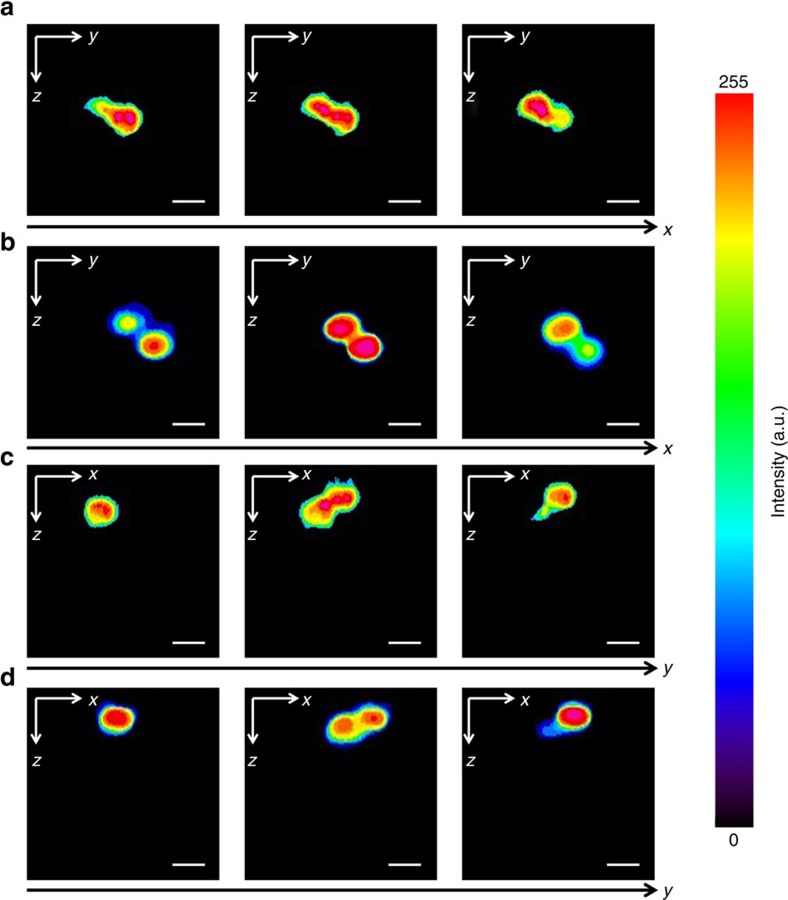
Figure 7
Comparing volumetric imaging results from stimulated Raman projection tomographic and stimulated Raman scattering sectional imaging.
( a , b ) Selected image slices of PMMA beads at different positions in the sagittal view ( yz plane). ( c , d ) Selected image slices from the same beads in the coronal view ( xz plane). ( a , c ) Im...
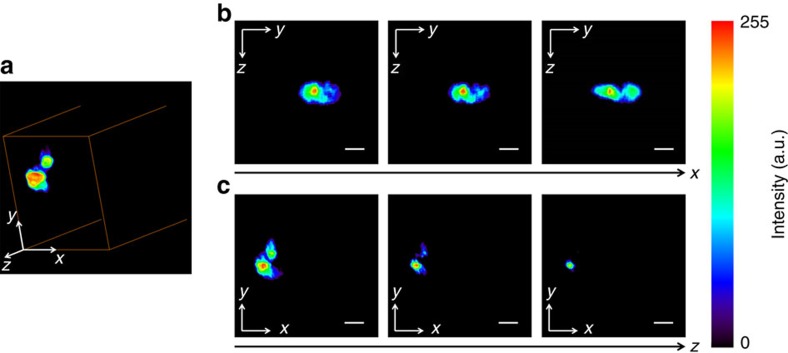
Figure 8
Volumetric imaging of a single adipose cell by stimulated Raman projection tomography.
( a ) Reconstructed 3D structure of a 3T3-L1 cell. ( b ) Selected image slices of the 3T3-L1 cell at different positions in the sagittal view ( yz plane). ( c ) Images from the same cell in the transv...
Figure images are served from the NIH/NLM PubMed Central Open Access Subset or Europe PMC; copyright remains with the publishers and authors.
💬 Discussion
0 commentsNo comments yet. Be the first to start a discussion!
Leave a Comment