Abstract
Transcellular propagation of tau aggregates may underlie the progression of pathology in Alzheimer's disease (AD) and other tauopathies. Braak staging (B1, B2, B3) is based on phospho-tau accumulation within connected brain regions: entorhinal cortex (B1); hippocampus/limbic system (B2); and frontal and parietal lobes (B3). We previously developed a specific and sensitive assay that uses flow cytometry to quantify tissue seeding activity based on fluorescence resonance energy transfer (FRET) in cells that stably express tau reporter proteins. In a tauopathy mouse model, we have detected seeding activity far in advance of histopathological changes. It remains unknown whether individuals with AD also develop seeding activity prior to accumulation of phospho-tau. We measured tau seeding activity across four brain regions (hippocampus, frontal lobe, parietal lobe, and cerebellum) in 104 fresh-frozen human AD brain samples from all Braak stages. We observed widespread seeding activity, notably in regions predicted to be free of phospho-tau deposition, and in detergent-insoluble fractions that lacked tau detectable by ELISA. Seeding activity correlated positively with Braak stage and negatively with MMSE. Our results are consistent with early transcellular propagation of tau seeds that triggers subsequent development of neuropathology. The FRET-based seeding assay may also complement standard neuropathological classification of tauopathies.
🔬 Techniques
🔭 Microscopes
💻 Software
✨ Fluorophores
🧪 Sample Preparation
🔬 Cell Lines
🏭 Microscope Brands
🧪 Reagent Suppliers
🎨 Filters
💻 Software Details
🏛️ Research Organizations (ROR)
Affiliated research institutions:
📋 Methods
Cell culture HEK 293T cells were grown in DMEM (Gibco) supplemented with 10% fetal bovine serum (Sigma-Aldrich), 1% penicillin/streptomycin (Gibco), and 1% GlutaMax (Gibco). Cells were cultured at 37 °C with 5% CO 2 in a humidified incubator. Brain Tissue We analyzed fresh-frozen specimens from brains that were previously categorized by qualified neuropathologists (C.L.W., N.J.C., P.T.N.). 40 subjects were staged according to Braak criteria as B1, B2, or B3 (defined as Braak I-II, Braak III-IV, or Braak V-VI, respectively). Subjects were diagnosed using standard tau histological measures (described below) and the 2012 criteria specified by the National Institute on Aging and the Alzheimer’s Association [ 5 , 22 ]. Samples consisted of grey matter obtained from four distinct brain regions (hippocampus, frontal lobe (Brodmann Areas 8/9), parietal lobe (Brodmann Areas 39/40), or cerebellum) typically affected differentially with tau pathology through AD progression. Negative control tissue was obtained from individuals with psychiatric disturbance, or diagnosed with Huntington’s disease. In total, 126 brain specimens were analyzed.
Sample preparation
Fresh-frozen brain tissues were suspended in TBS containing EDTA-free cOmplete protease inhibitors (Roche) such that the total concentration was 10% w/vol. Samples were homogenized at 75 watts with pulsing using a probe sonicator (Omni International) for 15 min on ice in a hood. Between each sample, we washed the probe with three isopropanol and distilled water rinses to prevent cross-contamination. Lysates were centrifuged at 23,000 × g for 15 min, and the supernatant was retained (total fraction). Protein concentration was measured with BCA (Pierce) and normalized between all samples at 2 µg/µl. Fractions were aliquoted and stored at −80 °C until further use to avoid multiple freeze/thaw cycles.
Show full methods section
Cell culture HEK 293T cells were grown in DMEM (Gibco) supplemented with 10% fetal bovine serum (Sigma-Aldrich), 1% penicillin/streptomycin (Gibco), and 1% GlutaMax (Gibco). Cells were cultured at 37 °C with 5% CO 2 in a humidified incubator. Brain Tissue We analyzed fresh-frozen specimens from brains that were previously categorized by qualified neuropathologists (C.L.W., N.J.C., P.T.N.). 40 subjects were staged according to Braak criteria as B1, B2, or B3 (defined as Braak I-II, Braak III-IV, or Braak V-VI, respectively). Subjects were diagnosed using standard tau histological measures (described below) and the 2012 criteria specified by the National Institute on Aging and the Alzheimer’s Association [ 5 , 22 ]. Samples consisted of grey matter obtained from four distinct brain regions (hippocampus, frontal lobe (Brodmann Areas 8/9), parietal lobe (Brodmann Areas 39/40), or cerebellum) typically affected differentially with tau pathology through AD progression. Negative control tissue was obtained from individuals with psychiatric disturbance, or diagnosed with Huntington’s disease. In total, 126 brain specimens were analyzed.
Sample preparation
Fresh-frozen brain tissues were suspended in TBS containing EDTA-free cOmplete protease inhibitors (Roche) such that the total concentration was 10% w/vol. Samples were homogenized at 75 watts with pulsing using a probe sonicator (Omni International) for 15 min on ice in a hood. Between each sample, we washed the probe with three isopropanol and distilled water rinses to prevent cross-contamination. Lysates were centrifuged at 23,000 × g for 15 min, and the supernatant was retained (total fraction). Protein concentration was measured with BCA (Pierce) and normalized between all samples at 2 µg/µl. Fractions were aliquoted and stored at −80 °C until further use to avoid multiple freeze/thaw cycles.
Biochemical extraction
Biochemical extraction was performed as described previously [ 10 ]. Total fractions (described above) were centrifuged at 100,000 × g for 60 min at 4 °C, and the supernatant was collected (soluble fraction). Pellets were resuspended in 1% sarkosyl, incubated for 30 min at room temperature with shaking, and centrifuged again at 100,000 × g for 60 min at 4 °C. The resultant pellet was resuspended in TBS (insoluble fraction) [ 9 ]. Soluble and insoluble tau fractions were standardized by volume for ELISA and seeding assays. Tau ELISA A total tau “sandwich” ELISA was performed as described previously [ 1 ]. All antibodies were kindly provided by Dr. Peter Davies (Albert Einstein College of Medicine). 96 well round-bottom plates (Corning) were coated for 48 hours at 4 °C with DA-31 (aa 150–190) diluted in sodium bicarbonate buffer (6 µg/mL). Plates were rinsed with PBS 3 times, blocked for 2 hours at room temperature with Starting Block (Pierce), and rinsed with PBS 5 additional times. Total (1 µL), soluble (1 µL), and insoluble (0.3 µL) fractions were diluted in SuperBlock solution (Pierce; 20% SuperBlock, diluted in TBS), and 50 µL sample was added per well. DA-9 (aa 102–150) was conjugated to HRP using the Lighting-Link HRP Conjugation Kit (Innova Biosciences), diluted 1:50 in SuperBlock solution, and 50 µL was added per well (15 µg/mL). Sample + detection antibody complexes were incubated overnight at 4 °C. Plates were washed with PBS 9 times with a 15 sec incubation between each wash, and 75 µL 1-Step Ultra TMB Substrate Solution (Pierce) was added. Plates were developed for 30 min, and the reaction was quenched with 2M sulfuric acid. Absorbance was measured at 450 nm using an Epoch plate reader (BioTek). Each plate contained a standard curve, and all samples were run in triplicate.
Biochemical Quantification
Tau concentration was calculated using GraphPad Prism software. Standard curves were made using 2N,4R recombinant protein (rPeptide) ranging from 15.6 to 1000 pg/mL and were fitted using the sigmoidal, 4PL, X=log(concentration) nonlinear regression model. Samples were diluted so that concentrations fell on the linear portion of the standard curve. Tau Seeding Tau seeding activity was quantified as detailed previously [ 17 , 21 ]. HEK 293T cells stably expressing the aggregation-prone repeat domain (RD) of tau containing the disease-associated P301S mutation tagged to either CFP or YFP were transduced with human brain homogenates. At 60–65% confluency, transduction complexes consisting of lysate (either 20 µg total, 2 µl soluble, or 5 µl insoluble fraction), Opti-MEM (Gibco), and Lipofectamine 2000 (Invitrogen) were added to cells. Following treatment, cells were incubated for 24 hr prior to harvesting for FRET flow cytometry. Prior to FRET flow cytometry, we always confirmed visible RD-CFP/YFP inclusions in positive wells. Standardized seeding activity, reported here, is a fold change over background level of biosensor cells treated with empty liposomes, which is arbitrarily set at 1% positivity in the FRET gate.
FRET Flow Cytometry
FRET flow cytometry was performed as described previously [ 17 , 21 ]. Following 24 hr treatment, cells were trypsinized, centrifuged, and fixed in 2% paraformaldehyde (Electron Microscopy Sciences). Cells were resuspended in flow cytometry buffer (HBSS, PBS, 1% FBS, and 1 mM EDTA) and analyzed using the MACSQuant VYB flow cytometer (Miltenyi Biotec). CFP, YFP, and FRET signals were detected with the following settings: CFP (405 laser; 450/50 filter), YFP (488 laser; 525/50 filter), FRET (405 laser; 525/50 filter). Samples were run in quadruplicate, and 15,000–20,000 singlets were captured per well.
Flow Cytometry Analysis
FlowJo v10 software was used for analysis. Gating strategy was similar to that described previously [ 17 , 21 ]. CFP and YFP spillover into the FRET channel were excluded using compensation and the “False FRET” gate. Empty liposome-treated cells were used as the baseline for background seeding, and FRET-positive events were identified from a FRET vs. CFP bivariate plot. The median fluorescence intensity (MFI) of FRET-positive events was recorded. Integrated FRET Density (IFD; the product of percent cells FRET-positive and MFI) is presented here. This integrates the amount of seeding per population of cells with the degree of seeding within a positive cell.
Confocal Microscopy
All cells were grown and treated on microslides. Cells were fixed with 4% paraformaldehyde, and confocal images were obtained with a Zeiss LSM 780 Inverted confocal/multiphoton microscope. Heat Map Heat maps were generated using MATLAB software (MathWorks). The Integrated FRET Density values were log-transformed and colored on a red scale. Values less than 1.5-fold above untreated controls (non-significant levels) are shaded with light blue. The remaining values are shaded from light-to-dark blue on a continuum, with the latter representing the highest fold increase in IFD. If no sample was available, the rectangle is filled with grey dots.
Immunohistochemistry
Paraffin sections were cut at 4 µm thickness on a rotary microtome, mounted on positively charged glass slides, and air-dried overnight. Sections were deparaffinized in xylene and alcohol, pretreated in 98% formic acid for 5 min at room temperature, and rinsed in water. Immunostaining was performed at room temperature on a Bond III automated immunostainer (Leica Biosystems Inc) using phospho-tau monoclonal antibody AT8 (Pierce Biotechnology; 1:200 for 30 minutes) and the Bond Polymer Refine detection system, which includes H 2 O 2 block, EDTA-based epitope retrieval solution, rabbit anti-mouse IgG secondary antibody, anti-rabbit poly-HRP-IgG, DAB, and hematoxylin counterstain. Sections were dehydrated in a graded series of ethanol dilutions and xylene, mounted on coverslips, and reviewed on a Ni-U light microscope (Nikon Instruments Inc.). For preparation of photomicrographs, slides were imaged on an Aperio ScanScope CS whole slide imager (Leica) using a 20X objective, and selected fields captured using Aperio ImageScope v12 software.
Statistics
For all seeding experiments, cells treated with empty liposomes served as the control group. We used a two-tailed t-test and set significance at p
📊 Figures
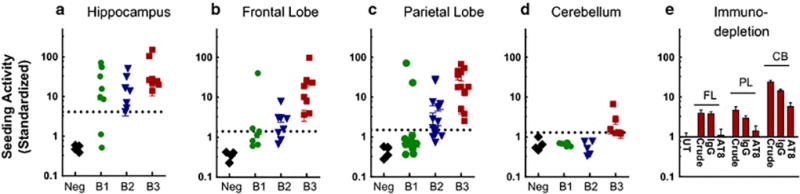
Figure 1
Tau seeding activity is present in multiple brain regions and increases with Braak stage
20 u00b5g of clarified human brain lysate was transduced into Tau-RD-P301S CFP/YFP biosensor cells, which were harvested for FRET flow cytometry after 24 hr. Hippocampus (a), Frontal Lobe (b), and Par...
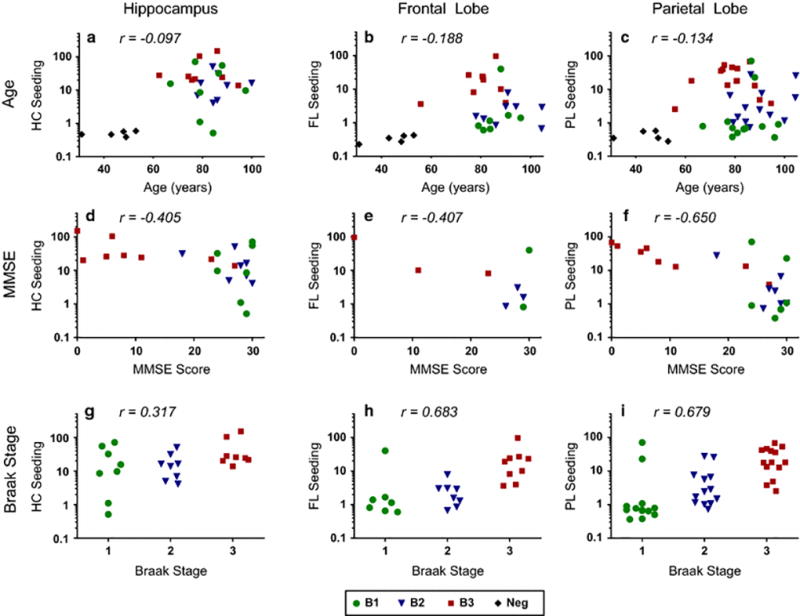
Figure 2
Correlation of tau seeding with MMSE and Braak stage
We evaluated seeding activity with subject age (au2013c), MMSE (du2013f) and Braak stage (gu2013i) using nonparametric Spearman correlational analyses. Age and seeding activity did not correlate; MMSE...
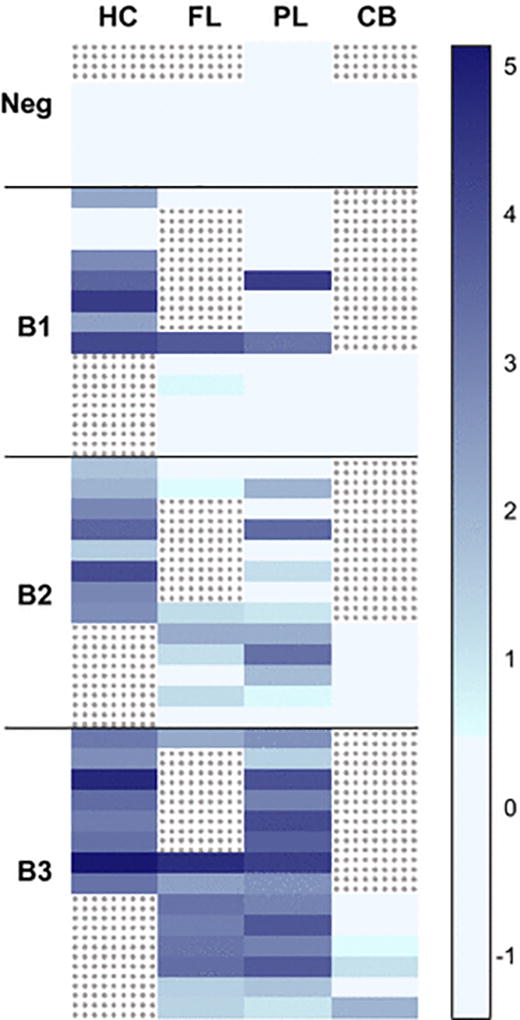
Figure 3
Seeding activity determined by region in individuals
Relative tau seeding activity was assessed in brain regions within the same individuals. Each row represents an individual subject (n=47), and each column represents a specific brain region. Samples n...
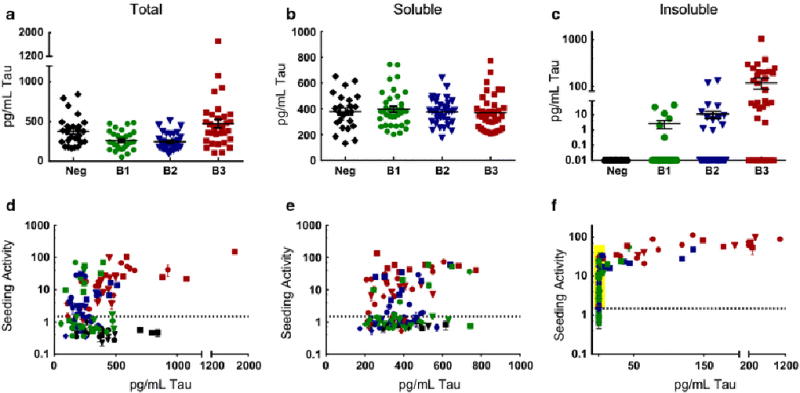
Figure 4
Biochemical characterization of brain homogenates
Brain lysates were biochemically extracted, and subsequent fractions were quantified using ELISA (au2013c) and FRET flow cytometry (du2013f). All samples contained total (a) and soluble (b) tau. Insol...
Figure images are served from the NIH/NLM PubMed Central Open Access Subset or Europe PMC; copyright remains with the publishers and authors.
💬 Discussion
0 commentsNo comments yet. Be the first to start a discussion!
Leave a Comment