Abstract
Morphogen gradients direct the spatial patterning of developing embryos; however, the mechanisms by which these gradients are interpreted remain elusive. Here we used lattice light-sheet microscopy to perform in vivo single-molecule imaging in early Drosophila melanogaster embryos of the transcription factor Bicoid that forms a gradient and initiates patterning along the anteroposterior axis. In contrast to canonical models, we observed that Bicoid binds to DNA with a rapid off rate throughout the embryo such that its average occupancy at target loci is on-rate-dependent. We further observed Bicoid forming transient “hubs” of locally high density that facilitate binding as factor levels drop, including in the posterior, where we observed Bicoid binding despite vanishingly low protein levels. We propose that localized modulation of transcription factor on rates via clustering provides a general mechanism to facilitate binding to low-affinity targets and that this may be a prevalent feature of other developmental transcription factors.
🔬 Techniques
🔭 Microscopes
🧬 Organisms
💻 Software
✨ Fluorophores
🧪 Sample Preparation
🏭 Microscope Brands
🧪 Reagent Suppliers
📷 Detectors
🔎 Objectives
🎨 Filters
💻 Software Details
💾 Data Repositories
🏛️ Research Organizations (ROR)
Affiliated research institutions:
📋 Methods
Fly husbandry
All fly cages were prepared by combining males and females of the desired strains in a plastic cage left for at least 3 d at room temperature in light prior to imaging. The lids on the cages were filled with agar dissolved in apple juice (2.4% [g/w] Bacto agar, 25% apple juice, 75% distilled water, 0.001% mold inhibitor from solution of 0.1g/mL [Carolina, 87-6165]). A paste of dry yeast was smeared on the lids to induce egg laying. Lids were exchanged once each day. The fly strain used for all wild-type BCD imaging experiments was yw ; his2av-mrfp1; BcdE1, egfp-bcd . This fly line results in embryos in which only the labeled BCD is expressed, indicating proper functionality and expression levels ( Gregor et al. 2007 ). For the zld − experiments, bcd-egfp heterozygous virgins with zld − germline cells (maternal germline clones prepared as in Liang et al. (2008) were crossed to yw males, and progeny were used for imaging 2–3 h after laying. The heterozygosity results in only half of the BCD labeled in the zld − embryos. For photobleaching controls, the line used was yw, his2av-egfp ; +/+ (Bloomington no. 24163).
Live embryo collection for imaging
For embryo collection, lids on fly cages were exchanged 1 h prior to imaging. After 1 h, embryos were collected from the lids using an inoculation loop. A 5-mm-diameter glass coverslip (Warner Instruments, no. 64-0700) was prepared by immersion in a small amount of glue (prepared by dissolving adhesive from about one-fifth of a roll of double-sided Scotch tape overnight in heptane) and left to dry for 5–10 min while collecting embryos. Collection was performed on a dissection scope with transillumination. Embryos were bathed in Halocarbon oil 27 (Sigma) for staging and then selected between developmental stages 1 and 4. Selected embryos were placed on a small square of paper towel and then dechorionated in 100% bleach for 1 min. Bleach was wicked off with a Kimwipe after 1 min, and then the square was washed with a small amount of distilled water. Excess water was wicked off the square, and the square was dipped in a small water bath. Unpunctured embryos that floated to the top of the bath were selected for imaging and placed on a small paper towel square to slightly dry. To prevent excess desiccation, embryos were immediately placed on the glass coverslip in rows and then immersed in a drop of phosphate-buffered saline (PBS). LLSM Imaging was performed using a home-built lattice light-sheet microscope ( Supplemental Fig. S1 ) following the design described by Chen et al. (2014a ) and detailed blueprints provided by the Betzig group at the Howard Hughes Medical Institute Janelia Research Campus. To perform the single-molecule experiments, we added a detection module containing two EMCCDs (Andor iXon Ultra) for dual-color imaging. The EMCCDs provided a significant improvement in signal to noise over the sCMOS (Hamamatsu Orca Flash version 2.0) used in the original system and made it possible to use lower excitation powers while maintaining single-molecule sensitivity. In brief, the output beam from each laser was expanded and collimated independently to a size of 2.5 mm. The expanded beams for each laser were combined and input into an acoustic optical tunable filter (AOTF) to allow for rapid switching between excitation wavelengths and adjustment of power ( Supplemental Fig. S1A ). A pair of cylindrical lenses was then used to elongate and collimate the output Gaussian beam to illuminate a stripe on a spatial light modulator (SLM). The SLM was used to generate a coherent pattern of an array of 30 Bessel beams spaced such that they coherently interfered to create a two-dimensional (2D) optical lattice pattern with a maximum numerical aperture (NA) of 0.6 and minimum NA of 0.505. A 500-mm lens was used to project the Fourier transform of the SLM plane onto an annular mask conjugate to the back pupil plane (BPP) of the excitation objective to spatially filter the pattern ( Supplemental Fig. S1B ). The BPP was then projected first onto a galvo scanning mirror for z -scanning and then onto a second galvo scanning mirror for x-dithering. The x-galvo scanning plane was projected onto the BPP of the excitation objective ( Supplemental Fig. S1C ). The excitation objective focused the lattice pattern onto the sample, exciting any fluorophores within the axial range (∼400 nm) of the sheet. The emitted fluorescence was collected by the detection objective, which was oriented orthogonally to the excitation objective and projected onto an intermediate image plane by a 500-mm tube lens ( Supplemental Fig. S1D ). An 80- and 200-mm lens pair was then used to demagnify the image further to provide a 100-nm sampling per pixel on each of the EMCCD sensors. A dichroic mirror (Semrock, FF560-FDi01) was placed between the last lens pair to allow for dual-color imaging in red and green with maximal spectral separation. An emission filter was placed in the path of each camera to both reject the excitation wavelengths and select the wavelength range of interest (Semrock, FF03-525/50 for eGFP and FF01-593/46 for RFP) ( Supplemental Fig. S1E ). During each camera exposure, the x-galvo mirror was dithered twice over a 5.1-µm range in 100-nm steps to provide uniform illumination. The prepared coverslip, with embryos arranged in rows as described above, was then loaded into the sample holder and secured onto the positioning stages of the lattice light-sheet microscope. The sample chamber was filled with PBS for imaging and kept at room temperature. The slide was then scanned to find an embryo of suitable age (between nuclear cycles 10 and 11), and the positions of the anterior and posterior extremes of the embryo were then marked. For each data set acquired, the stage position was recorded to determine the position as a fraction of the embryonic length (EL) as the distance of the position from the anterior pole divided by the total length of the embryo. For the RT measurements on BCD-eGFP, a 488-nm excitation laser was used with a power of 2.9 mW measured at the back pupil plane of the excitation objective. Images were acquired with 100-msec exposure times and an EM gain setting of 300. At each location, at least 1000 frames were acquired, resulting in a total time of 105 sec with a frame rate of 105 msec. Prior to and after acquiring the BCD-eGFP data, an image was taken in His2-AVmRFP using a 561-nm excitation laser at an excitation power of ∼0.17 mW at the back pupil plane to determine the nuclear cycle phase; data not acquired during interphase were discarded upon examination of these images. For RT measurements at 500-msec exposure times, the 488-nm excitation laser power at the back pupil plane was reduced to 0.5 mW; all other settings were the same as above. For the displacement distribution measurements, the exposure time was set to 10 msec, resulting in a frame rate of 15 msec, and the excitation power was increased to 8.28 mW for the 488-nm laser line. All other settings were the same as described above. Viability of the embryos was determined by allowing them to develop until gastrulation after imaging. For the zelda embryos, lethality was confirmed after imaging.
Show full methods section
Fly husbandry
All fly cages were prepared by combining males and females of the desired strains in a plastic cage left for at least 3 d at room temperature in light prior to imaging. The lids on the cages were filled with agar dissolved in apple juice (2.4% [g/w] Bacto agar, 25% apple juice, 75% distilled water, 0.001% mold inhibitor from solution of 0.1g/mL [Carolina, 87-6165]). A paste of dry yeast was smeared on the lids to induce egg laying. Lids were exchanged once each day. The fly strain used for all wild-type BCD imaging experiments was yw ; his2av-mrfp1; BcdE1, egfp-bcd . This fly line results in embryos in which only the labeled BCD is expressed, indicating proper functionality and expression levels ( Gregor et al. 2007 ). For the zld − experiments, bcd-egfp heterozygous virgins with zld − germline cells (maternal germline clones prepared as in Liang et al. (2008) were crossed to yw males, and progeny were used for imaging 2–3 h after laying. The heterozygosity results in only half of the BCD labeled in the zld − embryos. For photobleaching controls, the line used was yw, his2av-egfp ; +/+ (Bloomington no. 24163).
Live embryo collection for imaging
For embryo collection, lids on fly cages were exchanged 1 h prior to imaging. After 1 h, embryos were collected from the lids using an inoculation loop. A 5-mm-diameter glass coverslip (Warner Instruments, no. 64-0700) was prepared by immersion in a small amount of glue (prepared by dissolving adhesive from about one-fifth of a roll of double-sided Scotch tape overnight in heptane) and left to dry for 5–10 min while collecting embryos. Collection was performed on a dissection scope with transillumination. Embryos were bathed in Halocarbon oil 27 (Sigma) for staging and then selected between developmental stages 1 and 4. Selected embryos were placed on a small square of paper towel and then dechorionated in 100% bleach for 1 min. Bleach was wicked off with a Kimwipe after 1 min, and then the square was washed with a small amount of distilled water. Excess water was wicked off the square, and the square was dipped in a small water bath. Unpunctured embryos that floated to the top of the bath were selected for imaging and placed on a small paper towel square to slightly dry. To prevent excess desiccation, embryos were immediately placed on the glass coverslip in rows and then immersed in a drop of phosphate-buffered saline (PBS). LLSM Imaging was performed using a home-built lattice light-sheet microscope ( Supplemental Fig. S1 ) following the design described by Chen et al. (2014a ) and detailed blueprints provided by the Betzig group at the Howard Hughes Medical Institute Janelia Research Campus. To perform the single-molecule experiments, we added a detection module containing two EMCCDs (Andor iXon Ultra) for dual-color imaging. The EMCCDs provided a significant improvement in signal to noise over the sCMOS (Hamamatsu Orca Flash version 2.0) used in the original system and made it possible to use lower excitation powers while maintaining single-molecule sensitivity. In brief, the output beam from each laser was expanded and collimated independently to a size of 2.5 mm. The expanded beams for each laser were combined and input into an acoustic optical tunable filter (AOTF) to allow for rapid switching between excitation wavelengths and adjustment of power ( Supplemental Fig. S1A ). A pair of cylindrical lenses was then used to elongate and collimate the output Gaussian beam to illuminate a stripe on a spatial light modulator (SLM). The SLM was used to generate a coherent pattern of an array of 30 Bessel beams spaced such that they coherently interfered to create a two-dimensional (2D) optical lattice pattern with a maximum numerical aperture (NA) of 0.6 and minimum NA of 0.505. A 500-mm lens was used to project the Fourier transform of the SLM plane onto an annular mask conjugate to the back pupil plane (BPP) of the excitation objective to spatially filter the pattern ( Supplemental Fig. S1B ). The BPP was then projected first onto a galvo scanning mirror for z -scanning and then onto a second galvo scanning mirror for x-dithering. The x-galvo scanning plane was projected onto the BPP of the excitation objective ( Supplemental Fig. S1C ). The excitation objective focused the lattice pattern onto the sample, exciting any fluorophores within the axial range (∼400 nm) of the sheet. The emitted fluorescence was collected by the detection objective, which was oriented orthogonally to the excitation objective and projected onto an intermediate image plane by a 500-mm tube lens ( Supplemental Fig. S1D ). An 80- and 200-mm lens pair was then used to demagnify the image further to provide a 100-nm sampling per pixel on each of the EMCCD sensors. A dichroic mirror (Semrock, FF560-FDi01) was placed between the last lens pair to allow for dual-color imaging in red and green with maximal spectral separation. An emission filter was placed in the path of each camera to both reject the excitation wavelengths and select the wavelength range of interest (Semrock, FF03-525/50 for eGFP and FF01-593/46 for RFP) ( Supplemental Fig. S1E ). During each camera exposure, the x-galvo mirror was dithered twice over a 5.1-µm range in 100-nm steps to provide uniform illumination. The prepared coverslip, with embryos arranged in rows as described above, was then loaded into the sample holder and secured onto the positioning stages of the lattice light-sheet microscope. The sample chamber was filled with PBS for imaging and kept at room temperature. The slide was then scanned to find an embryo of suitable age (between nuclear cycles 10 and 11), and the positions of the anterior and posterior extremes of the embryo were then marked. For each data set acquired, the stage position was recorded to determine the position as a fraction of the embryonic length (EL) as the distance of the position from the anterior pole divided by the total length of the embryo. For the RT measurements on BCD-eGFP, a 488-nm excitation laser was used with a power of 2.9 mW measured at the back pupil plane of the excitation objective. Images were acquired with 100-msec exposure times and an EM gain setting of 300. At each location, at least 1000 frames were acquired, resulting in a total time of 105 sec with a frame rate of 105 msec. Prior to and after acquiring the BCD-eGFP data, an image was taken in His2-AVmRFP using a 561-nm excitation laser at an excitation power of ∼0.17 mW at the back pupil plane to determine the nuclear cycle phase; data not acquired during interphase were discarded upon examination of these images. For RT measurements at 500-msec exposure times, the 488-nm excitation laser power at the back pupil plane was reduced to 0.5 mW; all other settings were the same as above. For the displacement distribution measurements, the exposure time was set to 10 msec, resulting in a frame rate of 15 msec, and the excitation power was increased to 8.28 mW for the 488-nm laser line. All other settings were the same as described above. Viability of the embryos was determined by allowing them to develop until gastrulation after imaging. For the zelda embryos, lethality was confirmed after imaging.
Curation of data for analysis
For all data sets, the following procedure was followed: First, for each movie, the corresponding before and after histone images were checked for any evidence of chromatin condensation to ensure that analysis was performed only in interphase nuclei. Data from mid to late nuclear cycle 14, where the nuclei exhibit an elongated shape, were also excluded. A metadata file was then created for each movie file containing the position as a fraction of the EL (0 for anterior and 1 for posterior), the nuclear cycle (determined by counting the number of mitoses before the 14th cycle). Visual examination of the data set was used to determine whether there was any motion of the nuclei during the acquisition period. Movies that contained any detectable motion were discarded or cropped to include only the time interval in which there was no motion. A rectangular region of interest was then drawn around each nucleus that was then used to crop areas around individual nuclei. The boundary of each nucleus was then marked using a hand-drawn polygon. A masked movie was then created for each nucleus in which regions outside the nucleus were set to 0 grayscale values so that all of the analyses described below were performed only on molecules within nuclear regions. Single-molecule localization and tracking using dynamic multiple-target tracing (MTT) Localization and tracking of single molecules were conducted using a Matlab implementation of the MTT algorithm ( Serge et al. 2008 ). In brief, the algorithm first performed a bidimensional Gaussian fitting to localize particles constrained by a log-likelihood ratio test subject to a localization error threshold. Deflation looping was performed to detect molecules that were partially overlapping. The parameters of the localization and tracking algorithms were empirically determined through iterative examination of the results. For all data sets, the following settings were used: For localization, the maximum number of deflation loops was set to 10, and localization error was set to 10 −6 . For tracking, the maximum expected diffusion coefficient was set to 5 µm 2 /sec, the maximum number of competitors was set to 1, and the maximum off/blinking frames was set to 1. RT analysis The RTs were estimated from the 100-msec data using the results from the single-particle tracking using the MTT algorithm. The data were pooled into bins corresponding to the position along the A–P axis of the embryo in one-third fractions of the EL (0–1 anterior to posterior) with the following number of nuclei and single-molecule trajectories per position bin: anterior: 34 nuclei, 17,735 trajectories; middle: 70 nuclei, 40,092 trajectories; and posterior: 83 nuclei, 20,823 trajectories. In the ZLD embryos, we measured the following number of nuclei and single-molecule trajectories per position bin: anterior: 23 nuclei, 11,415 trajectories; middle: 31 nuclei, 7572 trajectories; and posterior: 31 nuclei, 3606 trajectories. The survival probability distribution was then calculated as 1 − the cumulative distribution function of the trajectory lengths and was fit to both single- and double-exponential models ( Mazza et al. 2012 ). The double-exponential model fit the data better in all cases ( Supplemental Figs. S3, S4 ). The model used to fit the data and calculate the time constants and fraction of the population was surival probability ( t ) = A [ F a e − k s t + ( 1 − F a ) e − k n s t ] , where k s and k n s are the low (specific) and high (nonspecific) off rates, respectively. The total pooled data sets of 78,650 trajectories from the MTT results from 187 nuclei were also fit in the same manner. To correct for photobleaching, we used His2Av-eGFP to estimate the bleaching constant (0.00426 sec −1 ) and correct the off rate as k s,corrected = k s − k bleach .( Supplemental Table S1 ). We note that the bleaching correction had a minimal effect on our estimated off rates. The fact that we were not limited by bleaching due to the transient nature of BCD binding was further validated through even longer, 500-msec exposure time measurements on 17 nuclei, which provided an estimate for the specific and nonspecific off rates that did not differ significantly from those measured at 100 msec ( Supplemental Fig. S4 ; Supplemental Table S1 ). The results of the fits to all data are shown in Supplemental Table S1 .
FRAP
Experiments were performed on a Zeiss LSM 800 laser scanning confocal system (coupled to a Zeiss Axio Observer Z1) using a plan-achromat 63×/1.4 NA oil immersion objective, a GaAsP-PMT detector, and a 488-nm laser. A circular bleach region with a diameter of 1.5 µm was used, the bleach location was selected manually in each nucleus at approximately the center, and a total bleach time of 78.1 msec was used. Data were acquired for at least 1 sec prior to bleaching and at least 6 sec after bleaching, with a time interval of 0.430 msec. Experiments were performed using live embryos from the same fly line as for lattice light-sheet imaging and were collected and prepared in the same manner as described above with the exception of the mounting procedure. For FRAP, the embryos were mounted between a semipermeable membrane (Biofolie, In Vitro Systems and Services) and a coverslip and then embedded in Halocarbon 27 oil (Sigma). As in the case of the single-molecule measurements, the embryos were staged using the HIS2-AV-MRFP channel, and all data were acquired on embryos in nuclear cycle 13. The data were acquired on 21 nuclei, all within the first 25% of the embryonic length from the anterior pole. FRAP experiments could not be performed at more anterior locations due to the low BCD concentrations and thus signal to noise ratio. For analysis, the spatial and temporal locations of the bleach region were retrieved from the metadata recorded by the microscope control software and manually verified by inspecting the data. Due to the short duration of the movies and rapid recovery, drift correction was not necessary. Each nucleus was manually segmented from the rest of the image by defining a polygon region of interest. A region of interest the same size as the bleach region was also marked in an area of each image outside of the nuclear region to be used to measure the background or dark intensity. The FRAP curve for each nucleus was then calculated as follows: First, the mean intensity in the nuclear region, I nuc ( t ), bleach region, I bleach ( t ), and background region, I dark ( t ), was calculated at each frame. The background intensity was then subtracted from both the mean nuclear and bleach region intensities. To correct for photobleaching from imaging, the bleach region intensity was then divided by the mean nuclear intensity at each time point. The resulting photobleaching-corrected intensity was then normalized to the mean prebleach intensity, calculated as the average intensity in all frames prior to bleaching ( I prebleach) . The final FRAP curve for each nucleus was thus calculated as FRAP( t ) = {[ I bleach ( t ) − I dark ( t )]/[ I nuc ( t ) − I dark ( t )]} I prebleach . The calculated FRAP curves for each nucleus were then aligned to the bleach frame and averaged to generate the average FRAP curve shown in Figure 1 D. The averaged recovery data were then fit to both a single-exponential [1 − A × exp(− ka × t )] and double-exponential [1 − A × exp(− ka × t ) − B × exp(− ka × t )] model ( Supplemental Fig. S5A,B ) to measure the recovery time constants. There was no significant difference in the quality of fit between the two models. For comparison, the exact same experimental and analysis procedure was followed for His2AV-MRFP1 ( Supplemental Fig. S5C ) in the same embryos with the exception of using a 561-nm bleach laser; three nuclei were measured with these settings. For the histone measurements, the two-exponent fit was significantly better than the one-exponent, as expected.
Displacement distribution analysis
Single-molecule trajectories were analyzed as described above. A total of 158 nuclei from four embryos was analyzed. The data from nuclei were binned according to their position along the A–P axis in one-third fractions of the EL (0–1, anterior to posterior) with the following number of nuclei and single-molecule displacements per bin: In the anterior-most (0–0.2) positions, tracking could not be performed reliably due to the high concentrations of BCD at those locations at these high frame rates and presumably a large mobile population: anterior: 30 nuclei, 12,923 trajectories; middle: 67 nuclei, 23,640 trajectories; and posterior: 66 nuclei; 8600 trajectories. The fraction of the population that is bound versus mobile was estimated using two approaches. First, a cumulative distribution function of the displacements was calculated for each EL bin ( Supplemental Fig. S6 ); displacements corresponding to distances
📊 Figures
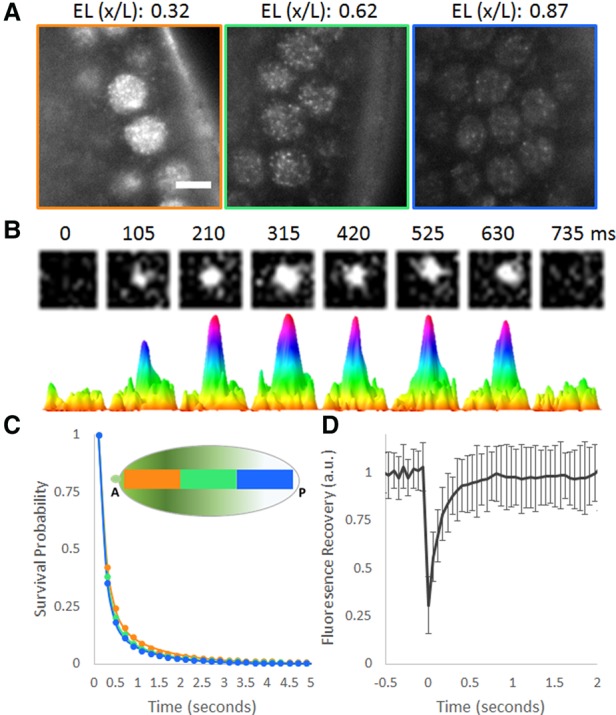
Figure 1.
Single-molecule kinetics of BCD in living Drosophila embryos. ( A ) Raw images of BCD-eGFP molecules in a living Drosophila embryo acquired with a 100-msec exposure time. Bar, 5 u00b5m. Positions alon...
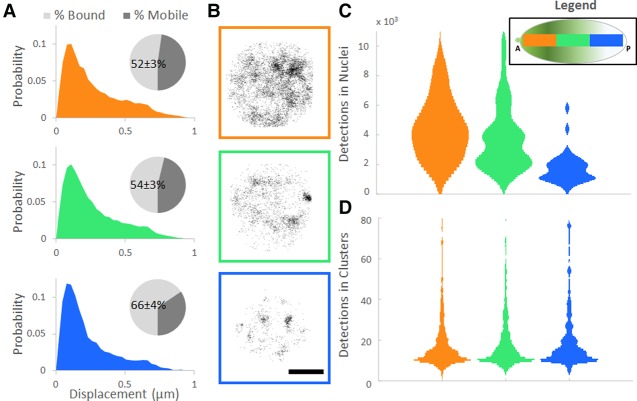
Figure 2.
Local modulation of BCD concentration. ( A ) Normalized probability distributions of measured displacements in the anterior (30 nuclei), middle (67 nuclei), and posterior (66 nuclei) positions of the ...
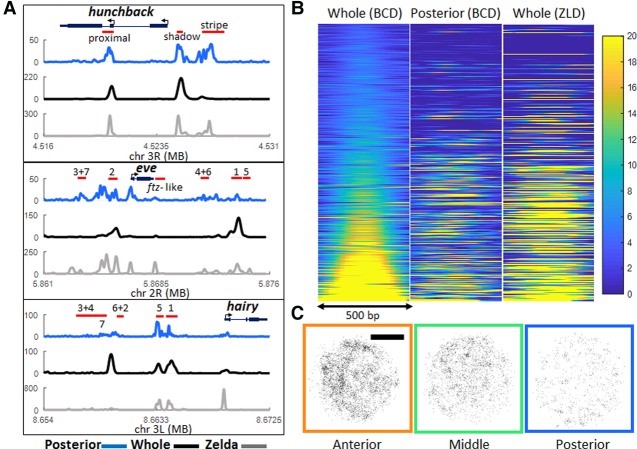
Figure 3.
ZLD mediated BCD binding in the posterior embryo. ( A ) Posterior third (blue) and whole embryo (black) BCD and whole embryo ZLD (gray). ChIP-seq signal-normalized reads at the hunchback , eve , and h...
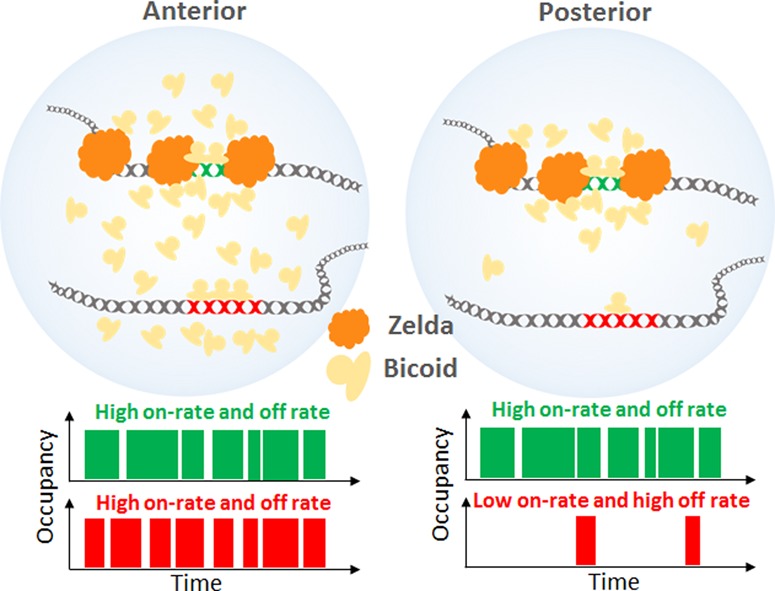
Figure 4.
Model of ZLD-dependent modulation of the BCD on rate at specific loci in the posterior embryo. At high concentrations in the anterior of the embryo, all target sites are highly occupied. At low concen...
Figure images are served from the NIH/NLM PubMed Central Open Access Subset or Europe PMC; copyright remains with the publishers and authors.
💬 Discussion
0 commentsNo comments yet. Be the first to start a discussion!
Leave a Comment